Some years ago Matt Pharr wrote an excellent blog post series,
“Swallowing the elephant”, in which
he describes various optimizations done in pbrt using Disnay’s
Moana Island Scene.
Recently I was optimizing Blender’s OBJ importer,
and the state of it in the end was “the bottlenecks are not OBJ specific anymore”. I was looking for
some larger test scene to import, noticed that the Moana scene got a USD version done in 2022,
and started to wonder how well that would import into Blender.

So yeah. It takes almost four hours until the import is finished, and then Blender crashes while trying to display it in the viewport. Not quite usable! Here’s a story of random optimizations that I did, and some learnings along the way.
Setting the expectations
The initial state (Blender ~3.3 codebase in May 2022) was: import of Moana USD scene takes 12300 seconds (3.5 hours; on Windows, Ryzen 5950X).
After a round of optimizations described below, the same import takes 82 seconds (1.5 minutes). So I made it import 150 times faster, and read below why “X times faster” is sometimes not a good
description.
In both cases, after the import is done, Blender tries to display the scene, and crashes in rendering related code. That is for someone to investigate some other day :)
I should clarify that USD itself is not directly relevant; what I was looking for, and what I
tried to optimize, was the general “how does Blender behave when lots of objects are being created”
(part of overall “Blender editing performance with many datablocks” open task).
USD just happened to be the format of the largest scene I had available – it contains about 260 thousand objects,
and that’s what stresses various places of Blender – not “parsing the files” or similar, but just the “I’m creating 260
thousand objects, send help” bit.
The optimizations
As previously, I used
Superluminal profiler while on Windows, and Xcode Instruments while on Mac,
looked at where they said was a major time sink, and thought about how to address them. The five independent optimizations I did were:
Collection Sync
Stop doing “sync view layer collection” work after each imported object is created;
instead create all the objects and then sync the view layer once
(D15215 - for both USD and Alembic importers;
OBJ importer already got that previously).
A more proper fix would be to get rid of this “each object creation needs to sync view layer”
thing completely (T73411). That would speed up a
lot more places than just importers, but is also a lot more involved. Honestly, I don’t even know
what the view layer collection thing is :)
Material Maps
Stop building “which USD material name maps to which Blender material” mapping for each object
being imported. Instead, build that map once, and update it with newly imported materials
(D15222).
Material Assignment
When assigning materials to just imported meshes, stop scanning the whole world (twice!) for
possible other users of said meshes. Due to how Blender data structures are done right now, a
“mesh data block” can have materials set up on it, and then the “object data block” that uses
said mesh also has to have a materials array of the same size. Now, several “objects” can
use the same “mesh”, so what the code was doing is, whenever setting a material on a mesh,
it was scanning the whole world for which other objects use this mesh, and update their
materials array to match in size.
But! Specifically in importer related code, all that scanning is pointless – the importers
know which objects and meshes they create, there’s no need to scan the whole universe! So
that was D15145 and applies to USD, Alembic and OBJ
importers.
Unique Name Checks
Rework the way Blender ensures all objects have unique names
(D14162).
All references in Blender are name/path based (contrast to for example Unity, where all
references are GUID based). But for that to work, all the objects have to have unique names
– you can’t have say ten Cube objects since you’ll have no way of referring to the specific one.
Whenever an object is created or renamed, Blender does a “is name unique? if not, adjust until it is”
work, so while your first Cube can be just that, the second one would become Cube.001 and so on.
The way it was doing that, was basically “walk though all the objects, checking if a name is unique”.
This does not scale to huge object counts, and there was an open task for a few years to address it
(T73412), and so I did it.
This one is the most involved and “most risky” among all the optimizations. It is not related to
any import related code, but rather touches core Blender data structures that possibly affect everything.
So potential for accidental bugs is huge! But also, the benefits ripple out to everything –
any operation that creates possibly many objects gets faster. For example, Shift+D duplicating 10 thousand cubes goes from 9 seconds down to 2 seconds. Yay!
Pre-sort Objects
Unique name checks used to be the bottleneck, but with that gone, another smaller bottleneck appears –
sorting objects by name. Whole of Blender assumes that all the objects are always sorted in the “Main
database” object lists. So whenever a new object is created, it needs to get inserted into the proper
place in the list.
The name sorting code is written under assumption that generally, objects are created in already sorted-by-name
order – it tries to find the proper places for objects going backwards from the end of the list. So within
importer code, we can first pre-sort the objects by name, and only then create them. And
that was D15506 (applies to USD and OBJ importers).
Dawson’s First Law of Computing
What is common among all these optimizations, is that they all address Dawson’s First Law of Computing:
O(n^2) is the sweet spot of badly scaling algorithms: fast enough to
make it into production, but slow enough to make things fall down once it gets there.
See Dawson’s tweet,
“quadratic” tag on his blog,
Accidentally Quadratic tumblr.
All of the things mentioned above are quadratic complexity in terms of object count in the scene.
And these can happen fairly accidentally: say you have a function “set a material on a mesh” (as
Blender does), and then whoops, someone finds that it needs to make sure all the objects that use said
mesh need to have a little bit of massaging when the material is set. What’s the lowest-effort way of
doing that? Of course, right inside the function, go through the whole world, and for all the objects
that use this mesh, do this little bit of massaging.
And that’s fine if you are setting one material
on one mesh. And, because computers are really fast these days, you won’t even notice if you
are setting up materials on a thousand meshes. So what if this does a million tiny checks now?
That’s a fraction of a second.
But, try to do that on a hundred thousand meshes, and suddenly the (ten billion) x (tiny things)
product is not so tiny anymore.
I wrote about this back in 2017, in the context of shader variants combinatorial explosion
(post):
Moral of the story is: code that used to do something with five things years ago
might turn out to be problematic when it has to deal with a hundred. And then a
thousand. And a million. And a hundred billion. Kinda obvious, isn’t it?
The moral this time might be, try to not have functions that work on one object, and are
O(N_objects) complexity. They absolutely might be fine when called on one object. But sooner
or later, someone will need to do that operation on N objects at once, and whoops suddenly you are in
quadratic complexity land.
This is the same “when there is one, there’s more than one” guideline that DOD (data oriented design)
ideas are saying: express operations in terms of doing them efficiently on a whole batch of things
at once. Doing them on just one thing can be just a special case of that.
Another thing that is Blender specific, is linked lists. Blender codebase and some of the core
data structures go back all the way to 1994. Back then, linked lists were a data structure held in
high esteem – simple, elegant, can insert/remove items in any place! It was not until around
2000, when due to rise of both the computation-to-memory gap (and thus CPU caches), and also multi-core
programming, when people realized that arrays tend to run circles around linked lists. Way fewer cache
misses, and in many cases you can process array of items in parallel. My understanding is that within
Blender, there is “a wish” to gradually go away from linked lists in core data structures (like the name
sorting issue above). Someday!
“N times faster!” can be misleading
“Ten times faster” is
clear and unambiguous in isolation, but does not compose when multiple
speedups are talked about cumulatively. Using the optimizations I did above, applied in that order,
each of them would have this much speedup:
| Optimization Step |
Speedup (X times faster) |
| Collection Sync |
1.12 |
| Material Maps |
1.03 |
| Material Assignment |
3.16 |
| Unique Name Checks |
5.77 |
| Pre-sort Objects |
7.10 |
So you would think that “well clearly that last one is the best optimization”. But it’s not! The
speedup factor is order-dependent. Because the preceding optimization steps shaved off so much time
from the whole process, the last one gets to enjoy “7x faster!” while it only changed the time
from 10 minutes down to 1.5 minutes.
Instead, when talking about multiple isolated things, where each of them adds or saves something,
it might be better to talk about their absolute times. That’s why performance people in games tend
to talk about “how many milliseconds does system X take in the frame”, because you can add milliseconds
up, in any order you want. Similarly, when optimizing something, you might want to talk about
“time saved” in absolute terms.
For this same “import Moana scene” case, here are the savings of each optimization step:
| Optimization Step |
Time saved (minutes) |
| Collection Sync |
22 |
| Material Maps |
6 |
| Material Assignment |
123 |
| Unique Name Checks |
46 |
| Pre-sort Objects |
8 |
Or more visually:
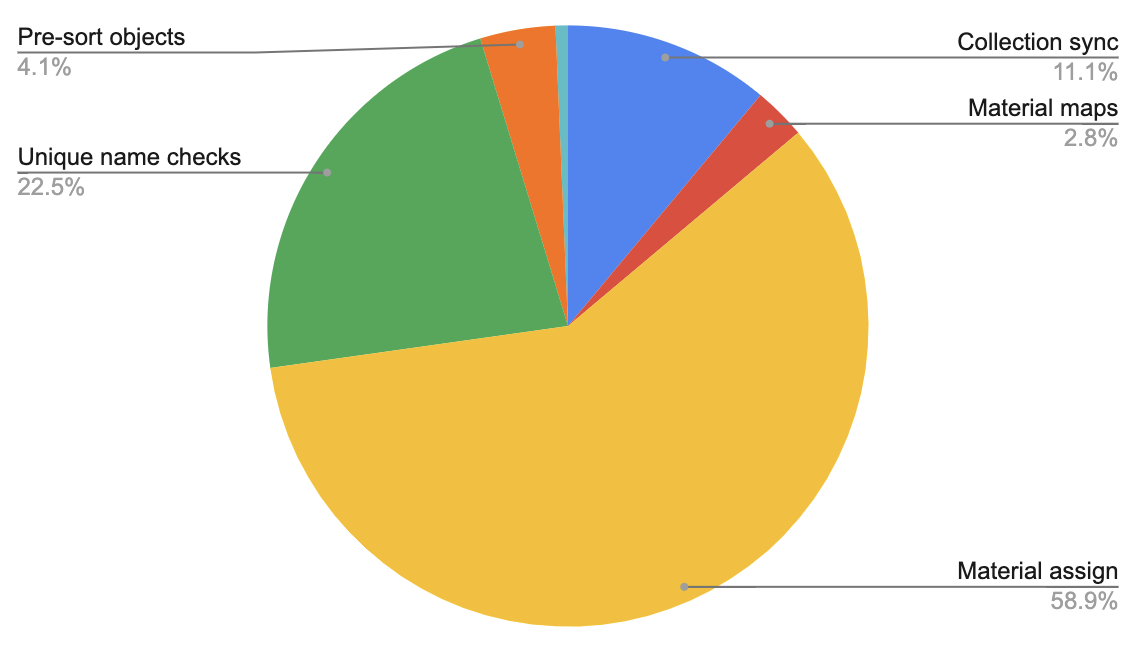
The tiny light blue sliver is the final time for import, left after all the optimizations applied.
Clearly optimizing material assignment brought the most absolute time savings.
And that’s it! All the optimizations above have already landed to Blender 3.3 (currently in alpha).
None of them were really complex or clever, just noticing some quadratic complexities and trying to stop them
being quadratic.