Speeding up Blender .obj import
A while ago I wrote about speeding up Blender’s Wavefront OBJ exporter. All that landed into Blender 3.2. And since that was quite a nice experience, I started to look into the OBJ importer…
Existing Python importer
Blender 3.1 and earlier has an OBJ importer written in Python. From a quick look, it was written “ages ago” and has largely unchanged since then. I’m going to test it on several files:
rungholt: “Rungholt” Minecraft map from McGuire Computer Graphics Archive. 270MB file, 2.5M vertices, 1 object with 84 materials.splash: Blender 3.0 splash screen ("sprite fright"). 2.5GB file, 14.4M vertices, 24 thousand objects.


Test numbers are from my Windows PC, Blender built with Visual Studio 2022 in Release mode, AMD Ryzen 5950X (32 threads), PCIe 4.0 SSD. Times are seconds that it takes to do a full import.
| rungholt | splash | |
|---|---|---|
| 3.1 python | 54.2 | ~14000 |
Now, I know next to nothing about Python. Are these numbers good or not? 🤷♀️ My guesses are:
A minute to read through couple hundred megabytes of text (rungholt) does not feel fast.
Four hours for the splash scene does sound excessive! I suspect it runs into some
“other” bottleneck than pure calculations – the memory usage quickly grows to 20GB during import,
and then stays there, with CPU usage not even fully utilizing one core. The machine does have 64GB of
memory though; it’s definitely not swapping. Quick profiling just shows all the time inside some Python DLL
without debug symbols. Maybe Python decides to, for example, run the garbage collector after each
and every allocation, once it reaches “some” amount of allocated memory? I’ve no idea.
Finishing up existing GSoC project
During Google Summer of Code 2020, there was a project to rewrite OBJ exporter & importer in C++. The exporter part had just been finished and landed into Blender 3.1 (which I’ve further optimized for Blender 3.2, see previous blog post).
The importer was not quite finished yet; it had a final report, initial diff done in late 2020, and a bunch of mainline code merges & some fixes on a branch done in 2021.
So the first task was to try to finish that one up. This meant a bunch of merges, adding automated tests, fixing about 20 bugs/issues uncovered by manual or automated testing, going through code review and so on. And then all of that landed during Blender 3.2 alpha! 🎉 Here’s the performance of it:
| rungholt | splash | |
|---|---|---|
| 3.1 python | 54.2 | ~14000 |
| 3.2 C++ initial | 14.2 | 109 |
 And then a bunch more fixes followed, and by now almost all known issues are fixed.
The new importer also uses quite a bit less memory, e.g. during import of rungholt it uses up 1.9GB of memory,
compared to 7.0GB of the python importer.
rungholt is about 4 times faster, and splash is over a hundred times faster. 🥳
Yay, we’re done here! Or… are we?
Optimizing it some more!
Similar to the previous blog post, I used Superluminal profiler while on Windows, and Xcode Instruments while on Mac. And then looked at what they pointed out, and thought about whether that could be sped up. Here’s a list:
- Replace number parsing
std::stof/std::stoiwith C++17from_chars.- But! You’d think that C++17 is fully supported since Clang 5
(docs) and GCC 5
(docs), but there are caveats…
For example:
from_charson floating point numbers did not get implemented until Clang 14 and GCC 11 🤦♀️. - So I added an external library fast_float by Daniel Lemire to do that. That library/algorithm is what’s used in clang/llvm 14, so should be pretty good.
- But! You’d think that C++17 is fully supported since Clang 5
(docs) and GCC 5
(docs), but there are caveats…
For example:
- Stop reading input file char-by-char using
std::getline. Instead read in 64kb chunks, and parse from there, taking care of possibly handling lines split mid-way due to chunk boundaries. - Remove abstractions for splitting a line by some char. For example face parsing was done by first splitting
a line like
f 1/2/3 4/5/6into:- First into keyword
fand “the rest”1/2/3 4/5/6, - Then into corners: array with [
1/2/3,4/5/6], - Then splitting each corner by slash into indices: array [
1,2,3]; array [4,5,6]. - All of these individually are not much, but quickly add up. Now the parser is mostly a single
forward scan through the input line: find
f, decide it’s a face, scan for integers separated by slashes or spaces. No extra vector allocations or multiple scans over the string.
- First into keyword
- Avoid tiny memory allocations: instead of storing a vector of polygon corners in each face, store all the corners in one big array, and per-face only store indices “where do corners start, and how many”. Likewise, don’t store full string names of material/group names for each face; only store indices into overall material/group names arrays.
- Blender specific:
- Stop always doing mesh validation, which is slow. Do it just like the Alembic importer does: only do validation if found some invalid faces during import, or if requested by the user via an import setting (which defaults to off).
- Stop doing “collection sync” for each object being added; instead do the collection sync right after creating all the objects.
All really simple stuff, without any fancy things like “multi threading” or “SIMD” or “clever algorithmic optimizations”. Is that faster? Why, yes, a bit:
| rungholt | splash | |
|---|---|---|
| 3.1 python | 54.2 | ~14000 |
| 3.2 C++ initial | 14.2 | 109.2 |
| 3.2 C++ opts | 7.0 | 49.1 |
Note that the times here are what it takes to do the full import. Parsing the OBJ file is only a part
of that, for example in splash scene it “only” takes about 12 seconds, the rest of the time is
creating Blender objects out of the parsed data. Some places there could be optimized
too, and likely would benefit other importers besides OBJ. Some other day, maybe…
These optimizations also have landed to Blender 3.2 alpha. Yay!
What about other OBJ parsers?
“Wait, but why did Blender have to write a new OBJ parser in C++? Aren’t there dozens of them written already?!”, you ask. That’s a very good question, that I don’t know the answer to. My guess would be on a combination of:
- The new OBJ importer started as a Google Summer of Code project, and they tend towards “write new code!”, and much less, if at all, “integrate existing code into another codebase”.
- Blender might have needed some obscure functionality that is not supported by existing OBJ parsing
libraries. For example, line continuations (
\), importing NURBS curves, etc. Anything that was supported by the previous Python importer, but not supported by the new importer, would be a regression in functionality. - Most of actual complexity of the importer is not in the OBJ “parser”, but rather in the code that does something with the parsed result - creates Blender mesh structures and material node graphs.
- Maybe people who started all of this were not aware of existing OBJ parsing libraries? :)
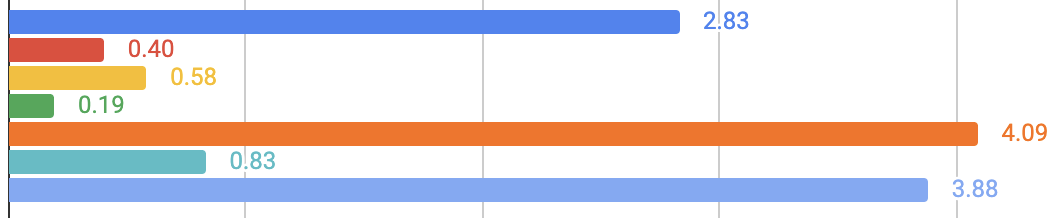
All that said… yes, at least a performance comparison with some existing OBJ parsing libraries would be in order, so that we’d know whether the parser in Blender is anywhere near being “okay”. And that will be a topic of an upcoming blog post. Here’s a teaser without spoilers:
…while gathering data for this upcoming blog post, I noticed one more strange thing, so here’s about it:
Sometimes string_view / StringRef is not free
While comparing Blender’s OBJ parser performance with other libraries on both Windows and Mac, I noticed a “hey wait, this feels like something is too slow on Windows” type of thing in the Blender parser. For example, it would be similar performance to another parsing library on a Mac, but slower than the same library on Windows.
Now, these are different processors (AMD Ryzen 5950X vs Apple M1 Max), with different architectures (Intel vs ARM), different compilers (Visual Studio vs clang), and different operating systems. Any of these factors could affect performance. But still, something felt off.
Some more profiling and a bit of looking at disassembly later… it was due to convenience usage of Blender’s
StringRef class (which is pretty much like C++17
string_view, but was done before they had C++17).
StringRef / string_view is just a “window” into some larger existing string. It’s very simple: just a pointer to characters, and the count of characters. A struct with two simple members, that does not allocate memory, does not do anything complicated, is trivially copy-able etc. etc. Surely it’s an abstraction that any Decent Compiler should be able to completely optimize out, right?!
The OBJ parser was using StringRef for convenience, with functions like “skip whitespace” or “parse a number” taking an input StringRef (representing the input line), and returning a new StringRef (representing the remainder of the line). For example:
StringRef drop_whitespace(StringRef str)
{
    while (!str.is_empty() && is_whitespace(str[0]))
        str = str.drop_prefix(1);
    return str;
}
This is convenient, but does more work than strictly needed – while parsing, only the “beginning” of the line ever changes by moving forward; the end of the line always stays the same. We can change the code to take a pair of pointers (begin of line, end of line) as input, and make the functions return the new begin of line pointer:
const char *drop_whitespace(const char *p, const char *end)
{
    while (p < end && is_whitespace(*p))
        ++p;
    return p;
}
“lol are you serious? doing things like that should not matter; the compiler optimizers these days are amazing!” - someone probably from the internet.
Calling Conventions enters the chat.
What’s the difference in the two functions above? They both take what is “two things” as input arguments (StringRef case: pointer to start, length; raw pointer case: two pointers). The StringRef function returns two things as well, i.e. the new StringRef object. The raw pointer version just returns a pointer.
Turns out, the Microsoft calling convention for 64-bit Intel architecture says that values up to 64 bits in size are returned in a CPU register, whereas larger values are returned via memory (SIMD values use slightly different rules). And that’s the rule of the platorm, and the compilers must abide. This not specific to Visual Studio compiler; Clang on Windows must do the same as well (and it does).
Whereas Mac and Linux use a different calling convention; on 64-bit Intel architecture values up to 128 bits in size can be returned in a pair of CPU registers. This is probably the case for 64-bit ARM on Windows too (link).
And that’s the curious performance difference, that turned out to be very much Windows + Intel specific, in an otherwise completely platform agnostic code. The fix has just landed for Blender 3.3 alpha.
| rungholt | splash | |
|---|---|---|
| 3.1 python | 54.2 | ~14000 |
| 3.2 C++ initial | 14.2 | 109.2 |
| 3.2 C++ opts | 7.0 | 49.1 |
| 3.3 C++ StringRef opt | 5.8 | 45.5 |
And that’s a potential lesson: in functions heavily used in performance critical code paths, you might want to watch out for calling convention details! E.g. on Windows w/ Intel architecture, check whether your extremely often called functions return values larger than 64 bits. And check if not doing that speeds things up. It might!
So there. Right now OBJ importing is between 10x and 300x faster compared to previous Python importer, and about 2.5x faster compared to initial state of the C++ importer when I found it. Is ok.
…and that’s it for now. Until the next post about various OBJ parsing libraries!