Speeding up Blender .obj export
This tweet by @zeuxcg sparked my interest:
If you think of Ryu as the gold standard of shortest correctly rounded floating point output, note that there’s still active research happening in this area, with papers from 2020-2021 (Schubfach, Dragonbox), with both being noticeably faster than Ryu.
and then I was thinking “interesting, if I’d find some code that prints a lot of floats, I should test out these new algorithms”. And then somehow I was casually profiling Blender’s .obj exporter, noticed that it spends most of the time inside fprintf, and was <💡>.
Note: I was profiling Blender 3.1 beta build, where it has a new obj exporter, written in C++ (previous one was written in Python). This new exporter is already 8x-12x faster than the old one, nice!
Typical reactions to the observation
Now, internet being internet, there are a bunch of “typical reactions” you might get when you notice something and raise a question about it. Especially if you’re measuring performance of a new, hot, fast! thing and wondering whether it might be somewhat suboptimal. Here’s a sampling of actual responses I got for the “obj exporter spends most of it’s time inside fprintf” observation:
- “If 95% of the time is in fprintf then the export is super fast”
- “The obj exporter generates files, right? So we need some kinda of fprint”
- “Text based exporter, spends most its time in printf, news at 11”
- “I think fprintf does by block flushing by default on files” (in response that a buffer above fprint might be useful)
- “Is perf actually an issue? I mean if it spends 145 of 178 ms exporting a super large file”
- “I don’t think that mutex locks add a significant amount of overhead here, because everything is on a single thread”
- “That’s 20 lines full of potential off by one errors” (response to adding buffering above fprintf, ~20 lines of code)
- “If you are I/O bound, memory mapping your files makes a big difference”
In many situations like this, people are raising valid questions, or expressing sensible doubts, or repeating “common wisdom”. That’s fine! This is all well meaning, and beyond my very selective “hot takes” listed above, the discussions were healthy and productive. Sometimes answering the initial questions, discussing the doubts and ignoring the usual common wisdom might lead to interesting places.
Test setup
I was mostly measuring .obj file export times on two different scenes:
monkey: a heavily subdivided object (monkey head at subdivision level 6). Produces 330MB obj file with one object.splash: blender 3.0 splash screen ("sprite fright"). Produces 2.5GB obj file with 24303 objects inside of it.


All the test numbers are from my Windows PC, Blender built with Visual Studio 2022 in Release mode, AMD Ryzen 5950X (32 threads), PCIe 4.0 SSD. It would be useful to have numbers from other compilers/setups, but I only have this one PC at the moment…
Now, again - the new obj exporter in Blender 3.1 is way faster than the old one. On monkey old→new is 49.4s→6.3s, on
splash it’s 392.3s→48.9s. Very, very nice.
Initial observations
First off, “is perf actually an issue” question. No, we are not at “milliseconds” – exporting splash takes 50 seconds, and that
is not even a large scene by today’s standards.
Next up, we need to figure out whether we’re I/O bound. We could do a back-of-the-napkin calculation like: this SSD has a theoretical write speed of up to 4GB/s, so writing out a 2.5GB obj file should take under a second. Of course we’re not gonna reach the maximum write speed, but we’re off by 50 times.
We could also use some actual profiling, for example with the most excellent Superluminal. It says that
WriteFile takes ~1.5 seconds. However, fprintf takes a whopping 41.5 seconds. So yes,
the exporter does spend absolute majority of its time calling a standard library function to format a string and write
it out to a file, but the actual “write to a file” portion is tiny.
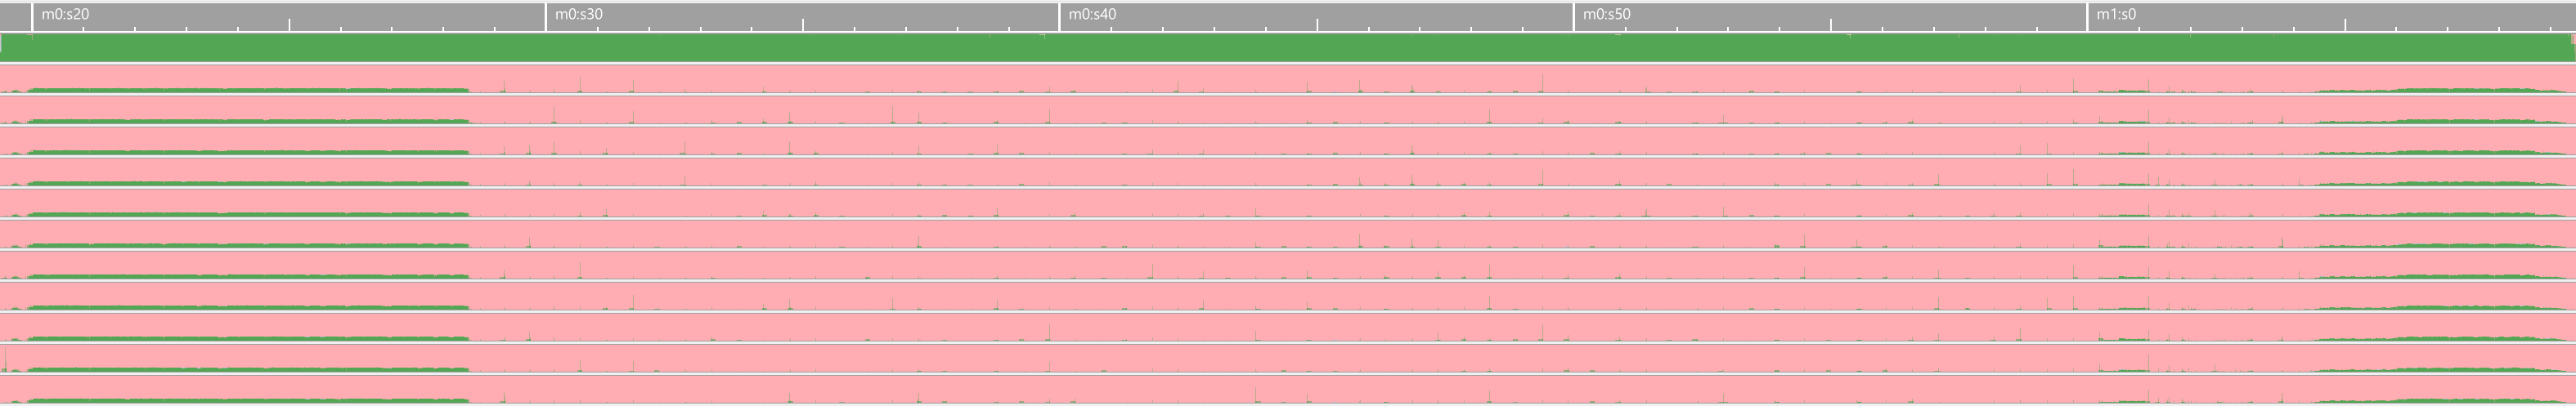
The screenshot above is the thread timeline from Superluminal, while exporting the splash scene. Time is horizontal axis
(all 50 seconds of it), and each row is a thread. I cropped out most other threads; they show very similar patterns anyway.
We can see the main thread being busy all the time (mostly inside fprintf), with occasional tiny activities on the
job threads; these are multi-threaded mesh evaluations that Blender has (e.g. “get me all the geometry edges” and so on).
A buffer above fprintf
The Blender 3.1 obj exporter is written in a way where there’s quite many calls to fprintf(). For example, each vertex
is doing an equivalent of fprintf(f, "v %f %f %f\n", x, y, z), and for mesh face definitions there are multiple
calls for each face.
Each and every call to fprintf ends up doing several “overhead” things: taking a mutex lock around the file object, and looking
up the current system locale via thread local storage. Yes, then eventually all the C standard FILE output ends up using “some”
buffering mechanism, but the mutex/locale overhead is something that you still pay for every function call.
The I/O buffering mechanism used internally by C runtime functions also varies from system to system. For example, on Windows / MSVC,
the default I/O buffer size (BUFSIZ) is 512 bytes. That seems fairly small, eh? Probably the value was chosen
back in 1989, and now it can’t ever be changed, since that would break backwards compatibility.
Anyway, a manually implemented buffer (64 kilobytes) of where text is appended into via snprintf, that gets written into a file once
it’s full, was like 20 lines of code (and yes, 20 lines of possible off-by-one errors, as someone pointed out). 48.9s→42.5s.
Not stellar, but not bad either.
Multi-threading all that printing
Now that the exporter output does not go directly into the file, but rather into “some memory buffer”, we could split the work up into multiple threads! Recall how the thread timeline showed that one thread is busy doing all the work, while all the others are twiddling thumbs.
There are several possible ways of splitting up the work. Initially I started like (pseudocode):
for each object:
    parallel for: write vertices
    write resulting text buffers into the file
    parallel for: write normals
    write resulting text buffers into the file
    parallel for: write texture coordinates
    write resulting text buffers into the file
    ...
but this approach does not scale all that well for small meshes. There were also some complexities involved in writing mesh face data, where there’s some amount of sequential logic that needs to be done for smoothing groups & material groups.
So I did this instead:
parallel for each object:
    write vertices
    write normals
    write texture coordinates
    ...
write resulting text buffers into the file
Here’s the resulting thread timeline, with time axis using the same scale as previous. 42.5s→12.1s:

Not bad! Of course this speedup is only there when exporting multiple objects; when exporting just a single mesh there’s not much threading going on. It could be improved by parallelising on both objects and within each object, i.e. combining the two pseudocode approaches above, but that’s an exercise for the reader (see Update below).
Caveat: now the exporter uses more memory. Previously it was just building whatever data structures it needed to hold
exported object data, and then wrote output directly into a file. Now, it produces the file output into memory buffers (one for each
object), before writing them out sequentially after all the thread jobs are finished. Additional memory usage while exporting the splash
test case:
- New Blender 3.1 exporter: +0.6GB.
- My multi-threaded exporter: +3.1GB. That’s quite an increase, however…
- Old Blender 3.0 exporter: +14.8GB!
Writing text files is not free
Digging more into where time is spent, Superluminal was pointing out that fwrite took 4.7s, but the actual WriteFile underneath
was only about 1.5s. What’s the overhead? Writing a “text” file.
Turns out, the new exporter code was opening FILE with "w" write mode, which on Windows means: find all the LF newlines
in the written bytes, and change them into CRLF newlines. So it can’t just route my 64 kilobyte text chunks for writing; it needs
to scan them, chop into smaller lines or into some other buffer, etc. etc.
Really, that was just a bug/oversight in the new exporter code, since Blender’s documentation
explicitly says:
“OBJ’s export using Unix line endings \n even on Windows”.
Changing file write mode to binary "wb" made that overhead disappear, 12.1s→8.7s:

Nice! That thread timeline is getting thinner.
Did you know? When Foo Fighters sing “lately I’ve been measuring / seems my time is growing thin”, that’s about a successful optimization story. The song is about someone working on a character deformation system: “skin and bones, skin and bones, skin and bones don’t you know?”
Multi-threading object data preparation
Before the exporter could start producing the final .obj file output, there is some preparation work needed. Basically it has to gather data from Blender’s data structures/format into something suitable for .obj format. Some of that work was already internally multi-threaded by Blender itself, but the remaining part was still mostly single threaded, and was taking about half of all export time now.
So the next logical step is to make the data extraction part parallel too, where possible. The final flow looks roughly like this:
for each object:
    gather material indices
    ensure normals/edges
parallel for each object:
    calculate normal & texture coordinates
for each object:
    calculate index offsets
parallel for each object:
    produce .obj text
write resulting text buffers into the file
And now the export time goes 8.7s→5.8s:

…aaaand that’s what landed into Blender 3.2 alpha, after Howard Trickey graciously reviewed it all. Timings on the two test cases:
- Splash (2.5GB file, 24k objects): 48.9s→5.8s.
- Monkey (330MB file, 1 object): 6.3s→4.9s.
🎉
(Update) Multi-threading within large meshes
A couple days later I decided to also implement multi-threading within a mesh, for “large enough” meshes. Fairly simple: if a mesh has more than 32 thousand of something (vertices, normals, UVs, polygons), then chop that up into chunks 32k each, produce their .obj texts in parallel, join into final output buffer after that is done.
Without this, exporting just a single mesh was not going parallel much, e.g. here’s exporting the monkey (4.9s):
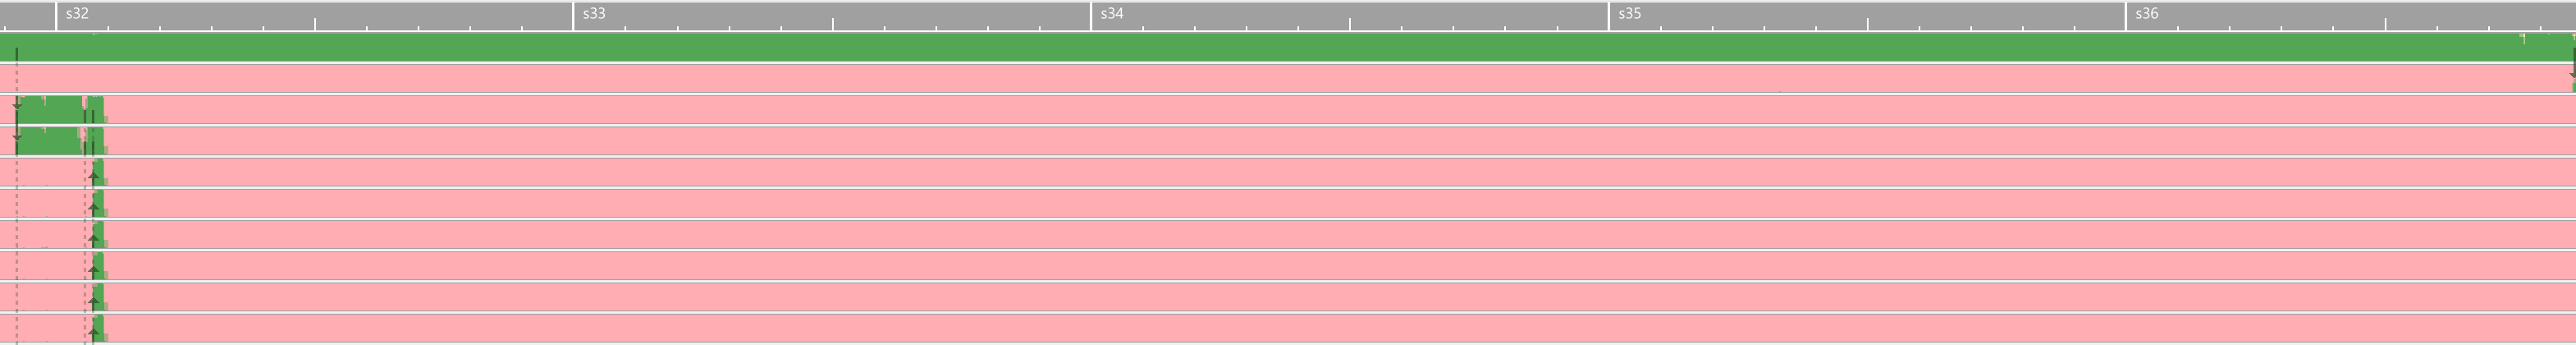
And here’s the same with doing parts of the export in parallel, within that one mesh (1.2s):

There’s still a part of the export that does not “go wide”; that one is doing some normal deduplication work that might be possible to parallelize, but is not “20 trivial lines of code”, so again, an exercise for the future generations.
…aaaand that’s what landed into Blender 3.2 alpha too. Timings on the two test cases, compared to Blender 3.1:
- Splash (2.5GB file, 24k objects): 48.9s→5.2s.
- Monkey (330MB file, 1 object): 6.3s→1.2s.
🎉🎉
What about faster float formatting?
Recall how everything here started because I wanted to look into the modern fast float formatting algorithms? We did not get to that part yet, eh?
Dragonbox (Jeon 2020) seems to be the fastest known algorithm
right now. Turns out, it has been integrated into “fmt” C++ library since
late 2020, and one of 3rd party libraries
that Blender already uses (OpenImageIO) already pulls fmt in…
Which makes it fairly easy to test it out. Hey look, another speedup! 5.8→4.9s on splash, 4.9s→3.5s on monkey:

So that’s nice. But pulling in fmt library in such a hacky way has some complications with the Blender build process, so that still needs to be figured out. Stay tuned, maybe this will land (or maybe not!).
Learnings
- Profile, profile, profile. Did I mention that Superluminal is excellent?
- Your compiler’s standard library float formatting may or might not be fast. There’s quite exciting recent research in this area!
- It’s hard to be I/O limited with modern SSDs, unless you’re literally doing zero additional processing.
- Even small overheads add up to quite a lot over many function calls.
- Getting a change into Blender was quite a bit easier than I expected. Yay! (or: “they really let anyone land code these days, eh”)
- Just because something was made 10x faster, does not mean it can’t be made another 10x faster :)
- “Common wisdom” may or might not be common, or wisdom.
- Sometimes it’s helpful to explore something for no other reason than simple curiosity.