Unroll a loop, make shader 10x faster
Loop unrolling is complexicated. Usual knowledge is that the compiler has way more knowledge than you might have about source code and the target machine, and so you should just write a loop, and let the compiler decide what to actually do with it. This is a good rule of thumb, most of the time.
The other day I made one GPU compute shader in Blender 10 times (ten times!) faster by unrolling a loop though. (ten times on one GPU… on another GPU it is two times faster, but still!)
Kuwahara image filter
Blender has a Kuwahara compositor node, that produces a “painterly” look from an input image. Sometimes it is used as a building block for more complex painterly effects.
Fun fact! Original Kuwahara algorithm was developed for biomedical image processing needs, to smooth out noise while preserving boundaries. Kuwahara, Hachimura, Eiho, Kinoshita “Processing of RI-Angiocardiographic Images”, 1976. Much later, Kyprianidis, Kang, Döllner “Image and Video Abstraction by Anisotropic Kuwahara Filtering” (2009) extended it to look better and the goal was non-photorealistic image & video processing.
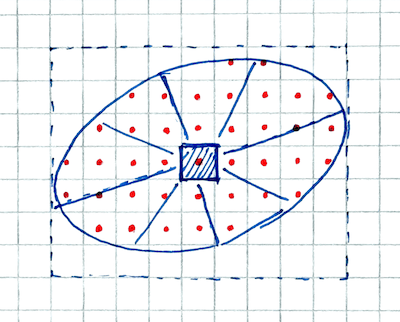
Anisotropic Kuwahara filter is quite expensive to calculate, and most of the cost comes from the fact that each and every output pixel must look at an oriented ellipse around itself (ellipse orientation & shape changes from pixel to pixel), sample input pixels inside of it, assign the inputs to eight sectors, calculate sector statistics, and then blend their average colors, preferring sectors with lower variance. The sectors are also actually overlapping with each other, ugh.
But, it produces quite nice “painterly” results, here’s a result that we can consider to be ground truth because the dog’s name is True:


The problem
Anyway, I was looking at it for some small optimizations. On my PC (Ryzen 5950X / RTX 3080Ti), doing Kuwahara with size 8 on a 2048x1536 input image took 408ms on the CPU, and 19ms on the GPU. So the GPU is about 20x faster at this, which sounds fine.
But then! On an Apple M4 Max device, the CPU took 385ms (faster than this Ryzen, eh), yet the GPU took a whopping 220ms. Like, what? One could go “well obviously this Apple GPU is slower than that nvidia GPU! And GPU path on the Apple device is still faster than CPU, so good” and move on. But the ratio felt way off; why the first machine would have 20x performance advantage by using GPU, whereas the second one would not even be twice as fast? And also, the M4 Max GPU might be slower than RTX 3080Ti, but it should not be ten times slower.
Let’s investigate a Metal shader
Apple Xcode can do a frame capture of an application that uses Metal graphics API, and then you can use it to do debugging, performance insights
and so on. I’m using Xcode 26.3 on macOS 15.7.3. Capture a frame with performance analysis enabled, and click Show Performance button:
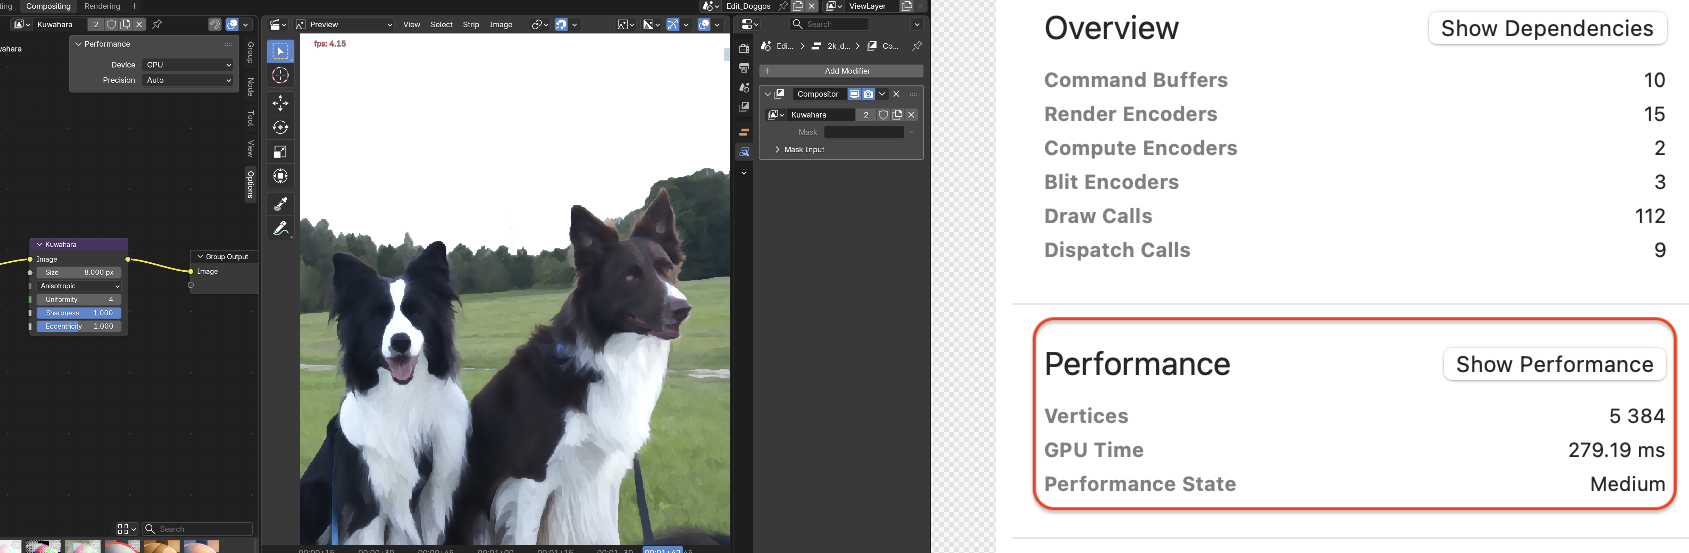
The Top Shaders view shows the most expensive shaders, where we find our main Kuwahara compute shader. It uses 192 registers (a lot!), and even
spills 64 bytes since it’s kinda out of registers (that is not great at all):

Clicking on Counters tab makes the whole computer almost unresponsive for several minutes, while Xcode is really busy doing something.
Then it shows that our compute shader only has 28% occupancy (not great), but more curiously, the instruction mix is like:
- ALU float instructions: 12% (huh? that low? source code was full of math!)
- ALU half instructions: 0% (yes, Blender today does not use FP16 math in shaders… perhaps it should, but that’s for another day)
- Conditional, Integer and Boolean instructions: 87%. What?!
With our compute shader still selected in Overview tab, right click on it and pick Reveal in Cost Graph, and it shows a flamegraph
of the shader code & function calls (pretty much everything in just main entry point), but more importantly, it shows the shader
source code with approximate per-line costs below. Scroll to the expensive part:
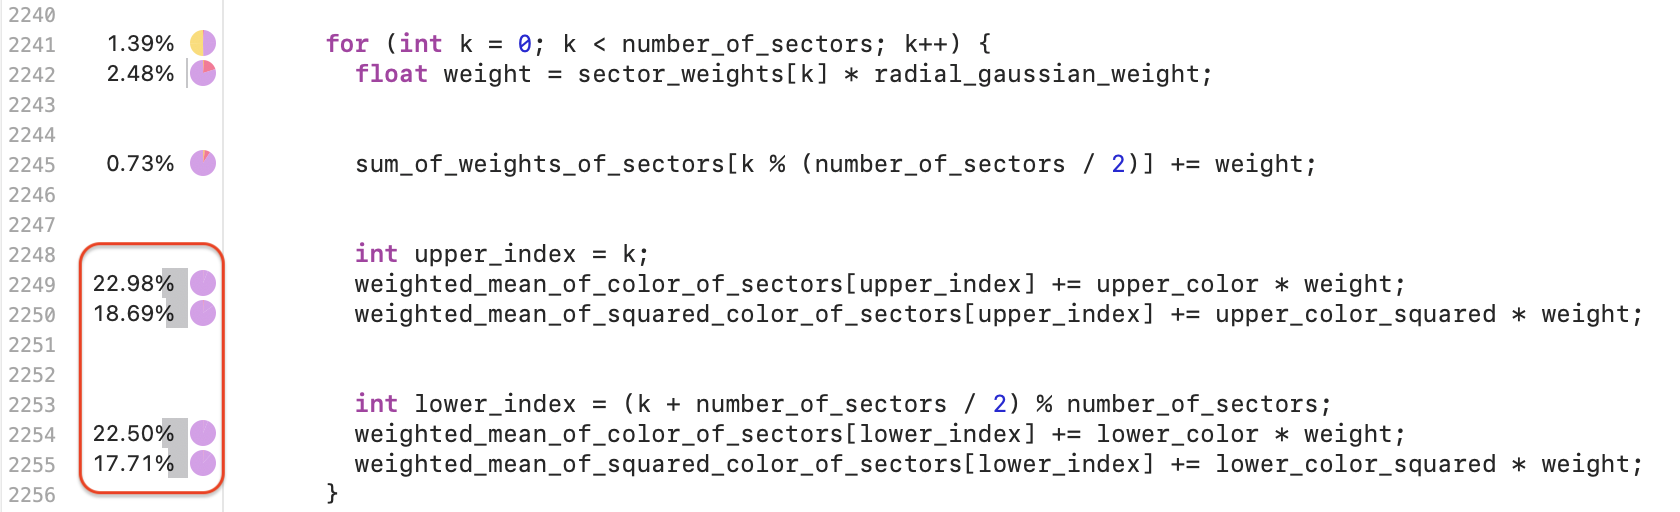
This is the inner shader loop, where for each image sample we check which sector(s) it is in, weigh them, calculate their statistics and so on.
It would make sense that this is the heaviest part of the shader, since it is the innermost loop after all. But hovering on
each of the line-attribution-bubbles shows something like this:
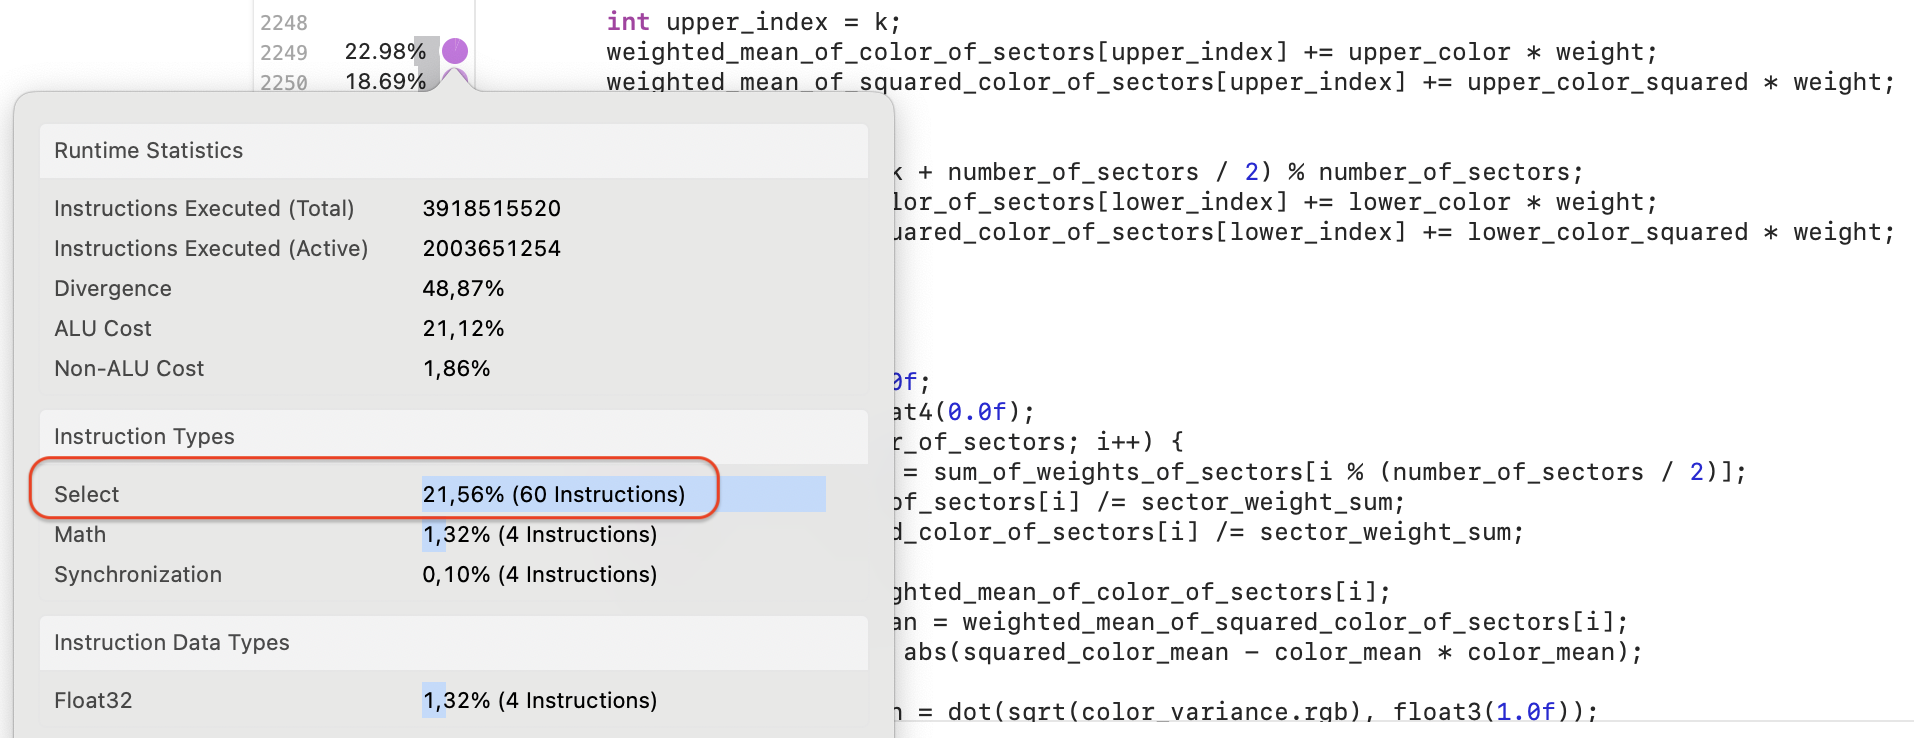
Wait what? Why would a line like weighted_mean_of_color_of_sectors[upper_index] += upper_color * weight be mostly “select” instructions,
and not just math?!
At least this version of Xcode just stops there. It says there are a ton of “select” instructions, but does not actually show them. What is going on there? Why? No idea, but it would be really nice if Apple had tools that could enable us to drill deeper. Since Xcode can not help us further, we’ll have to go heavy metal 🤘
Dougall Johnson has a project with Apple M1 (“G13”) GPU reverse engineered, with extensive documentation and disassembler and other tools at github.com/dougallj/applegpu. It is not exactly the same GPU that I am on (which is M4), but this will have to do.
After some goofing around, something like this seems to achieve a “GPU disassembly for M1 GPU” from my Metal source code:
- Compile Metal source code into a metal library:
xcrun -sdk macosx metal metal_source.metal -o test.metallib - Create a
test.mtlp-jsonfile (this describes the pipeline state) with contents like:
and then compile to M1 GPU ({"pipelines":{"compute_pipelines":[{ "compute_function":"_compositor_kuwahara_anisotropic_constant_size_comp", "threadgroup_size_is_multiple_of_thread_execution_width":true, "max_total_threads_per_threadgroup":1024}]}}applegpu_g13g) code withxcrun metal-tt -arch applegpu_g13g -o test_g13g.gpubin test.mtlp-json test.metallib - This produces a
.gpubinfile which is a Mach-O file, and we are interested in the__TEXT,__computesection. That section itself is another Mach-O file! And from that file, we need the__TEXT,__textsection. With that extracted into a separate file likeg13g.bin, we could finally disassemble it. - But the
disassemble.pytool stops on the firststopinstruction, which is placed in some sort of shader preamble. Disable this stopping to get full shader disassembled:cd applegpu python3 -c " import disassemble as d d.STOP_ON_STOP = False d.disassemble(open('../g13g.bin','rb').read())" > ../g13g.asm
And yes, majority of instructions in the shader disassembly are icmpsel. There’s also a bunch of stack_store and stack_load, which seem like
that’s the “spilled bytes” that Xcode was pointing out. Here’s a snippet of actual instruction sequence from the GPU shader disassembly:
mov              r9, r51.cache
icmpsel          seq, r51, r1l.cache, 2, r7.cache, r34.discard
icmpsel          seq, r18, r1l, 3, r7, r18
stack_store      i16, 1, 0, xy, 4, r18l_r18h, 88, 0
icmpsel          seq, r16, r1l, 4, r7, r44.discard
stack_store      i16, 1, 0, xy, 4, r16l_r16h, 84, 0
icmpsel          seq, r7.cache, r0h.cache, 1, r14.cache, r12.cache
icmpsel          seq, r14.cache, r0h.cache, 1, r39.discard, r6
icmpsel          seq, r7.cache, r0h.cache, 2, r51, r7.cache
icmpsel          seq, r14.cache, r0h.cache, 2, r24.discard, r14.cache
icmpsel          seq, r7.cache, r0h.cache, 3, r18, r7.cache
icmpsel          seq, r14.cache, r0h.cache, 3, r13, r14.cache
icmpsel          seq, r7.cache, r0h.cache, 4, r16, r7.cache
icmpsel          seq, r14.cache, r0h.cache, 4, r5, r14.cache
icmpsel          seq, r7.cache, r0h.cache, 5, r38, r7.cache
icmpsel          seq, r14.cache, r0h.cache, 5, r3.cache, r14.cache
icmpsel          seq, r7.cache, r0h.cache, 6, r20, r7.cache
icmpsel          seq, r14.cache, r0h.cache, 6, r11, r14.cache
icmpsel          seq, r7.cache, r0h.cache, 7, r19, r7.cache
icmpsel          seq, r14.cache, r0h.cache, 7, r8, r14.cache
fadd32           r7.cache, r7.cache, r31
fmadd32          r50, r32, r29, r14
Out of 22 instructions, only two do some sort of math! The rest are integer comparison-selects and some stack data movement.
What seems to be going on, is that the final GPU shader compiler did not unroll this loop (every loop iteration has the array index [i]
that is just a variable), and shader variables like float sector_weights[8],
float4 weighted_mean_of_color_of_sectors[8] and float4 weighted_mean_of_squared_color_of_sectors[8] become actual
arrays inside the GPU registers. At least this GPU cannot index registers!
So in order to do any array index the compiler emits a sequence like if i==0 use this, else if i==1 use that, else if i==2 use this, ....
All of that expands to about 200 integer select instructions per loop iteration.
Madness!
Let’s unroll the loop
Blender’s shaders are written in a curious shading language tentatively called “BSL” (see BCON26 talk about it,
“How Not to Build a Shading Language”). For explicit loop unrolling it has a C++-style attribute [[unroll]],
which literally copy-pastes the loop body before passing it to a platform compiler.
for (int k = 0; k < 8 /* number_of_sectors */; k++) [[unroll]] {
  float weight = sector_weights[k] * radial_gaussian_weight;
  sum_of_weights_of_sectors[k % (number_of_sectors / 2)] += weight;

  int upper_index = k;
  weighted_mean_of_color_of_sectors[upper_index] += upper_color * weight;
  weighted_mean_of_squared_color_of_sectors[upper_index] += upper_color_squared * weight;

  int lower_index = (k + number_of_sectors / 2) % number_of_sectors;
  weighted_mean_of_color_of_sectors[lower_index] += lower_color * weight;
  weighted_mean_of_squared_color_of_sectors[lower_index] += lower_color_squared * weight;
}
This makes the shader run 10 TIMES faster.
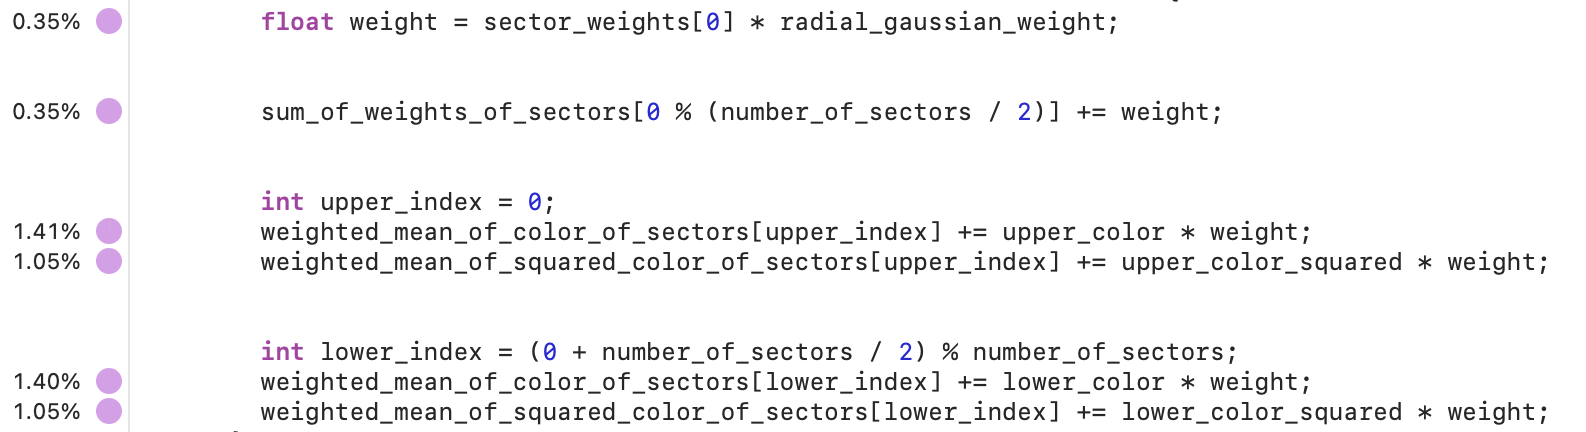
It was taking 220ms before, and now it runs in 20.4ms. The shader instruction mix went from (12% float math, 87% conditional and integer) to
(79% float math, 17% conditional and integer), which feels way more sensible. It still uses 192 registers and spills (64 bytes -> 48 bytes), but
that’s a topic for another day. And the (unrolled) inner loops are now all just math instructions:
Okay, but what about other GPUs?
Fair question! I only have two GPUs around here, the other one being RTX 3080Ti. Which, funnily enough, is another GPU where the GPU vendor does not easily allow you to see “what is the actual GPU assembly” bit :)
Nsight Graphics allows me to debug and profile graphics applications, but for example when using Vulkan, it can show me which of the SPIR-V assembly instructions were costly, but how they map into the underlying GPU instructions, is anyone’s guess.
In this particular case, speedrun of Kuwahara through Nsight (2026.3 version): Start Activity,
pick “GPU Trace Profiler” option, turn on “Real-Time Shader Profiler”, launch the application, do a capture. Find the expensive
compute shader dispatch in the timeline (it takes 17.8ms here):
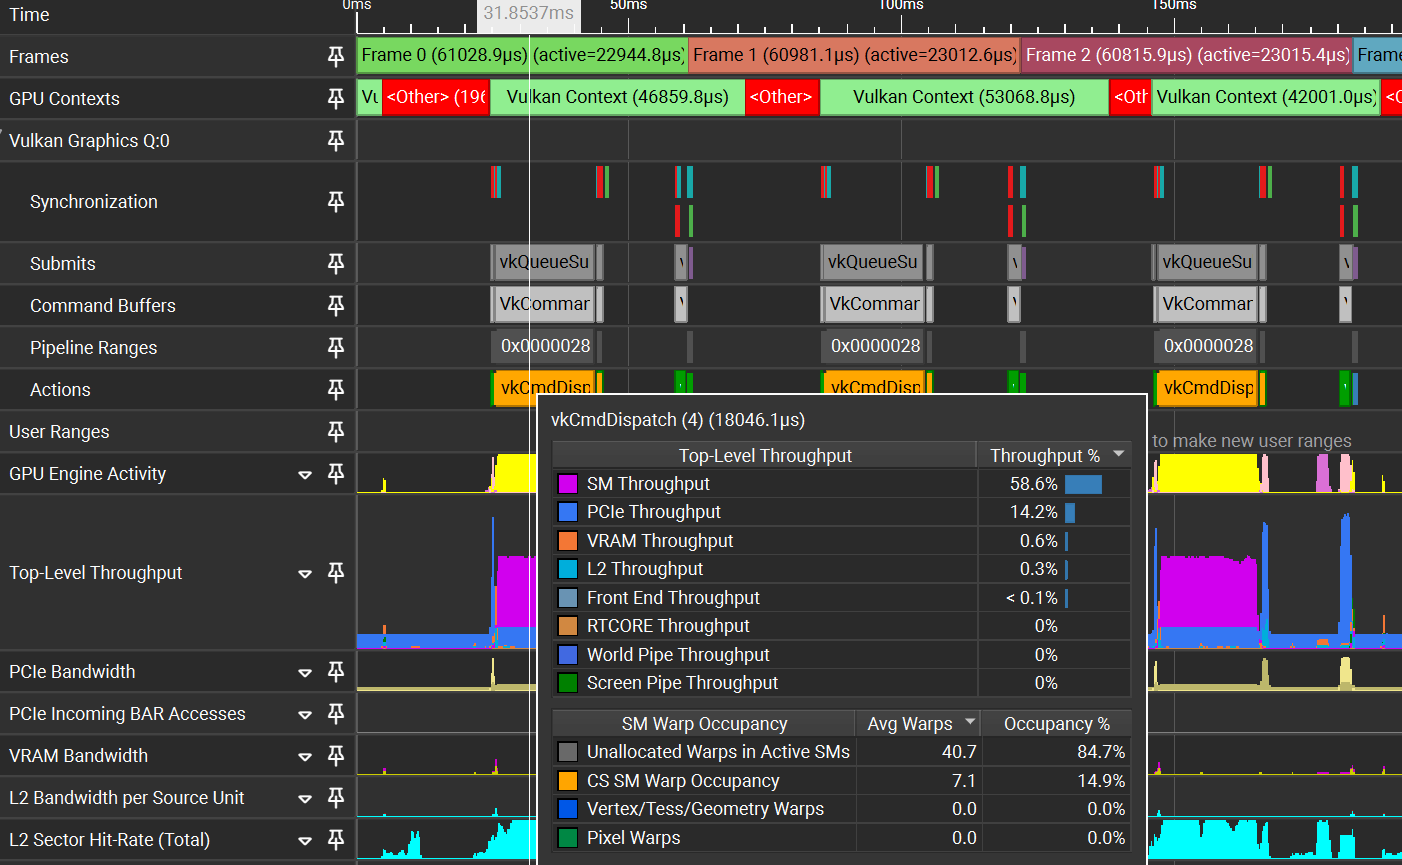
In lower right corner, under Shader Pipelines section, it displays some data about this compute pipeline:

It can run 8 warps, uses 204 registers (198 live registers), average warp latency is 134K, instruction mix: 44% FMA FP32, 36% data movement.
With unrolled loop, now our compute dispatch takes only 9.5ms:
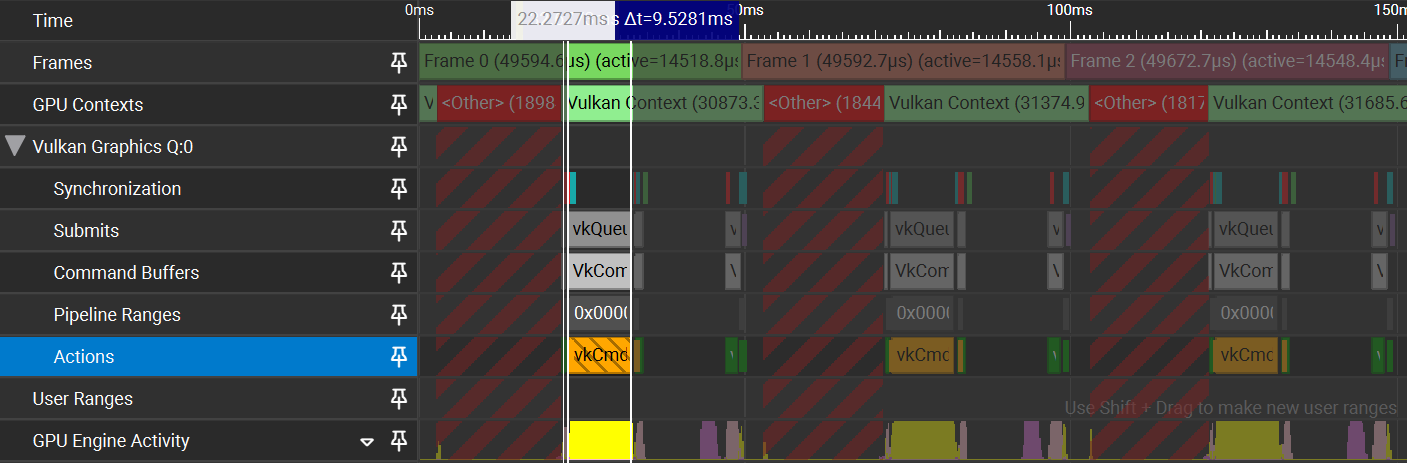
And it can run 16 warps, uses 113 registers (103 live registers), average warp latency is 45K, instruction mix: 60% FMA FP32, 13% data movement.
So yes even on RTX 3080Ti this particular shader gets twice as fast by just unrolling the inner loop. Half the registers results in twice the occupancy here, but TBH I did not dig much deeper into why exactly the register usage has decreased.
What’s the lesson?
Yes the loop unrolling should be left to the compiler… except when it should not :)
That by itself is not very useful, so perhaps a better lesson is - it helps to have at least a vague understanding of what sort of performance should be expected. This way you can go “wait a minute, this feels way too slow” and investigate. In this case, I wanted to fix seemingly very bad compute shader performance on an Apple GPU (and sped it up ten times), but a side effect was that on an NVIDIA GPU the shader also got twice as fast.
It helps if the performance analysis tools can point out some sort of data that makes you go “huh wait, this should not be here”, like in this case, majority of shader instructions being integer compare/selects. It would be even better if these tools could actually show more data; for Apple GPUs in Xcode frame capture and NVIDIA GPUs in Nsight, I’d like to see GPU assembly. One can dream!
And now I’ll go and ship these Kuwahara node performance improvements in Blender (PR 164617, just merged for upcoming Blender 5.3). There’s probably more work to do in that area, but that’s for later.