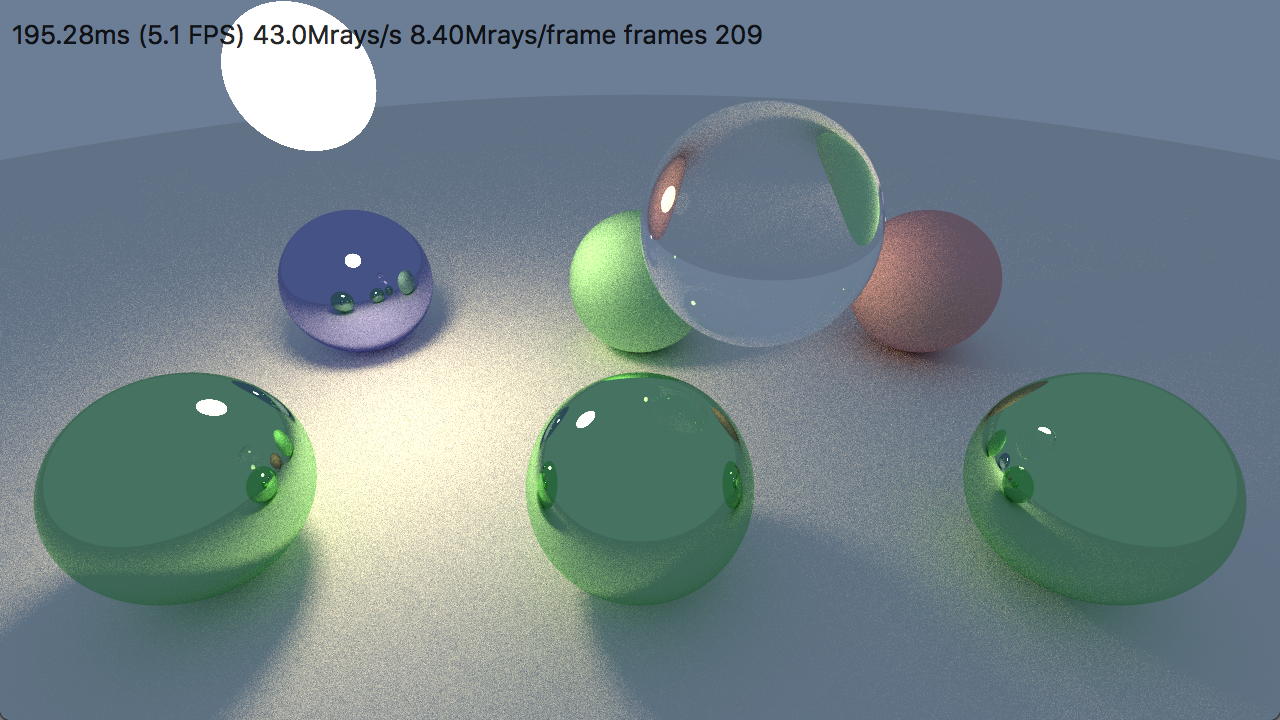
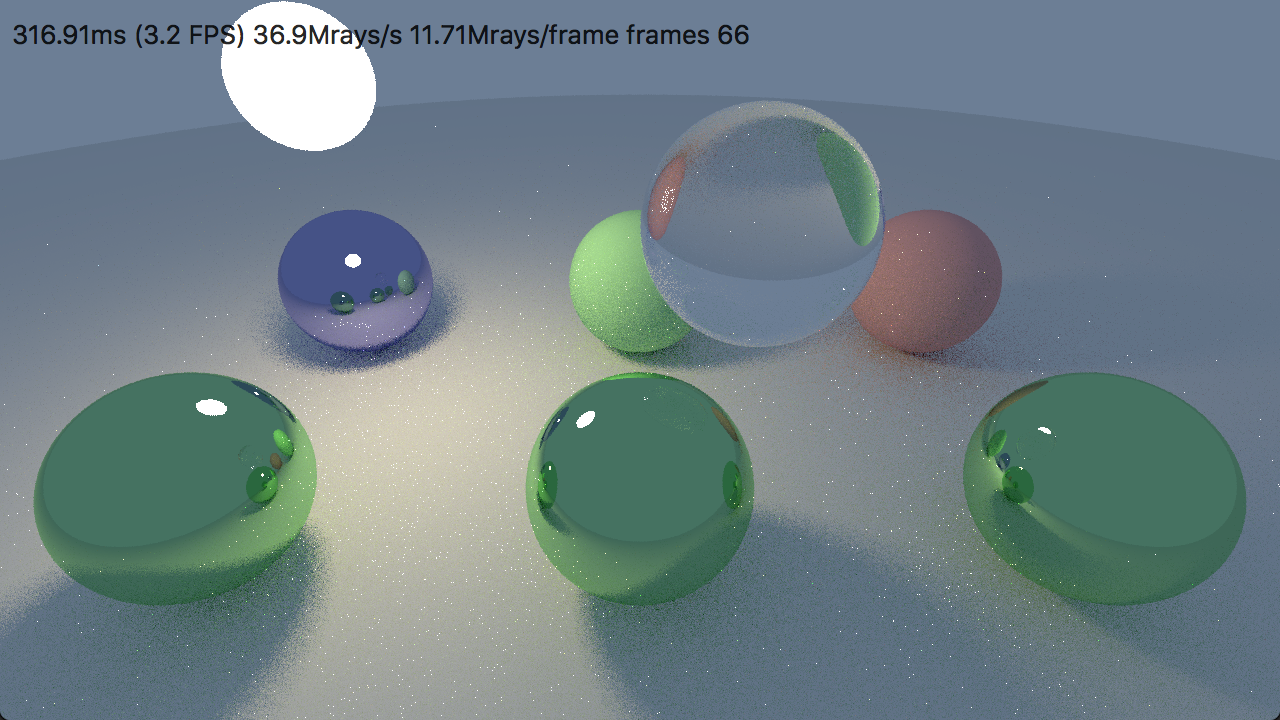
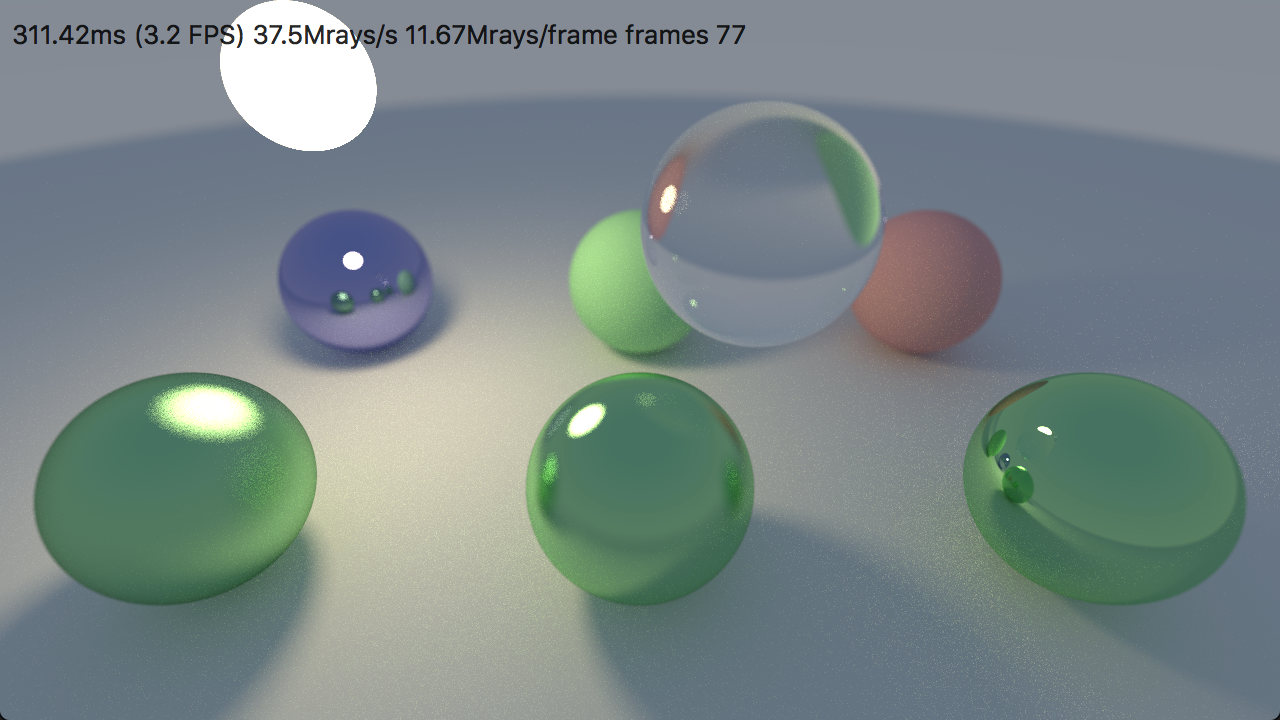
Daily Pathtracer Part 3: C# & Unity & Burst

Introduction and index of this series is here.

As promised in the last post, let’s port our path tracer to C#, both outside & inside of Unity. This will also contain a brief example of Unity 2018.1 “Job System”, as well as Burst compiler.

There will be nothing specific to path tracing in this post!

Basic C# port

Let’s do a standalone (outside of Unity) C# port first.

It’s 2018, so I’ll try to pick some “modern .NET” that would work on both Windows & Mac. I think that is called “.NET Core 2.0(seriously, .NET ecosystem is a bit confusing: .NET Framework, .NET Core, .NET Standard, Portable Class Libraries, Mono, Xamarin etc. – good luck figuring out what is what).

Since I have no idea how to do UI in C# that would work on both Windows & Mac, I’m just not going to do it at all :) The path tracer will be a command line app that renders a bunch of frames, and saves out the final image as a .TGA file (why TGA? because it’s super simple to write).

Everything from our C++ code pretty much ports over directly:

Basic maths plumbing: float3, randomness utils, Ray, Hit, Sphere, Camera.

All of these are struct, not class. Often I see students starting out with class, since that’s the only thing they are taught about in the university. In .NET, “reference types” (like class) means their instances are allocated on the heap, participate in garbage collection, and so on. Whereas “value types” (primitive types like int or float, as well as most struct types) are not allocated on the heap; they are passed “by value”. Read more in official Microsoft docs. Math-heavy code tends to create a lot of small types (like float3 in our case, which is used to represent points, vectors and colors), and if they were allocated on the heap that would be “generally a disaster” for performance.

The path tracing part itself is also a very much a direct port: Material struct, and functions HitWorld, Scatter, Trace, TraceRowJob.

For multi-threading I’m using Parallel.For loop from .NET 4.0 task parallel library. Here’s the code.

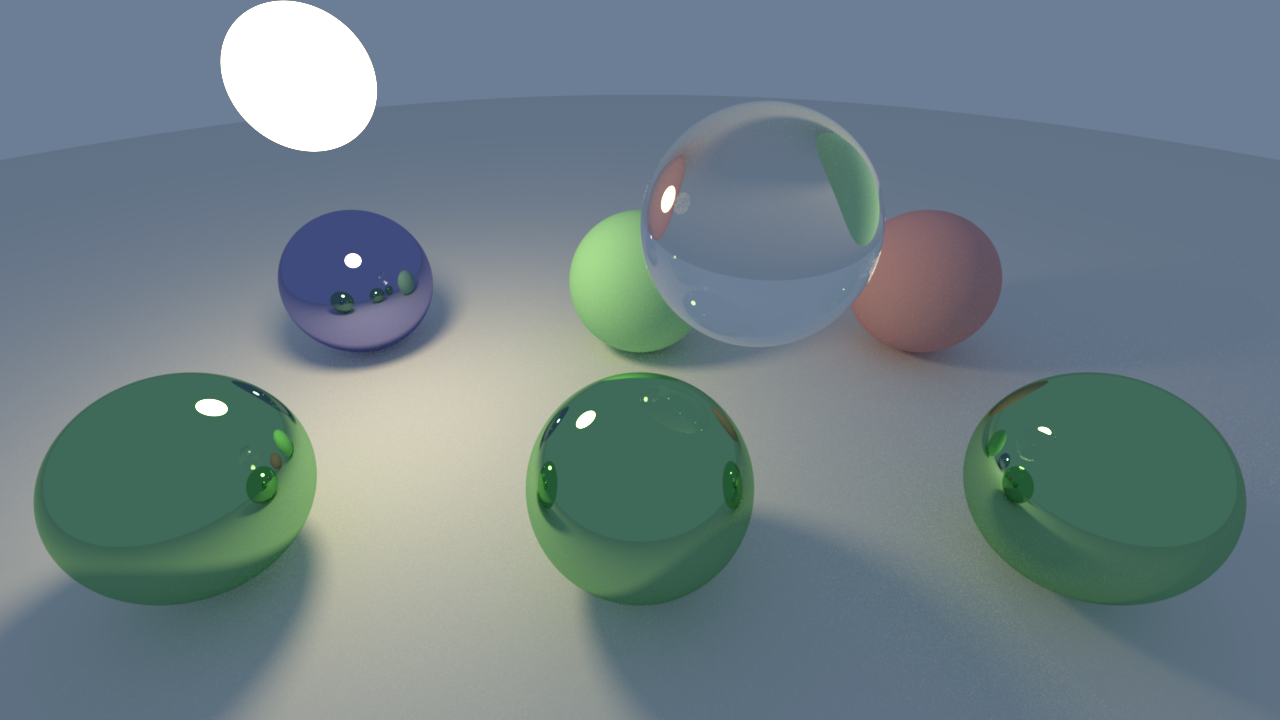
It runs, and produces image as expected, yay!

Ok enough of that, how fast does it run?

PC: 67.1 Mray/s, Mac: 17.5 Mray/s.

For reference, C++ version runs at 136 Mray/s on PC, and 37.8 Mray/s on Mac. The numbers are slightly higher than in last post, I made random seed use explicitly passed variable instead of thread local storage.

Note that this is running on “.NET Standard” implementation (JIT, runtime, class libraries). Let’s also try running on Xamarin/Mono on Mac. That gets 5.3 Mray/s, ouch :(

Recall that “use structs, not classes” advice? If I change all these simple types to use class, I get just 2.3 Mray/s on PC, and 5.8 Mray/s on Mac. I suspect the drop is much larger on PC due to more threads being ran at once, possibly creating some serial bottleneck in either allocation or GC.

So the summary of C# performance so far:

  • Basic .NET Core performance is roughly 2x slower than C++ performance, on both Windows & Mac.
  • For simple types like “vector” or “color”, you really want to use struct to avoid allocation & garbage collection overhead. Otherwise your code will run 30 (!) times slower on a 16-thread PC, and 3 times slower on a 8-thread Mac. I don’t know why such a performance discrepancy.
  • Mono .NET implementation is about 3x slower than .NET Core implementation, at least on Mac, which makes it ~6x slower than C++. I suspect the Mono JIT is much “weaker” than RyuJIT and does way less inlining etc.; you might want to “manually inline” your heavily used functions.

Notes on Mono: 1) currently it does not have .NET Core System.MathF class, so some of the things it has to do at double precision via System.Math. 2) Mono still defaults to using double precision math for everything; with -O=float32 option to get single precision since Mono 4.0; you might want to try that for FP32-heavy workloads. They are also planning to switch to actual FP32 for floats. 3) Mono also has an LLVM backend for the JIT, which might give better performance than the default one.

I have updated Mono performance numbers with various options in a later blog post too.

Let’s do Unity now

Basic port of C# code to Unity is trivial, and then I’m putting resulting data into a texture that I display over the whole screen (code).

One possible gotcha: turn off Editor Attaching in preferences, if you’re profiling heavy C# code in the editor. This option makes it possible to attach a C# debugger at any time, but it causes Mono JIT to insert a whole lot of “should I handle debugger right now?” checks in compiled code all over the place.

You’ll also want to set scripting runtime version to .NET 4.x instead of (currently still default) .NET 3.5, to make the Parallel.For call work.

Performance is comparable to “C# with Mono” option above:

  • Editor, “attaching” option off: PC 11.3, Mac 4.6 Mray/s.
    • With “attaching” option on: PC 5.3, Mac 1.6 Mray/s. So yeah that option does make “heavy” C# code run 2-3x slower in the editor, watch out!
  • Standalone non-development build: PC 13.3, Mac 5.2 Mray/s.
    • With IL2CPP instead of Mono: PC 28.1, Mac 17.1 Mray/s.

This is roughly what is expected: performance similar to Mono (which is behind .NET Core), editor has a bit of overhead, IL2CPP 2-3x faster than Mono, which brings it into the same ballpark as .NET Core. All that is quite a bit behind C++ :(

Let’s do some more fancy stuff in Unity!

We’ll want to use Burst compiler, but first we need to do some preparation steps.

Note: right Burst requires using a very specific build of Unity, which is 2018.1 beta 12, version ed1bf90b40e6 (download here). Also, Burst is beta, experimental, work in progress, may or might not work, today only works in editor, etc. etc. You’ve been warned!

We’ll use NativeArray for storing pixel data (commit), including a trick to use Texture2D.LoadRawTextureData with it (I’m adding more proper NativeArray support for texture pixel data as we speak…).

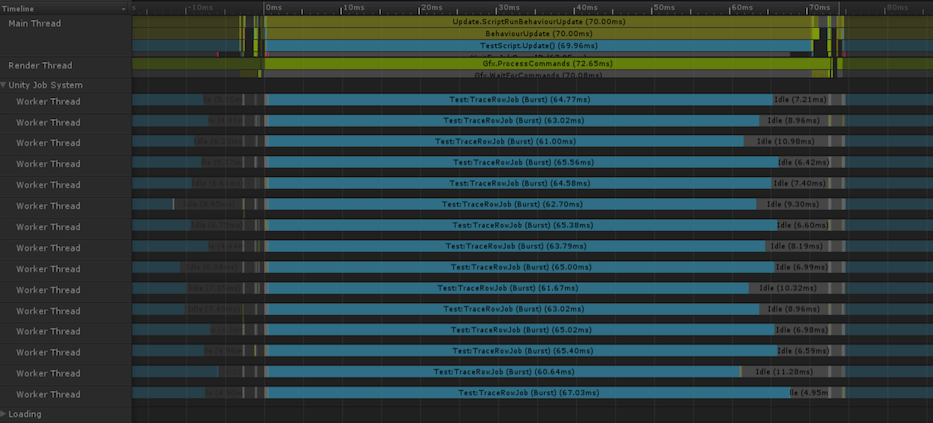
And let’s replace Parallel.For with Unity’s Job System (commit). This has the added benefit that our computation shows up in Unity’s timeline profiler. Look at these threads being all busy:

And now, let’s add Burst! Since Burst is beta right now, it does not show up in Package Manager UI yet. You have to manually edit Packages/manifest.json to contain this:

{
    "dependencies": {
    	"com.unity.burst": "0.2.3"
    },
    "registry": "https://staging-packages.unity.com"
}

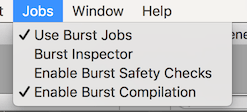
This should make “Jobs” menu appear. Now, we can add [ComputeJobOptimization] attribute to our struct TraceRowJob : IJobParallelFor, and iff the job C# code satisfies all restrictions imposed by Burst, it should get Magically Faster(tm). Burst restrictions today basically are:

  • No reference types, only primitive types and structs.
    • Note that NativeArray is a struct, so that one is ok.
    • C# “pointers” are ok too, I think (yes C# does have pointers!).
  • I think that’s about it, but do note that this makes a whole lot of “typical C#” be non-Burstable. You can’t have virtual methods, delegates, references, garbage collection, etc. etc.
  • Most accesses to static class fields are off-limits too; you should put that data into your Job struct instead.

Jobs -> Burst Inspector menu can be used to either see what errors prevented each job from Burst-ing, or inspect generated assembly for the Burst-ed ones.

In our pathtracer, making code Burst-able meant this (see commit):

  • Replace arrays with NativeArray. Part of that was done previously; I also put sphere & material data into NativeArrays.
  • No static data fields means that random number generator seed needs to be passed, instead of stored in a thread-local variable. We noticed that’s a generally good idea anyway earlier.

What performance do we have now, with Burst? PC: 11.3 -> 140 Mray/s (12x faster), Mac: 4.6 -> 42.6 Mray/s (9x faster).

This is pretty good, if you ask me. Recall that C++ implementation is 136 Mray/s on PC, and 37.8 Mray/s on Mac, so we’re actually faster than C++ already. Why and how? I suggest watching Andreas’ talk from GDC 2018.

But wait, we can do a bit more. We have a new (also experimental, WIP, etc) C# library called Unity.Mathematics, that is quite similar to HLSL types and functions. And Burst treats a whole lot of those as “intrinsics” that often map directly to some LLVM instruction. Let’s try that.

First off, add "com.unity.mathematics": "0.0.7" under dependencies in Packages/manifest.json. And then we can get rid of our own float3 struct and some helpers, and use very similar ones from Unity.Mathematics (commit). This gets us to 164 Mray/s on PC, and 48.1 Mray/s on Mac.

And these jobs take about 15x shorter than without Burst now:

Status, findings and what’s next

So we did not learn anything about path tracing this time, just spent some time in C# or Unity land. I hope that was useful for someone at least! The findings about C# are:

  • .NET Core is about 2x slower than vanilla C++.
  • Mono (with default settings) is about 3x slower than .NET Core.
  • IL2CPP is 2x-3x faster than Mono, which is roughly .NET Core performance level.
  • Unity’s Burst compiler can get our C# code faster than vanilla C++. Note that right now Burst is very early tech, I expect it will get even better performance later on.

And now, let’s get back to path tracing! Specifically, our rendering right now is wrong, due to the way I did the light sampling noise reduction optimization (thanks to a bunch of folks on twitter for pointing that out!). Turns out, with path tracing it’s often hard to know when something is “broken”, since many things look quite plausible! I’ll look at one of possible ways of how to approach that in the next post.


Daily Pathtracer Part 2: Fix Stupid

Introduction and index of this series is here.

At the end of the last post, I had the path tracer running at 28.4 million rays/second on a 4 year old Mac laptop, but only at 14.8 Mray/s on AMD ThreadRipper PC. Why? That’s what this post is about.

The problem? Random number generator

Turns out, the problem was in my little random number generator. A path tracer needs a lot of random numbers, and needs them fast. Built-in C rand() is fairly limited in many cases (e.g. on Windows MSVC implementation, only returns 15-bit values), and I’ve heard many years ago that Xorshift is supposedly quite good and super fast, so I did this:

static uint32_t s_RndState = 1;
static uint32_t XorShift32()
{
    uint32_t x = s_RndState;
    x ^= x << 13;
    x ^= x >> 17;
    x ^= x << 15;
    s_RndState = x;
    return x;
}

You all can probably already see the problem, and I should have known better too… here it is:

Actual problem: cache sharing

The function above is fine in a single-threaded environment. The problems start when multi-threading enters the picture. Yes it’s not “thread safe” too; there’s one “random state” variable that would get read & written by multiple threads without synchronization, this could lead to “incorrect randomness”, so to speak, but that’s a bit hard to notice.

The problem is that the same variable is read & written to by many threads very often. Like this:

  1. One CPU core writes into the variable,
  2. It has to tell all other cores “yo, you had this variable in your caches, I just modified it, please invalidate your cacheline for this, kthxbye”.
  3. Then the next CPU core is about to get a random number,
  4. Now it has to fetch the variable into the cache,
  5. And repeat from step 1.

All this cache invalidation and re-fetching the variable into caches again ends up being very expensive. And the more CPU cores you have, the more expensive it gets! That’s why my 16 thread PC was quite a bit slower than a 8-thread laptop.

In multi-threaded programming, there’s a sneakier phenomenon, called “False Sharing”. This is when several threads are modifying completely different variables – there’s no race conditions or anything. But, the variables happen to be really close to memory, on the same cacheline. The CPU cores still have to do all the cache invalidation dance above, since they can only read memory in cacheline-size chunks. Read more about it on wikipedia or in Sutter’s “Eliminate False Sharing”.

The fix and performance after it

Simplest fix: change uint32_t s_RndState to thread_local uint32_t s_RndState, to make the random state variable be unique for each thread.

  • Mac laptop: 28.1 -> 34.7 Mray/s (nice)
  • ThreadRipper PC: 14.1 -> 130 Mray/s (whoa, 9x faster!)

Lesson: cache sharing, or false cache sharing, can really bring your performance down. Watch out!

And yes, I know. I shouldn’t have had that as a global variable in the first place, mea culpa. Even with the fix, I should perhaps have made the “random state” be explicitly passed down into functions, instead of slapping an “eh, let’s put into thread local storage, will do the trick”. Don’t do this in production code :)

So, now we are at 130 Mray/s on Windows PC (AMD ThreadRipper 1950X 3.4GHz, 16 threads), and 34.7 Mray/s on Mac laptop (Core i7-4850HQ 2.3GHz, 8 threads). Is that good or bad? I still don’t know!

But, for next time let’s try doing the same path tracer in C#.


Daily Pathtracer Part 1: Initial C++

Introduction and index of this series is here.

Let’s make an initial implementation very similar to Ray Tracing in One Weekend (seriously, just buy that minibook).

Source code is here on github.

  • “Main” file is Test.cpp here. Pretty much everything outside that file is plumbing and not related to path tracing itself.
  • Visual Studio 2017 project files in Cpp/Windows/TestCpu.sln. Uses simple GDI to display the result.
  • Mac Xcode 9 project file in Cpp/Mac/Test.xcodeproj. Uses Metal :) to display the result; each frame uploading the texture data and displaying it on the screen.
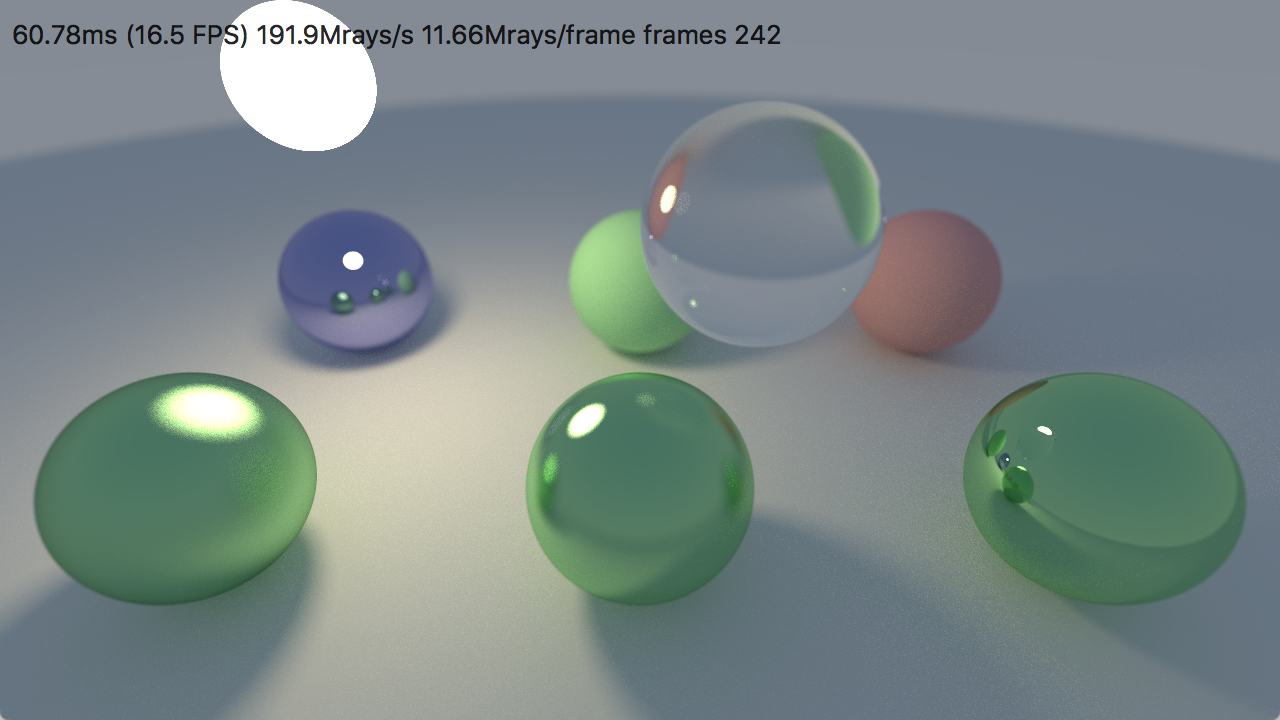
  • Looks like this:

What does it contain?

Very much like Ray Tracing in One Weekend, it can only do spheres, has no bounding volume hierarchy of any sort, and has lambert (diffuse), metallic and dielectric (glass) materials. I’ve also added explicit light sampling (“shadow rays”) similar to smallpt, to reduce the noise. Alternatively should perhaps have done importance sampling, like explained in Ray Tracing: The Rest of Your Life minibook.

Multi-threading is implemented by doing chunks of the whole image rows independently from others. I used enkiTS task scheduler by Doug Binks. That was the simplest thing I could think of that would work on both Windows & Mac. I could have used OpenMP or PPL on Windows and GCD on Mac. Or Intel’s TBB, or Some C++17 parallelism thingy, but frankly I find enkiTS simple to use and good enough :)

Code walk-through / explanation

Scene is hardcoded in s_Spheres and s_SphereMats arrays around here:

static Sphere s_Spheres[] = { ... };
static Material s_SphereMats[kSphereCount] = { ... };

Main ray intersection function is HitWorld here. Just loops over all spheres and finds closest intersection, if any:

HitWorld(...)
{
	for (all spheres)
	{
		if (ray hits sphere closer)
		{
			remember it;
		}
	}
	return closest;
}

“Main work” of path tracer itself is Trace function here, which does a:

color Trace(ray)
{
	if (ray hits world)
    {
    	// scatter & attenuate it from the surface
    	if (Scatter(ray, ...))
    	{
    		// keep on tracing the scattered ray recursively
    		return material.emissive + attenuation * Trace(scattered ray);
    	}
    	else
    	{
    		// ray would be absorbed; just return material emission if any
    		return mat.emissive;
    	}
    }
    else
    {
        // ray hits sky
        return sky color in ray direction;
    }
}

The Trace function does not care where the rays come from. Initially they would be coming from the camera, but then they just keep recursively bouncing off surfaces, changing direction and attenuating with each bounce.

The Scatter function is where material “response” to a ray hitting it is evaluated. It is essentially this:

bool Scatter(...)
{
  	attenuation = material.albedo // "color" of material
	if (material is Lambert)
    {    	
    	scatteredRay = bounce ray off surface in a random direction
    	// (actually pick a random point inside unit sphere that sits right
    	// atop the surface, and point a ray there)

        return true;
    }

    if (material is Metal)
    {
    	reflected = reflect ray along surface normal

    	// (random point inside sphere, with radius based on material roughness)
    	scatteredRay = offset reflected direction by a random point

    	// ray might get scattered "into" the surface, absorb it then
    	return (scatteredRay above surface);
    }

    if (material is Dielectric)
    {
    	// Here we compute reflection and refraction
    	// (based on materials' index of refraction)
    	// directions, and pick "scattered ray"
    	// randomly between each, with probability proportional
    	// to Fresnel effect.
    	//
    	// It looks scary in math/code, but that's
    	// essentially what it does.
    	return true;
    }
}

The multi-threading “job” function that is executed by enkiTS scheduler is TraceRowJob here. The task scheduler is invoked with “yo, for all rows on screen, divide that up into chunks and call TraceRowJob on each chunk”.

void TraceRowJob(startRow, endRow)
{
	for (y = startRow to endRow)
    {
        for (x = 0 to screen width)
        {
        	color = black;
        	for (sample = 0 to SamplesPerPixel)
            {
            	ray = camera.GetRay(x, y, with random offset)
            	color += Trace(ray);
            }
            color /= SamplesPerPixel;
            color = gamma correct;

            write color into x,y image location;
        }
    }
}

So everything is conceptually fairly simple. The beauty of a path tracer is that something very simple like this can still produce images with a lot of fancy phenomena:

Fancy effects, yay! All these are very hard in a regular rasterizer. Also… noise. And this one is after a lot of frames blended one over another; just one frame with one ray per pixel actually looks like this:

Reflections are cool, but that “lighting” part… ugh!

This amount of noise makes sense though. Recall that upon hitting a diffuse surface, we bounce only one ray, in a random direction. Some of these do end up hitting that emissive sphere, but a whole lot do not!

We could do more rays per pixel, or upon hitting a surface bounce more rays off it, or explicitly trace rays towards “light sources” (aka “explicit light sampling” or “shadow rays”), or try to not bounce the ray randomly, but make it more likely bounce off in directions we might be “interested” in (e.g. towards light sources) – that is called “importance sampling”. Or alternatively, try to use some of the de-noising techniques, which are pretty good these days.

The “most proper” approach right now would be to do importance sampling, I think, since that would still allow all the phenomena like caustic refractions etc. But that was too much math-y for me that day, and smallpt had explicit light sampling in there already, so I did that instead.

Scatter function, in addition to all the usual work for diffuse materials, also sends a ray towards emissive objects, and adds light contribution from those if they are visible (code here).

Just light sampling alone would contribute this to the image:

The illumination is smooth; the only noisy part is shadow penumbrae – that’s because we still only cast one ray towards the whole area of the light. So in penumbra region some pixels will see the light, and some won’t.

Combined with regular path tracing part, this “one ray per pixel” image would look like this:

That’s still a lot of noise of course! If we’d increase rays per pixel to something like 64, it starts to look better:

The overall level of illumination seemingly increases, and I think that’s because in the very noisy image, each bright pixel is actually way brighter than the low-dynamic-range “white”. If the rendering had bloom effect on it, these pixels would bloom.

What do we have now, and what’s next?

I’m testing this on two machines:

  • Windows PC is AMD ThreadRipper 1950X (3.4GHz, 16 cores / 16 threads). I have it in SMT-disabled config, since for some reason with SMT it’s generally a tiny bit slower (I suspect something is mis-configured in my motherboard/RAM setup, but I’m too lame/lazy to figure that out).
  • Mac is late-2013 MacBookPro (Core i7-4850HQ 2.3GHz, 4 cores / 8 threads).

The current code, at 1280x720 resolution, 4 rays per pixel, runs at 28.4 Mray/s on my Mac. Is that good or bad? I don’t know! However, it only runs on 14.8 Mray/s on the Windows PC (?!). Why? That’s the topic of the next blog post, turns out I have quite a performance embarrassment in the code :)


Daily Pathtracer Part 0: Intro

As mentioned before, I realized I’ve never done a path tracer. Given that I suggest everyone else who asks “how should I graphics” start with one, this sounded wrong. So I started making a super-simple one. When I say super simple, I mean it! It’s not useful for anything, think of it as [smallpt] with more lines of code :)

However I do want to make one in C++, in C#, in something else perhaps, and also run into various LOLs along the way. All code is at github.com/aras-p/ToyPathTracer.

Now, all that said. Sometimes it can be useful (or at least fun) to see someone who’s clueless in the area going through parts of it, bumping into things, and going into dead ends or wrong approaches. This is what I shall do in this blog series! Let’s see where this path will lead us.

Actually useful resources

If you want to actually learn someting about path tracing or raytracing, I’d suggest these:


Random Thoughts on Raytracing

Big graphics news at this GDC seem to be DirectX Raytracing. Here’s some incoherent (ha!) thoughts about it.

Raytracing: Yay

“Traditional” rasterized graphics is hard. When entire books are written on how to deal with shadows, and some of the aliasing/efficiency problems are still unsolved, it would be nice to throw something as elegant as a raytracer at it. Or screen-space reflections, another “kinda works, but zomg piles upon piles of special cases, tweaks and fallbacks” area.

There’s a reason why movie industry over the last 10 years has almost exclusively moved into path tracing renderers. Even at Pixar’s Renderman – where their Reyes was in fact an acronym for “Renders Everything You Ever Saw” – they switched to full path tracing in 2013 (for Monsters University), and completely removed Reyes from Renderman in 2016.

DirectX Raytracing

Mixed thoughts about having raytracing in DirectX as it is now.

A quick glance at the API overall seems to make sense. You get different sorts of ray shaders, acceleration structures, tables to index resources, zero-cost interop with “the rest” of graphics or compute, etc etc.

Conceptually it’s not that much different from what Imagination Tech has been trying to do for many years with OpenRL & Wizard chips. Poor Imgtec, either inventing so much or being so ahead of it’s time, and failing to capitalize on that in a fair way. Capitalism is hard, yo :| Fun fact: Wizard GPU pages are under “Legacy GPU Cores” section of their website now…

On the other hand, as Intern Department quipped, DirectX has a long history of “revolutionary” features that turned out to be duds too. DX7 retained mode, DX8 Matrox tessellation, DX9 ATI tessellation, DX10 geometry shaders & removal of FP16, DX11 shader interfaces, deferred contexts etc.

Yes, predicting the future is hard, and once in a while you do a bet on something that turns out to be not that good, or not that needed, or something entirely else happens that forces everyone else to go in another direction. So that’s fair enough, in best case the raytracing abstraction & APIs become an ubiquitous & loved thing, in worst case no one will use it.

I’m not concerned about “ohh vendor lock-in” aspect of DXR; Khronos is apparently working on something there too. So that will cover your “other platforms” part, but whether that will be a conceptually similar API or not remains to be seen.

What I am slightly uneasy about, however, is…

Black Box Raytracing

The API, as it is now, is a bit of a “black box” one.

  • What acceleration structure is used, what are the pros/cons of it, the costs to update it, memory consumption etc.? Who knows!
  • How is scheduling of work done; what is the balance between lane utilization vs latency vs register pressure vs memory accesses vs (tons of other things)? Who knows!
  • What sort of “patterns” the underlying implementation (GPU + driver + DXR runtime) is good or bad at? Raytracing, or path tracing, can get super bad for performance at divergent rays (while staying conceptually elegant); what and how is that mitigated by any sort of ray reordering, bundling, coalescing (insert N other buzzwords here)? Is that done on some parts of the hardware, or some parts of the driver, or DXR runtime? Who knows!
  • The “oh we have BVHs of triangles that we can traverse efficiently” part might not be enough. How do you do LOD? As Sebastien and Brian point out, there’s quite some open questions in that area.

There’s been a massive work with modern graphics APIs like Vulkan, D3D12 and partially Metal to move away from black boxes in graphics. DXR seems to be a step against that, with a bunch of “ohh, you never know! might be your GPU, might be your driver, might be your executable name lacking a quake3.exe” in it.

It probably would be better to expose/build whatever “magics” the upcoming GPUs might have to allow people to build efficient tracers themselves. Ability to spawn GPU work from other GPU work; whatever instructions/intrinsics GPUs might have for efficient tracing/traversal/intersection math; whatever fixed function hardware might exist for scheduling, re-scheduling and reordering of work packets for improved coherency & memory accesses, etc. etc.

I have a suspicion that the above is probably not done “because patents”. Maybe Imagination has an imperial ton of patents in the area of ray reordering, and Nvidia has a metric ton of patents in all the raytracing research they’ve been doing for decades by now, and so on. And if that’s true, then indeed “just expose these bits to everyone” is next to impossible, and DXR type approach is “best we can do given the situation”… Sad!

I’ll get back to my own devices :)

So, yeah. Will be interesting to see where this all goes. It’s exciting, but also a bit worrying, and a whole bunch of open questions. Here’s to having it all unfold in a good way, good luck everyone!

And I just realized I’ve never written even a toy path tracer myself; and the only raytracer I’ve done was for an OCaml course in the university, some 17 years ago. So I got myself Peter Shirley’s Ray Tracing in One Weekend and two other minibooks, and will play around with it. Maybe as a test case for Unity’s new Job System, ECS & Burst compiler, or as an excuse to learn Rust, or whatever.