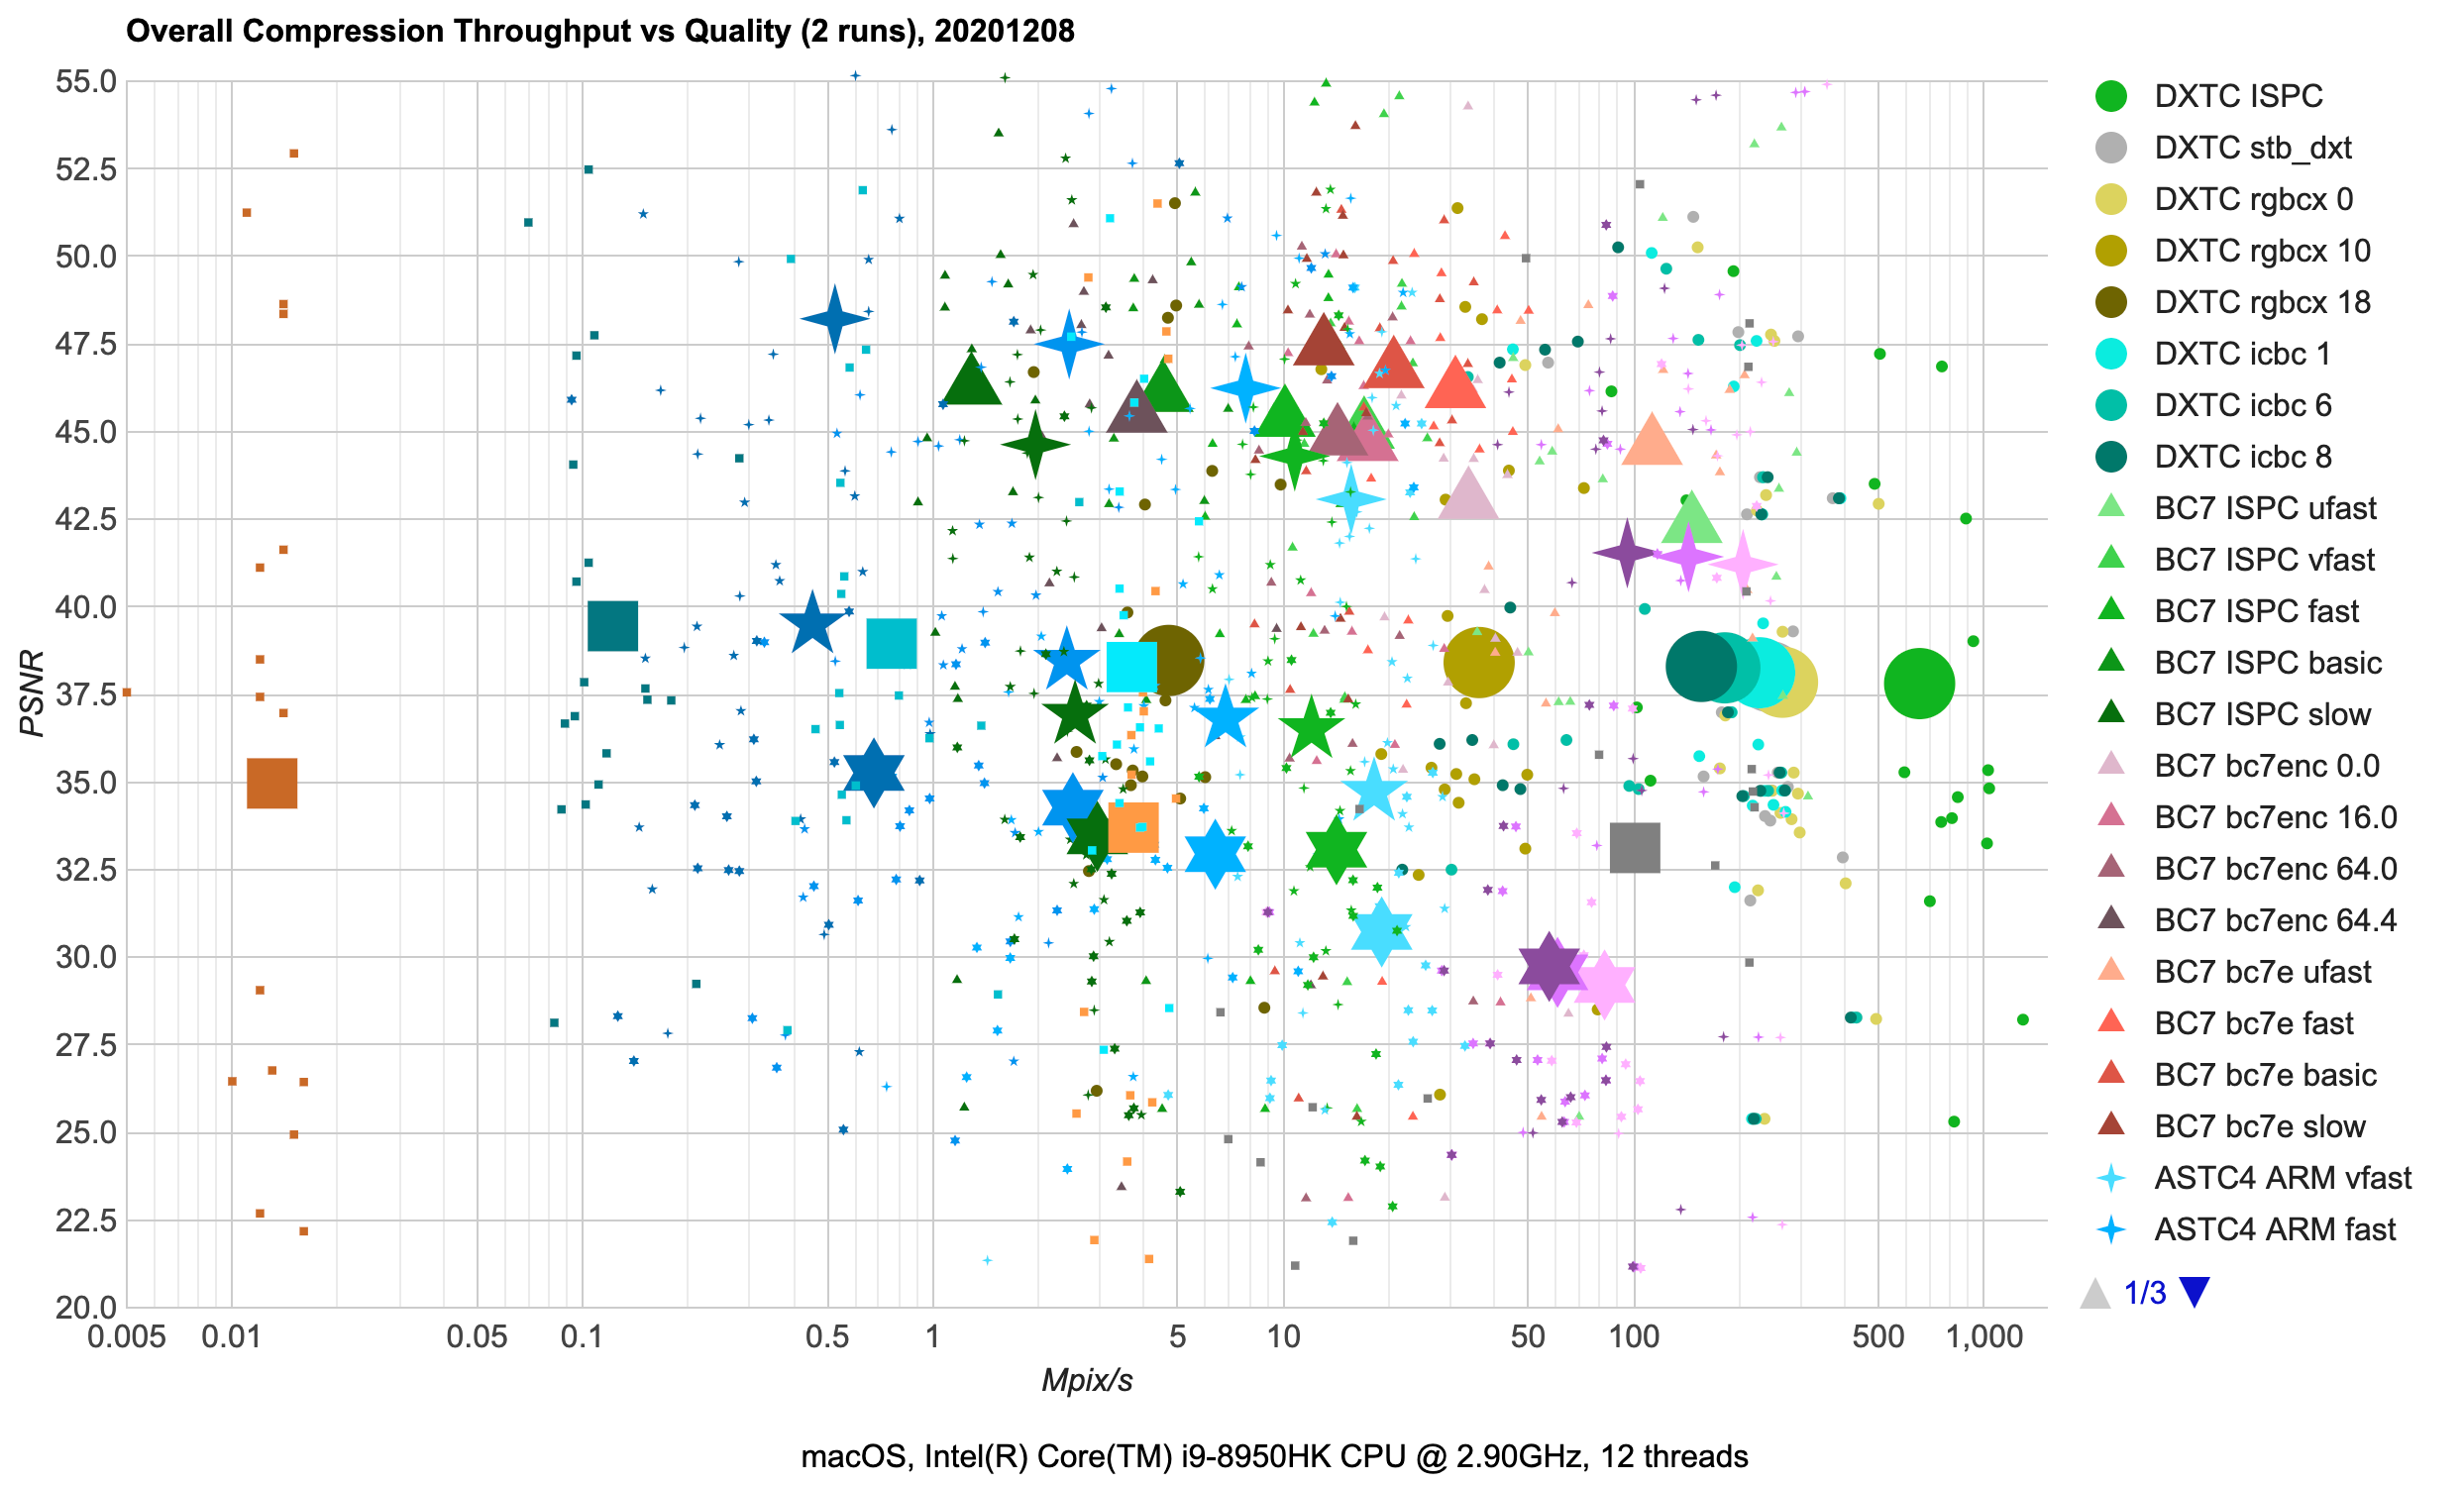
I’ve spent some time looking at various texture compression formats and libraries (the ones meant for GPUs, i.e. “ASTC, BC7” kind, not the “PNG, JPG” kind). Here’s a fully incomprehensible chart to set the stage (click for a semi-interactive page):
If your reaction is “whoa what is this mess?!”, that’s good. It is a mess! But we’ll get through that :)
Backstory on GPU compression formats
Majority of textures on the GPU end up using “block compression” formats, to save sampling bandwidth, memory
usage and for faster texture loads. A common theme between them is that all of them are lossy,
have fixed compression ratio (e.g. 4:1 compared to uncompressed), and are based around idea of encoding
some small pixel block (e.g. 4x4 pixels) using fewer bits than what would be normally needed.
This is very different from image storage compression formats like PNG (lossless) or JPG (lossy) that are based
on somehow transforming an image, (in JPG case) throwing away some detail, and compressing the data using traditional
compression algorithms.
Why the GPUs don’t do “usual” compression like PNG or JPG? Because a texture needs random access; if some thing
rendered on screen needs to sample a texture pixel at coordinate (x=17,y=287), it would be very inconvenient if in order
to get that pixel color the GPU would have to decompress all the previous pixels too. With block-based compression
formats, the GPU only needs to read the small, fixed size chunk of bytes of the compressed block that the pixel belongs
to, and decompress that. Since blocks are always the same size in pixels (e.g. 4x4), and always the same size in bits
(e.g. 128 bits), that works out nicely.
I’m leaving out lossless texture or framebuffer compression that some GPUs do.
As far as I know, these are also somewhat block-based, but exact details are extremely GPU specific
and mostly not public information. It’s also not something you control; the lossless compression
in various parts of GPU pipeline is largely applied without you doing anything.
Different block-based GPU compression schemes have been developed over the years. Hans-Kristian Arntzen has a nice
overview in the “Compressed GPU texture formats – a review and compute shader decoders – part 1”
blog post. Wikipedia has some detail too (S3TC,
ETC,
ASTC), but these pages read more like
spec-sheet bullet point lists.
A simplified (and only slightly incorrect) summary of texture compression format situation could be:
- On PC, you’d use BC7 (modern) or DXTC (old) formats.
- On mobile, you’d use ASTC (modern) or ETC (old) formats.
Backstory on compression libraries
How do you produce this “block-compressed” image? You use some piece of code that knows how to turn raw uncompressed
pixel data into compressed bits in one of the block-compressed formats. There are multiple of these libraries
available out there, and in the complexicated-looking chart above I’ve looked at some of them, for some of the
compressed formats.
Some formats are better than others.
Some libraries are better than others.
And that was my evaluation :) Read on for details!
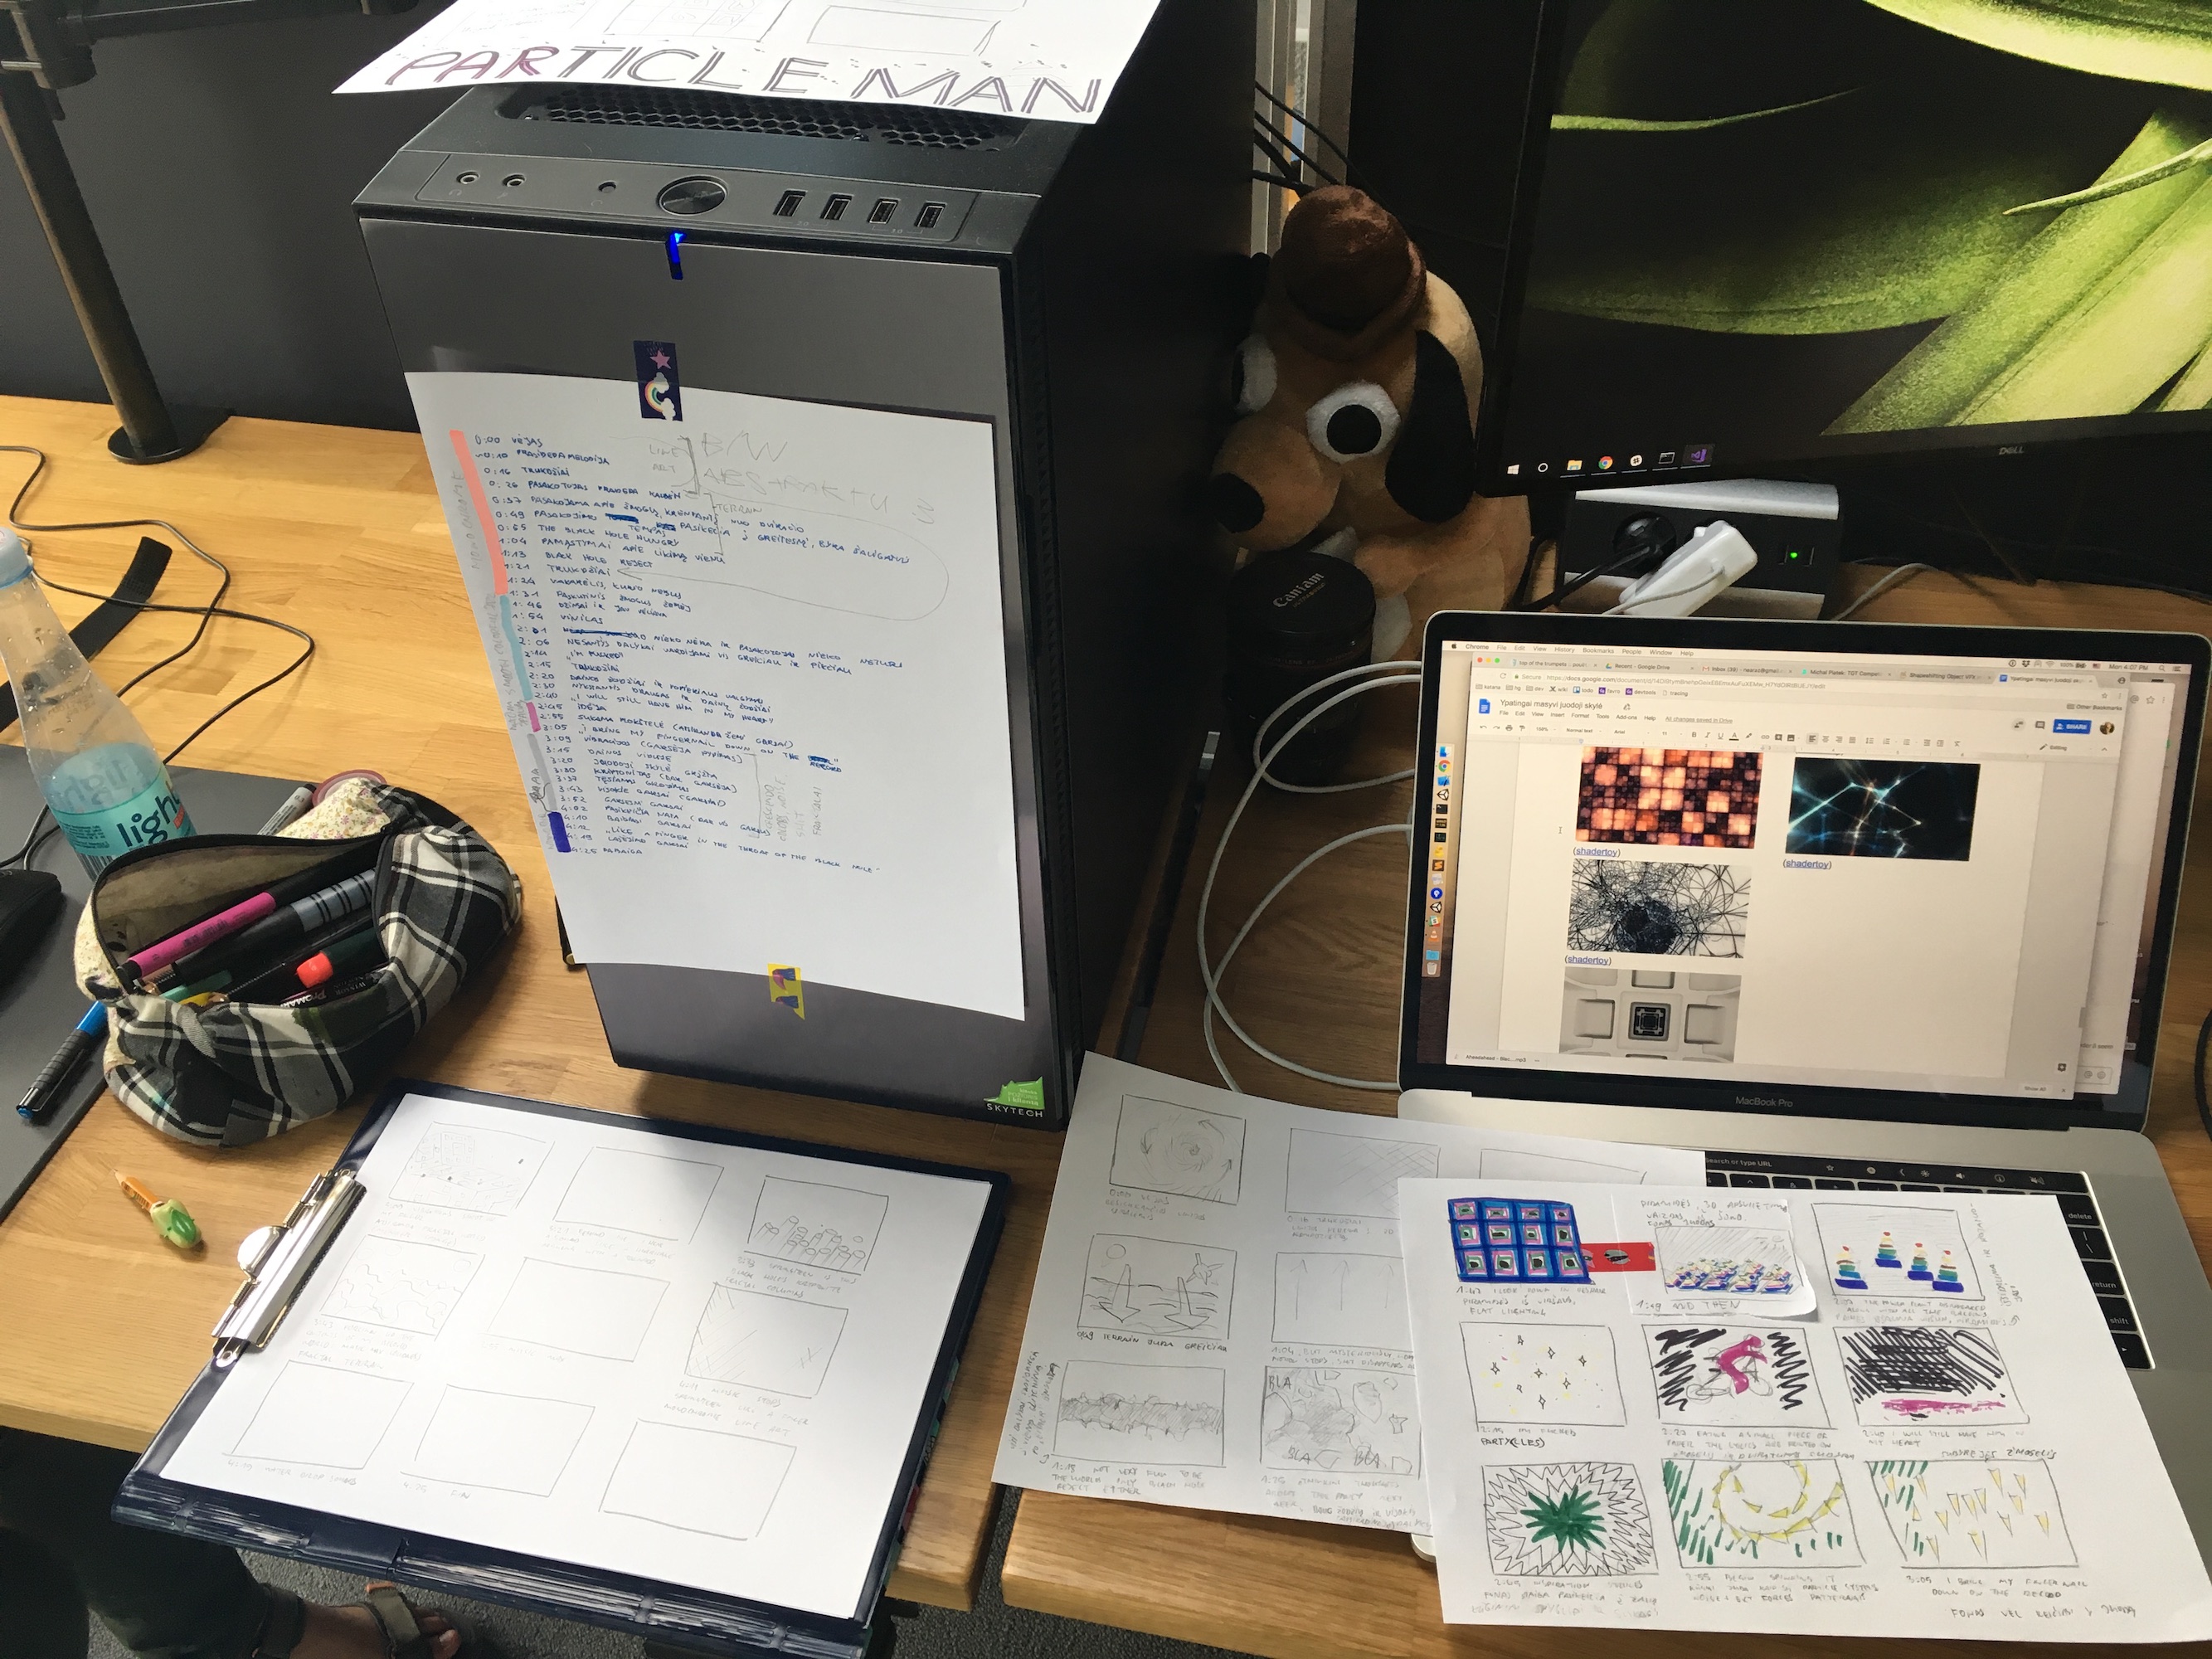
Testbed setup
I made a small application that contains multiple texture compressors (all used in “library” form instead of standalone
compressor executables, to only measure compression performance that would not include file I/O), and gathered
a bunch of textures from various Unity projects (a mix of everything: albedo maps, normal maps, sprites,
UI textures, skyboxes, VFX textures, roughness maps, ambient occlusion maps, lightmaps etc.).
The application loads uncompressed image, compresses it into different formats using different compression
libraries and their settings, and evaluates both performance (in terms of Mpix/s) and quality (in terms of Luma-PSNR).
Now, “how to evaluate quality” is a very wide and complicated topic (PSNR, SSIM, Luma-PSNR, other approaches, etc.).
Just this automated “compute one number” is often not enough to capture some of typical block compression
artifacts, but for simplicity sake I’ve settled on Luma-PSNR here. For the compressors, I’ve asked them to do
“perceptual” error metric mode, when that is available.
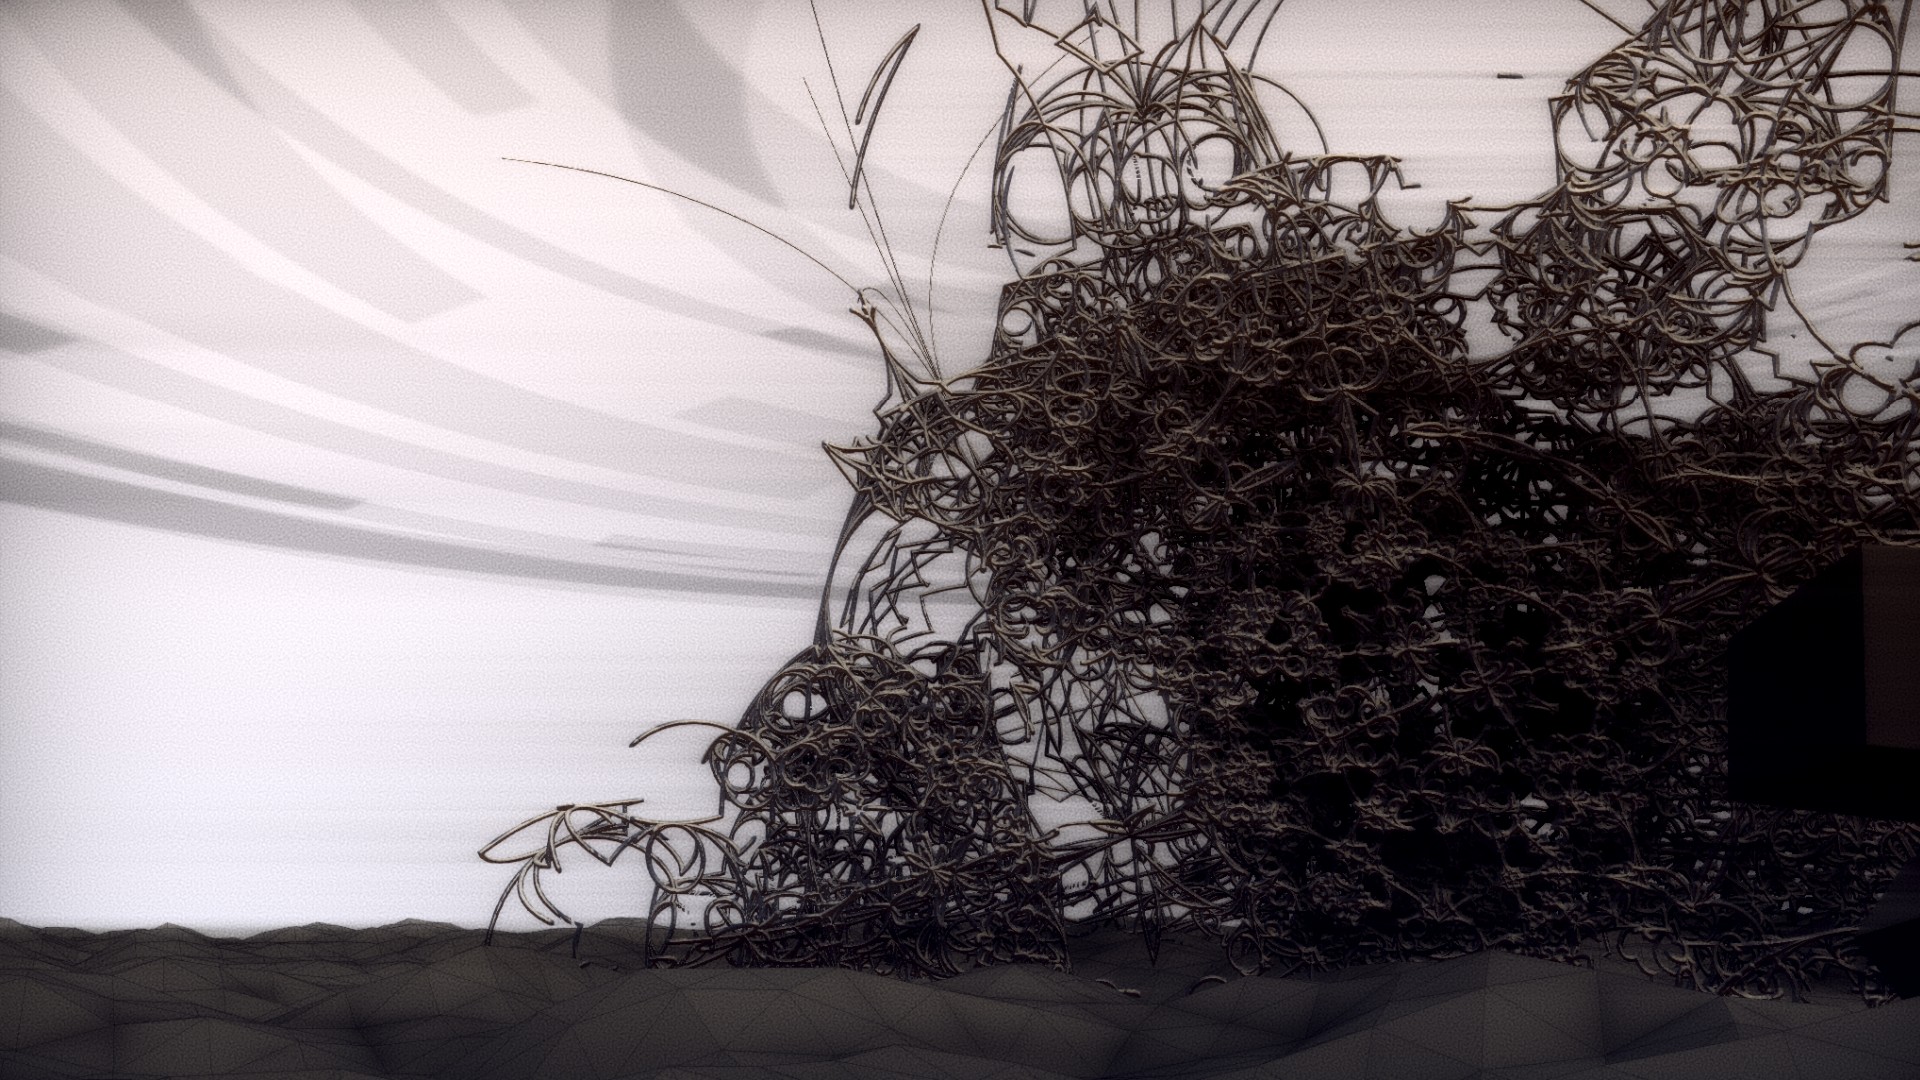
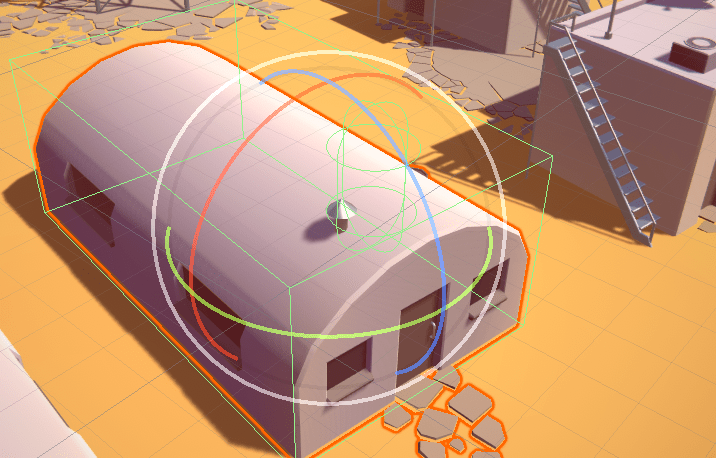
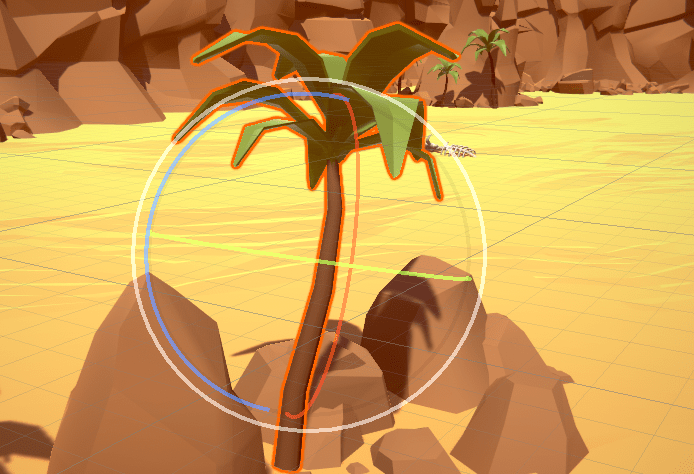
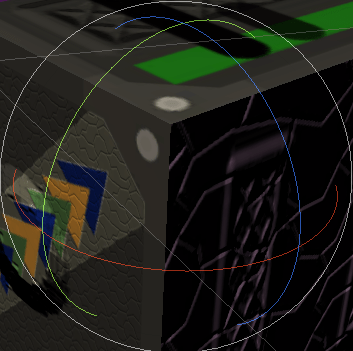
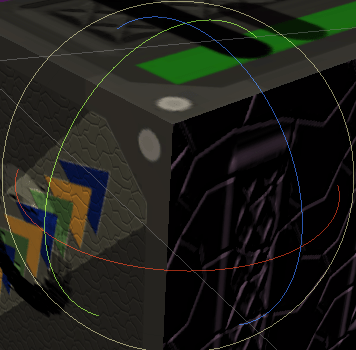
For normal maps I actually do “compute some lighting” on them (both uncompressed and compressed+decompressed),
and evaluate Luma-PSNR on the result. In my experience this better captures “effective quality” of lossy
normal map compression. Additionally, all the normal maps are passed with a (Y,Y,Y,X) (aka “DXT5nm”) swizzle
into the compressors, with assumption that X & Y channels being mostly uncorrelated, the compressor will be
able to capture that better by having one of them in RGB, and another one in Alpha. For compressors that
have special “normal map” compression mode, that is used too.
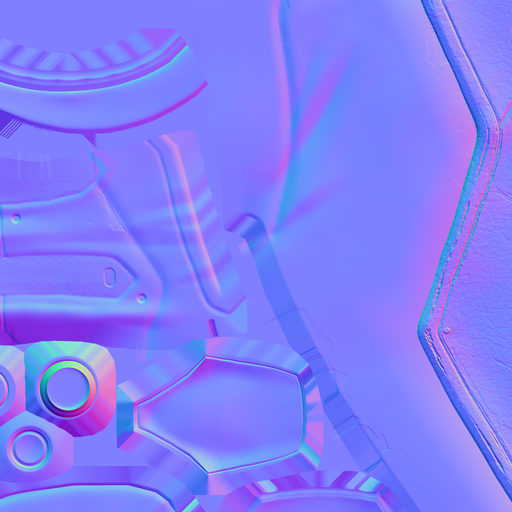

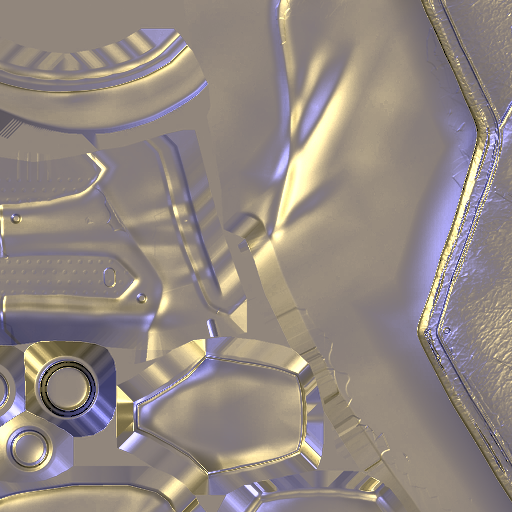
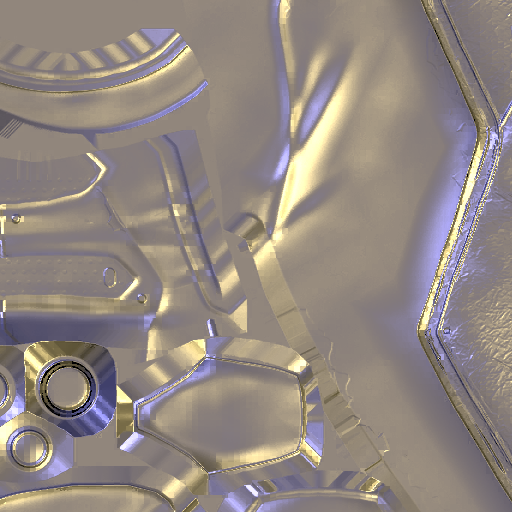
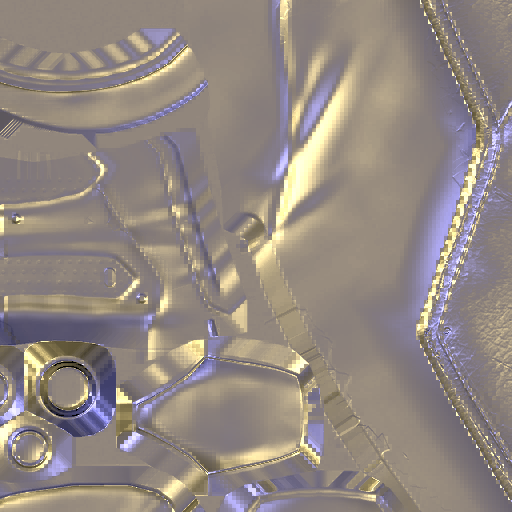
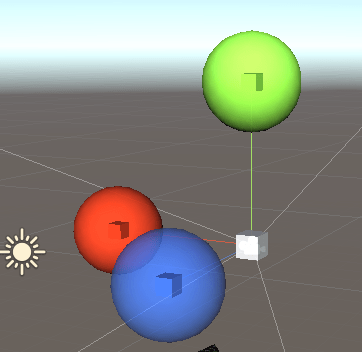
1) Raw normal map; 2) “computed lighting” on the normal map used to evaluate compression quality; 3) compressed to ASTC 4x4 with ARM astcenc “medium” setting; 4) compressed to ASTC 6x6 with ARM astcenc “very fast” setting; 5) compressed to ETC2 with ETCPACK “slow” setting.
I have not tested all the block compression formats out there (e.g. BC6H as ASTC HDR for HDR content,
or ETC, or some ASTC variants), and definitely have not tested all the compression libraries
(some are not publicly available, some I haven’t been able to build easily, some I’m probably not even
aware of, etc.).
For the ones I have tested, I compiled them with up to AVX2 (including BMI, FMA and POPCNT) instruction set
options where applicable.
Everything compiled with Xcode 11.7 (Apple clang version 11.0.3), running on 2018 MacBook Pro (Core i9 2.9GHz,
6 core / 12 thread). Multi-threading was used in a simple way, to split up the image into separate chunks
and compress each on their own thread. Timings on a Windows box with different hardware (AMD ThreadRipper 1950X)
and different compiler (Visual Studio 2019) were more or less similar.
Here’s a cleaner version of the first chart (click for an interactive page):
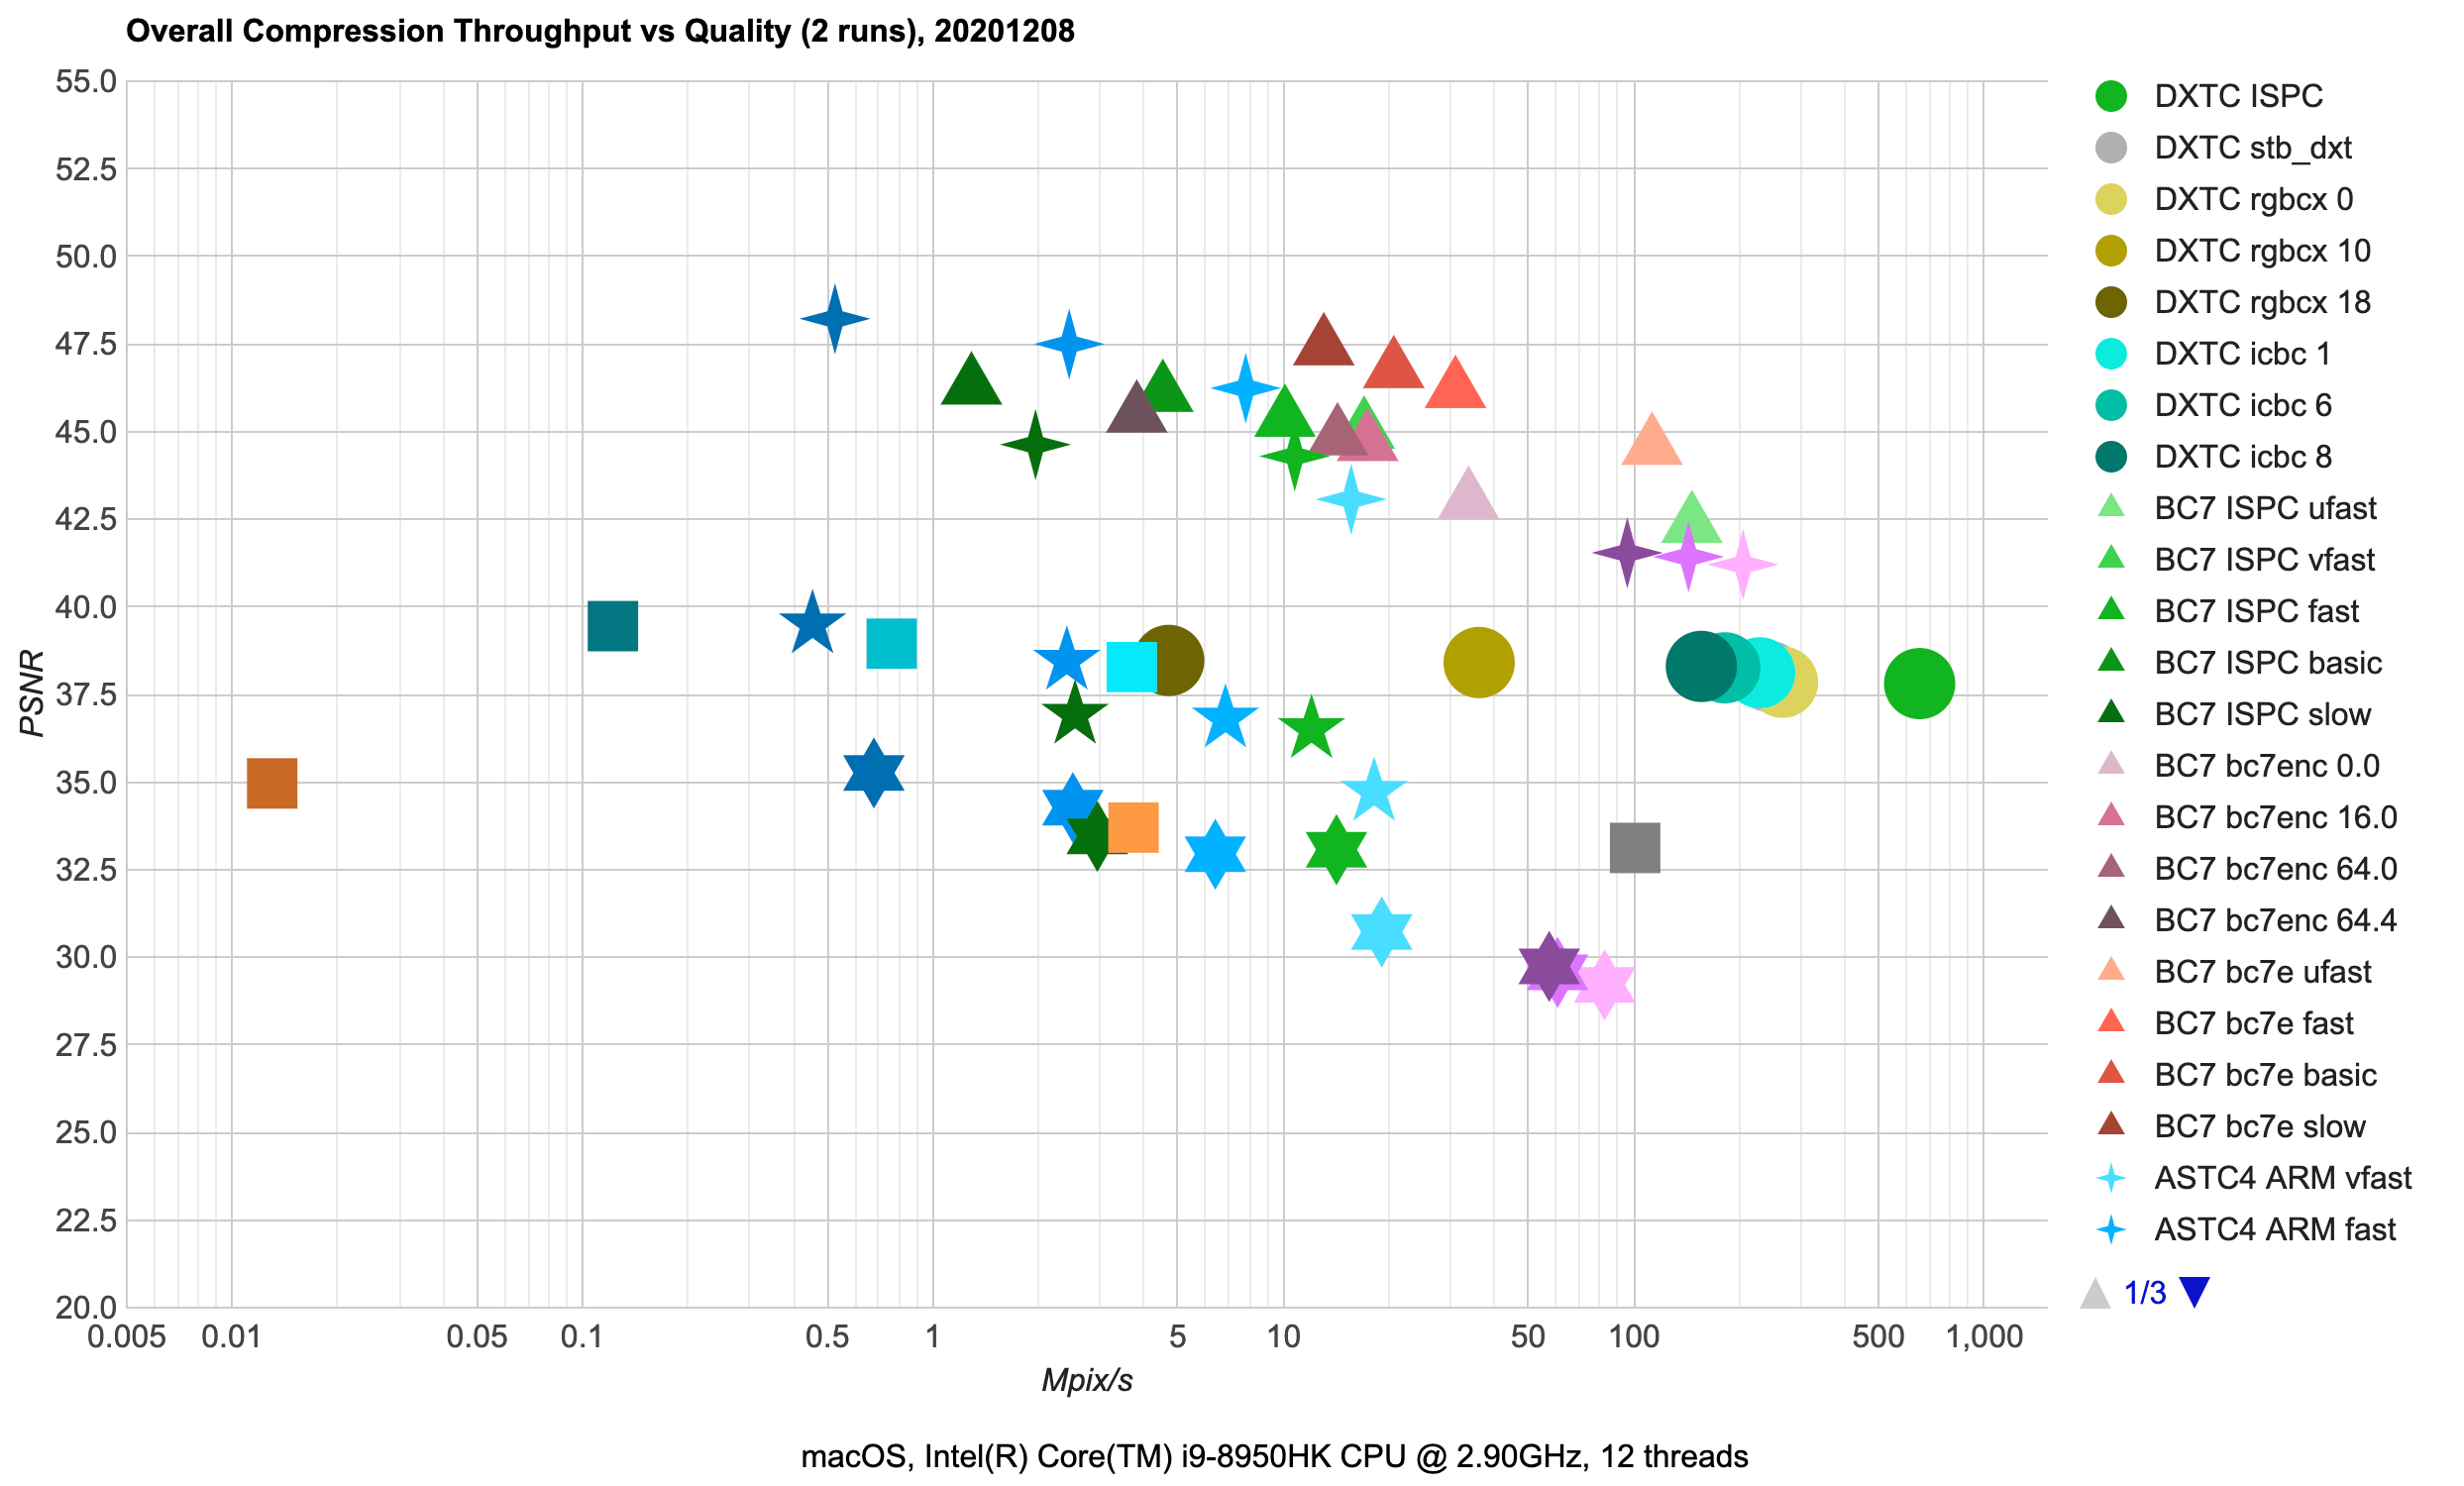
Points on the scatter plot are average across the whole test texture set compression performance (horizontal
axis, Mpix/s, note logarithmic scale!) against resulting image quality (Luma-PSNR, higher values are better).
Best possible results would be towards upper right corner (great quality, fast compression performance).
Different compression formats use different point shapes (e.g. DXTC aka BC1/BC3 uses circles; BC7 uses triangles etc.).
Different compression libraries use their own hue (e.g. Intel ISPCTextureCompressor is green; ARM astcenc is blue).
Libraries tested are:
ISPC: Intel ISPCTextureCompressor. DXTC, BC7, ASTC formats.
Built with code from 2020 August, with determinism patch
applied and using ISPC compiler version 1.14
(changes).bc7e: Binomial bc7e. BC7 format. Built with code from 2020 October,
using ISPC compiler version 1.14.bc7enc: Rich Geldreich bc7enc. BC7. Built with code from 2020 April.rgbcx: Rich Geldreich rgbcx. DXTC (BC1,BC3). Built with code from 2020 April.stb_dxt: Fabian Giesen & Sean Barrett stb_dxt. DXTC (BC1,BC3). Built with code from 2020 July.icbc: Ignacio Castano ICBC. DXTC (BC1 only). Built with code from 2020 August.ARM: ARM astcenc. ASTC. Built with code from 2020 November.ETCPACK: Ericsson ETCPACK. ETC2. Built on 2020 October.Etc2Comp: Google Etc2Comp. ETC2. Built on 2020 October.etcpak: Bartosz Taudul etcpak. ETC2. Built on 2020 October.Apple: Apple <AppleTextureEncoder.h>. I can’t find any official docs online; here’s a random
stack overflow answer that mentions it. This one is only available on Apple
platforms, and only supports ASTC 4x4 and 8x8 formats. Also tends to sometimes produce non-deterministic
results (i.e. slightly different compression bits on the same input data), so I only included it here
as a curiosity.
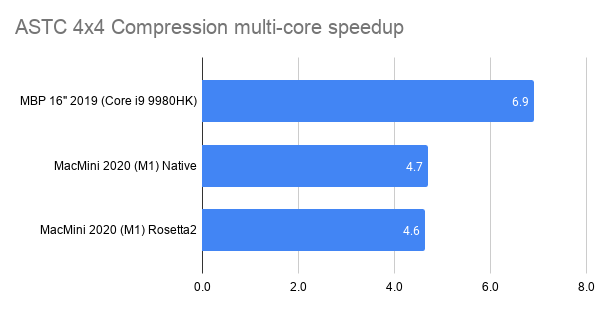
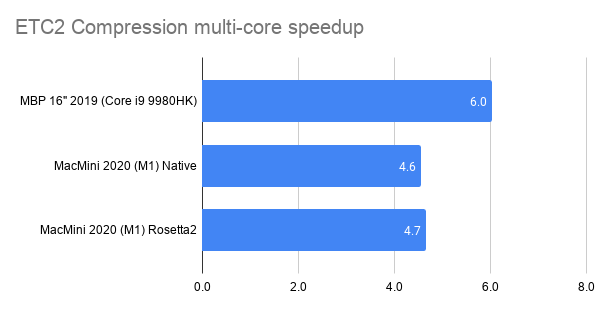
From the overall chart we can see several things:
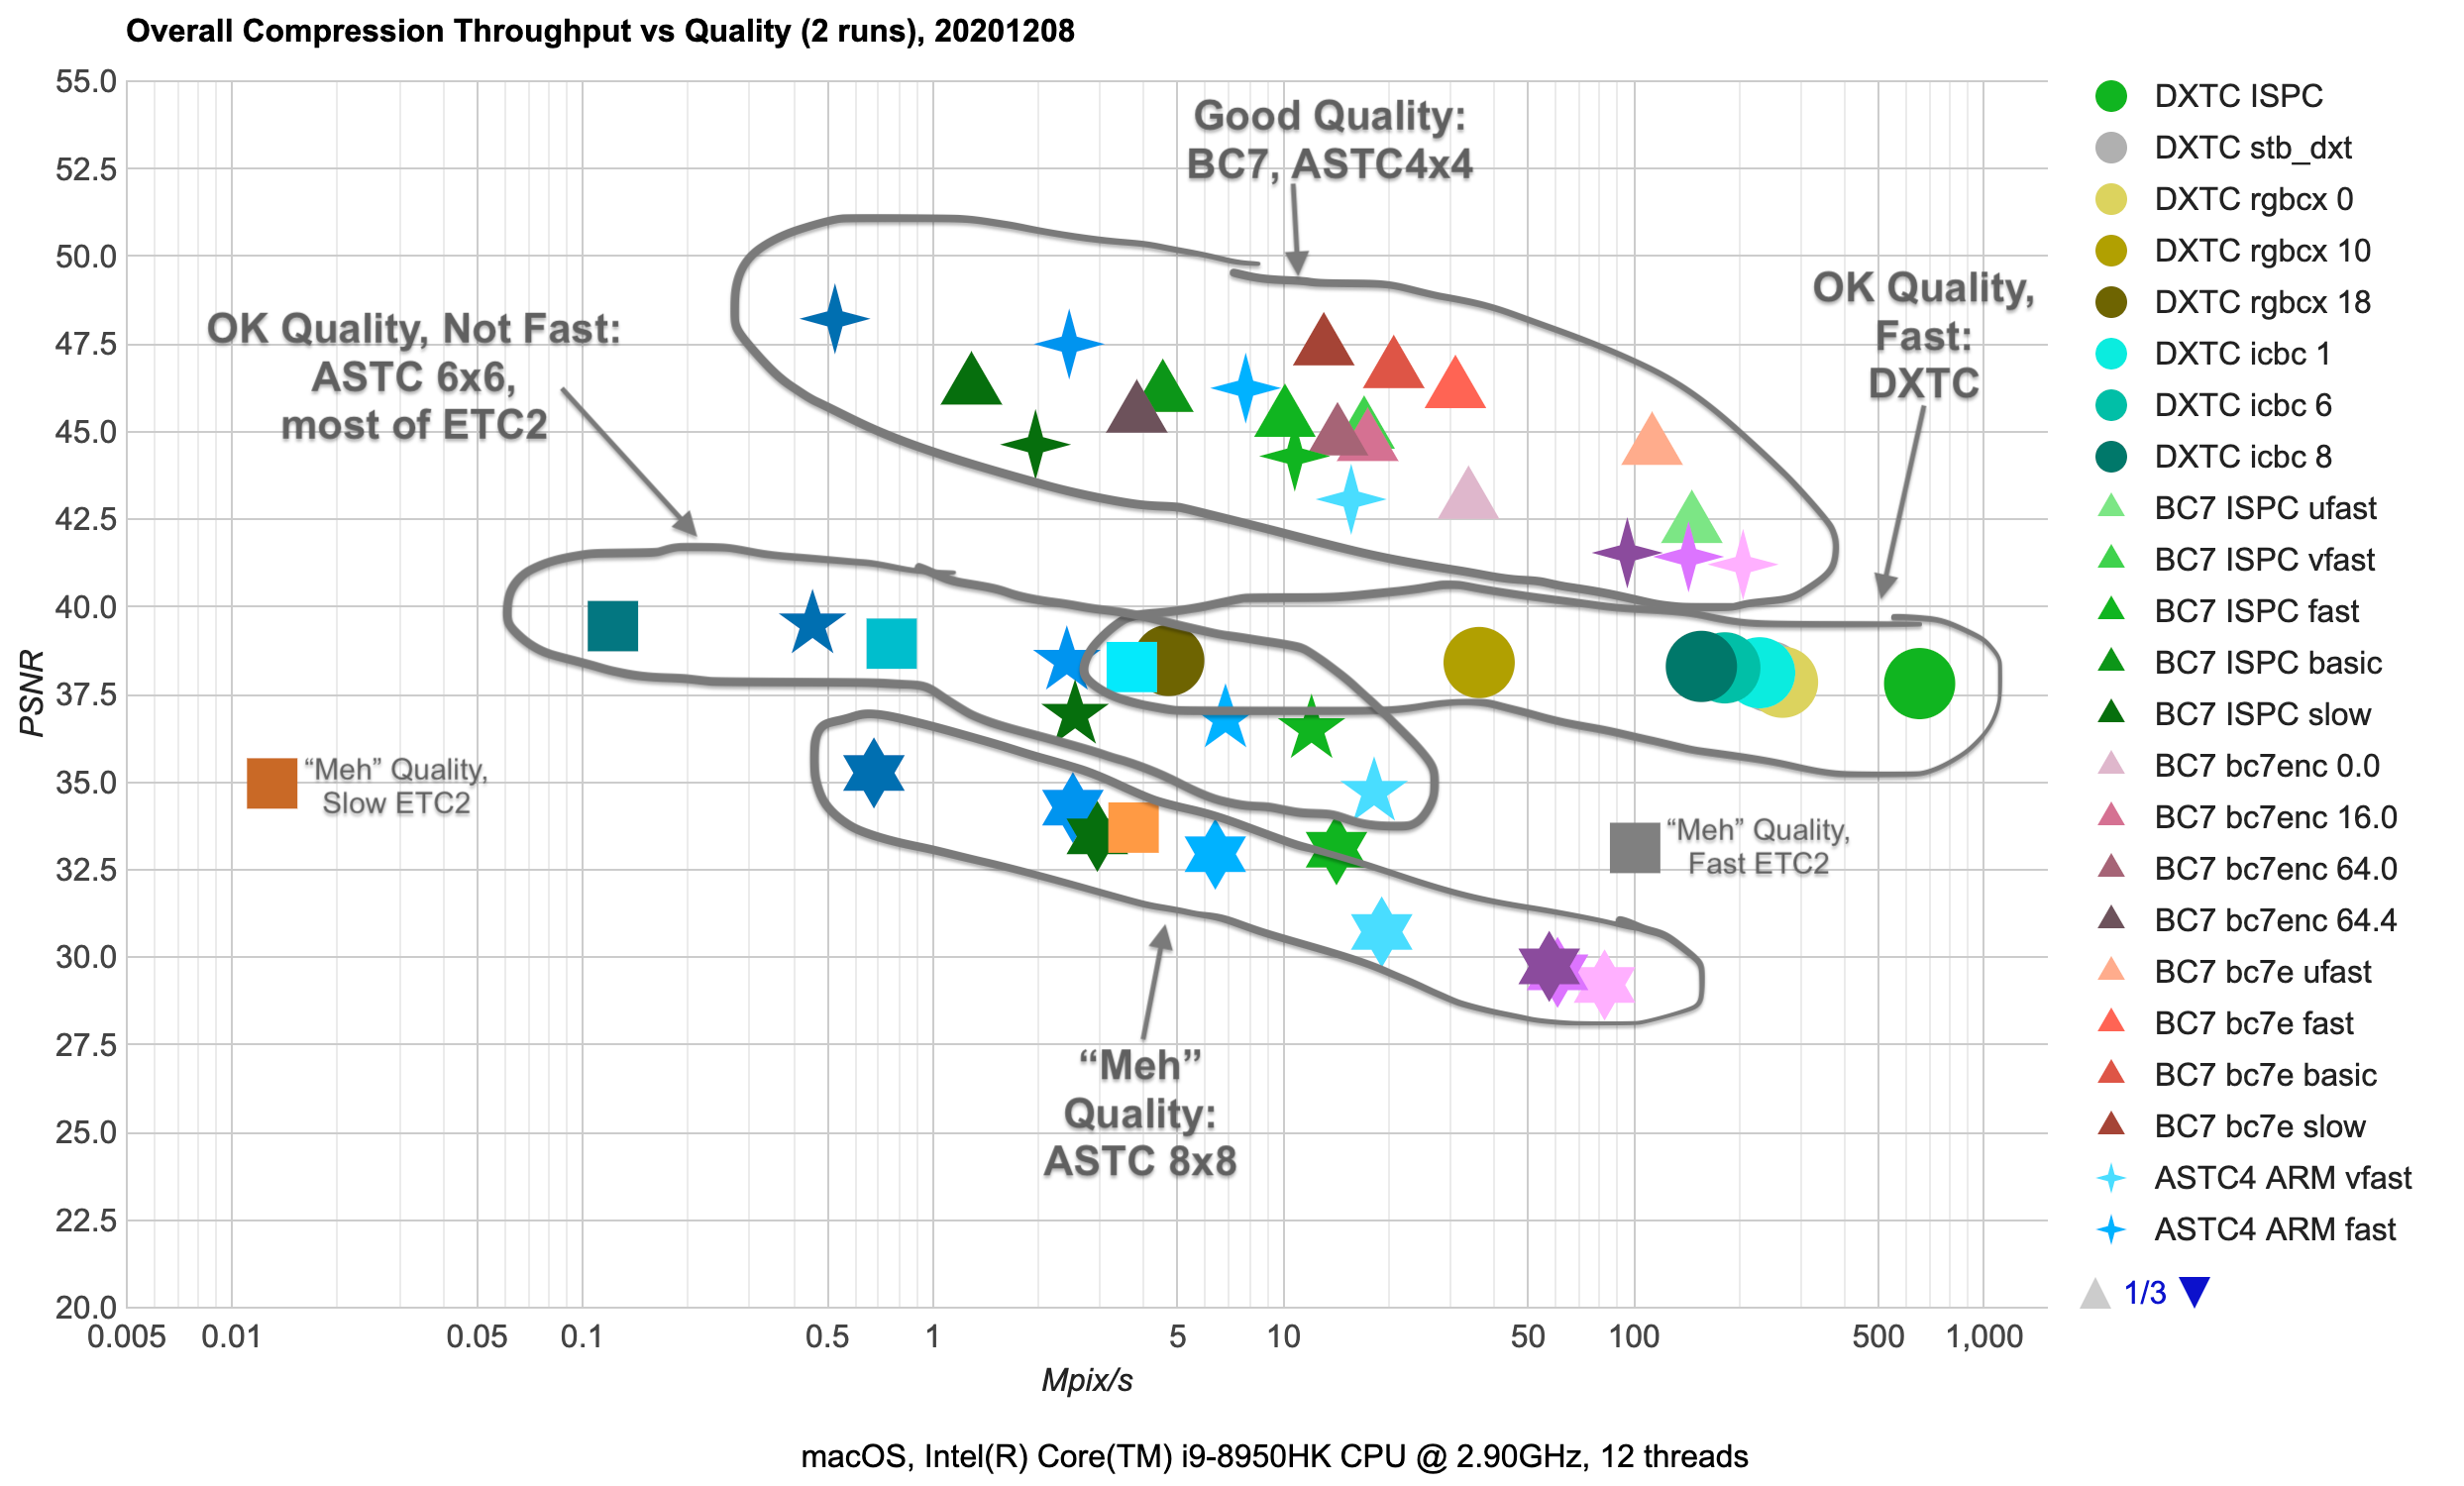
- There are high quality texture formats (BC7, ASTC 4x4), where PSNR is > 42 dB. Both of these are 8 bits/pixel
compression ratio. There’s a range of compression performance vs. resulting quality options available, with BC7
achieving very similar quality to ASTC 4x4, while being faster to compress.
- Medium quality (35-40 dB) formats include DXTC (BC1 at 4bits/pixel, BC3 at 8bits/pixel), ASTC 6x6
(3.6bits/pixel), ETC2 (4 or 8 bits/pixel). There’s very little quality variance in DXTC compressors, and most
of them are decently fast, with ISPC one approaching 1000 Mpix/s here. ETC2 achieves comparable quality with the same
compression ratio, but is two-three orders of magnitude slower to compress. ASTC 6x6 has lower bit rate for the same
quality, and similar compression speed as ETC2.
- “Meh” quality (<35 dB) formats or compressors. ASTC 8x8 is just two bits per pixel, but the artifacts
really start to be visible there. Likewise, ETC2 “etcpak” compressor is impressively fast (not quite at DXTC
compression speed though), but quality is also not great.
- There is a 50000x compression speed difference between slowest compressor on the chart
(ETC2 format, ETCPACK compressor at “slow” setting: average 0.013Mpix/s), and fastest compressor on the
chart (DXTC format, ISPC compressor: average 654Mpix/s). And the slowest one produces lower quality images too!
- Of course that’s an outlier; realistically usable ETC2 compressors are Etc2Comp “normal” (0.8Mpix/s) and “fast”
options (3.7Mpix/s). But then, for DXBC you have many options that go over 100Mpix/s while achieving
comparable quality – still a 100x performance difference.
- In the high quality group, there’s a similar performance difference between BC7 compressors producing >45dB quality
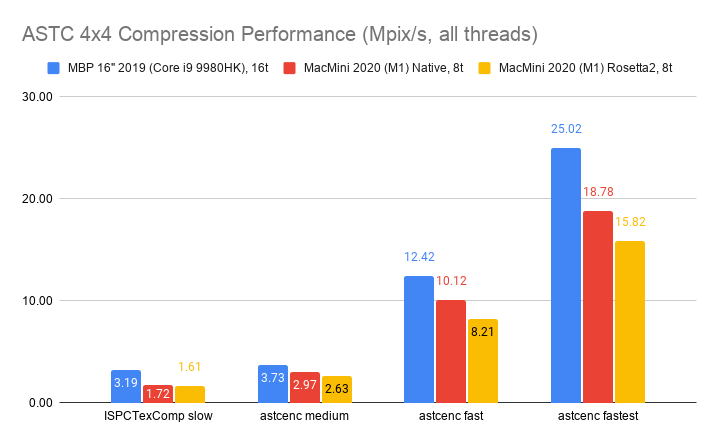
results at 10-20Mpix/s speed, whereas ASTC 4x4 achieves the same quality several times slower, at 2-8Mpix/s speed.
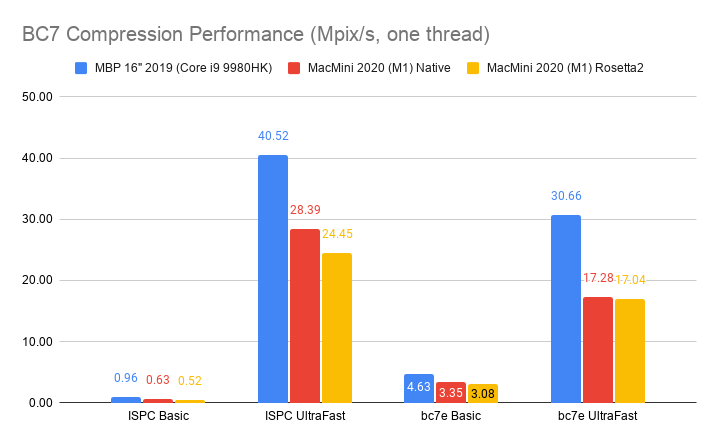
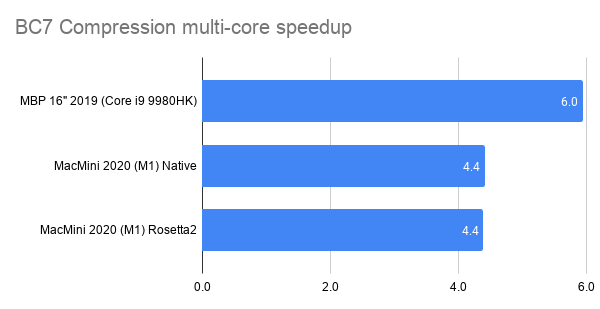
BC7 (PC): 8 bits/pixel, using 4x4 pixel blocks. Has been in all DX11-class PC GPUs (NVIDIA since 2010, AMD since 2009, Intel since 2012).
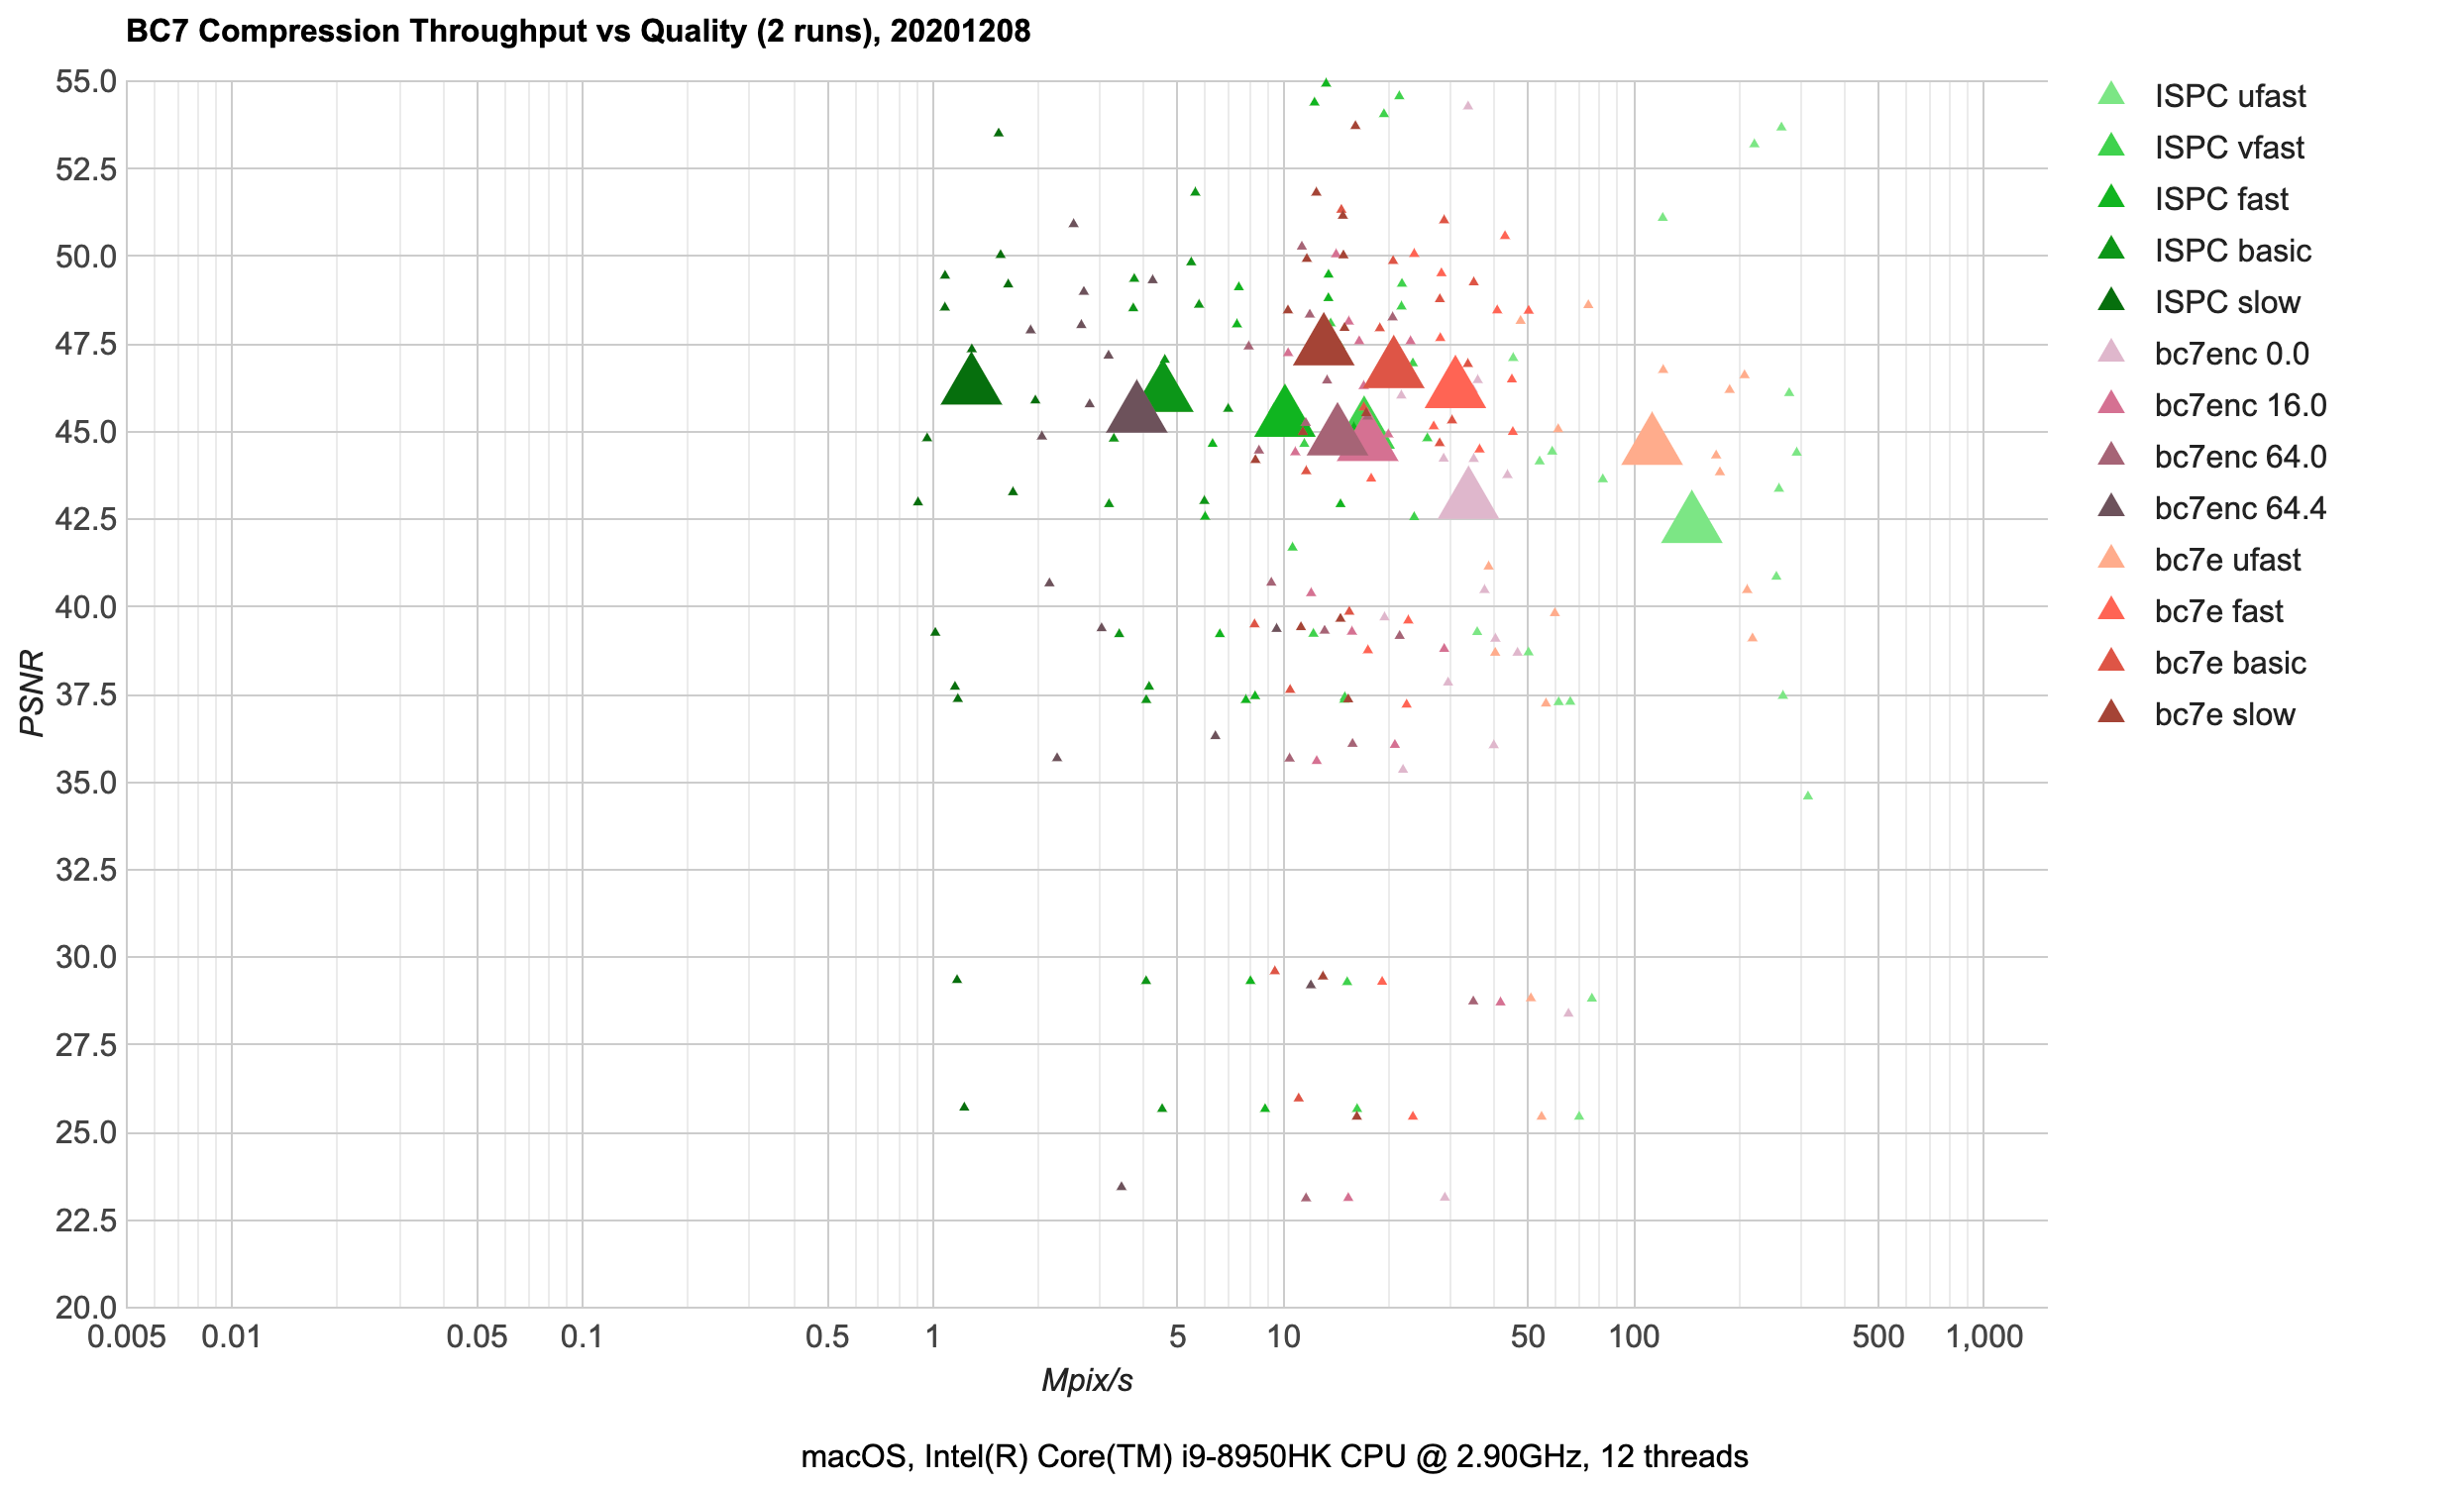
bc7e (red) looks like a clear winner. The various presets it has either have better quality, or faster
compression (or both) compared to ISPC (green).bc7enc is behind the curve in all aspects, which I think is by design – it seems more like an experiment
“how to do a minimal BC7 compressor”; just use bc7e instead.- A bunch of image results that are low quality (<30 dB in the chart) are all normal maps. I haven’t deeply investigated
why, but realistically you’d probably use BC5 format for normal maps anyway (which I’m not analyzing in this post at
all).
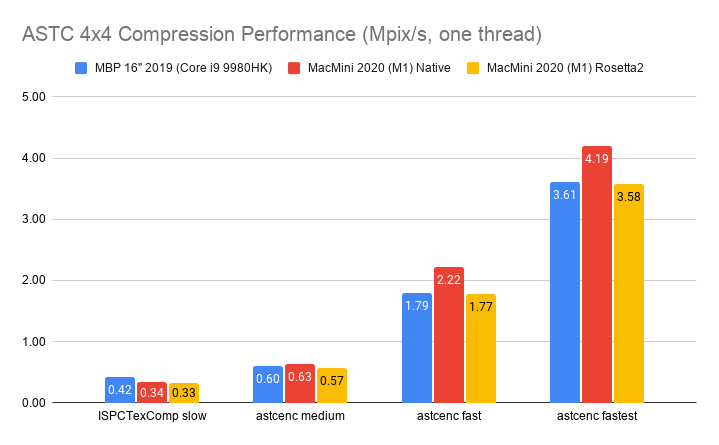
ASTC 4x4 (mobile): 8 bits/pixel, using 4x4 pixel blocks. Has been in most modern mobile GPUs:
ARM since Mali T624 (2012), Apple since A8 (2014),
Qualcomm since Adreno 4xx (2015), PowerVR since GX6250 (2014), NVIDIA since Tegra K1 (2014).
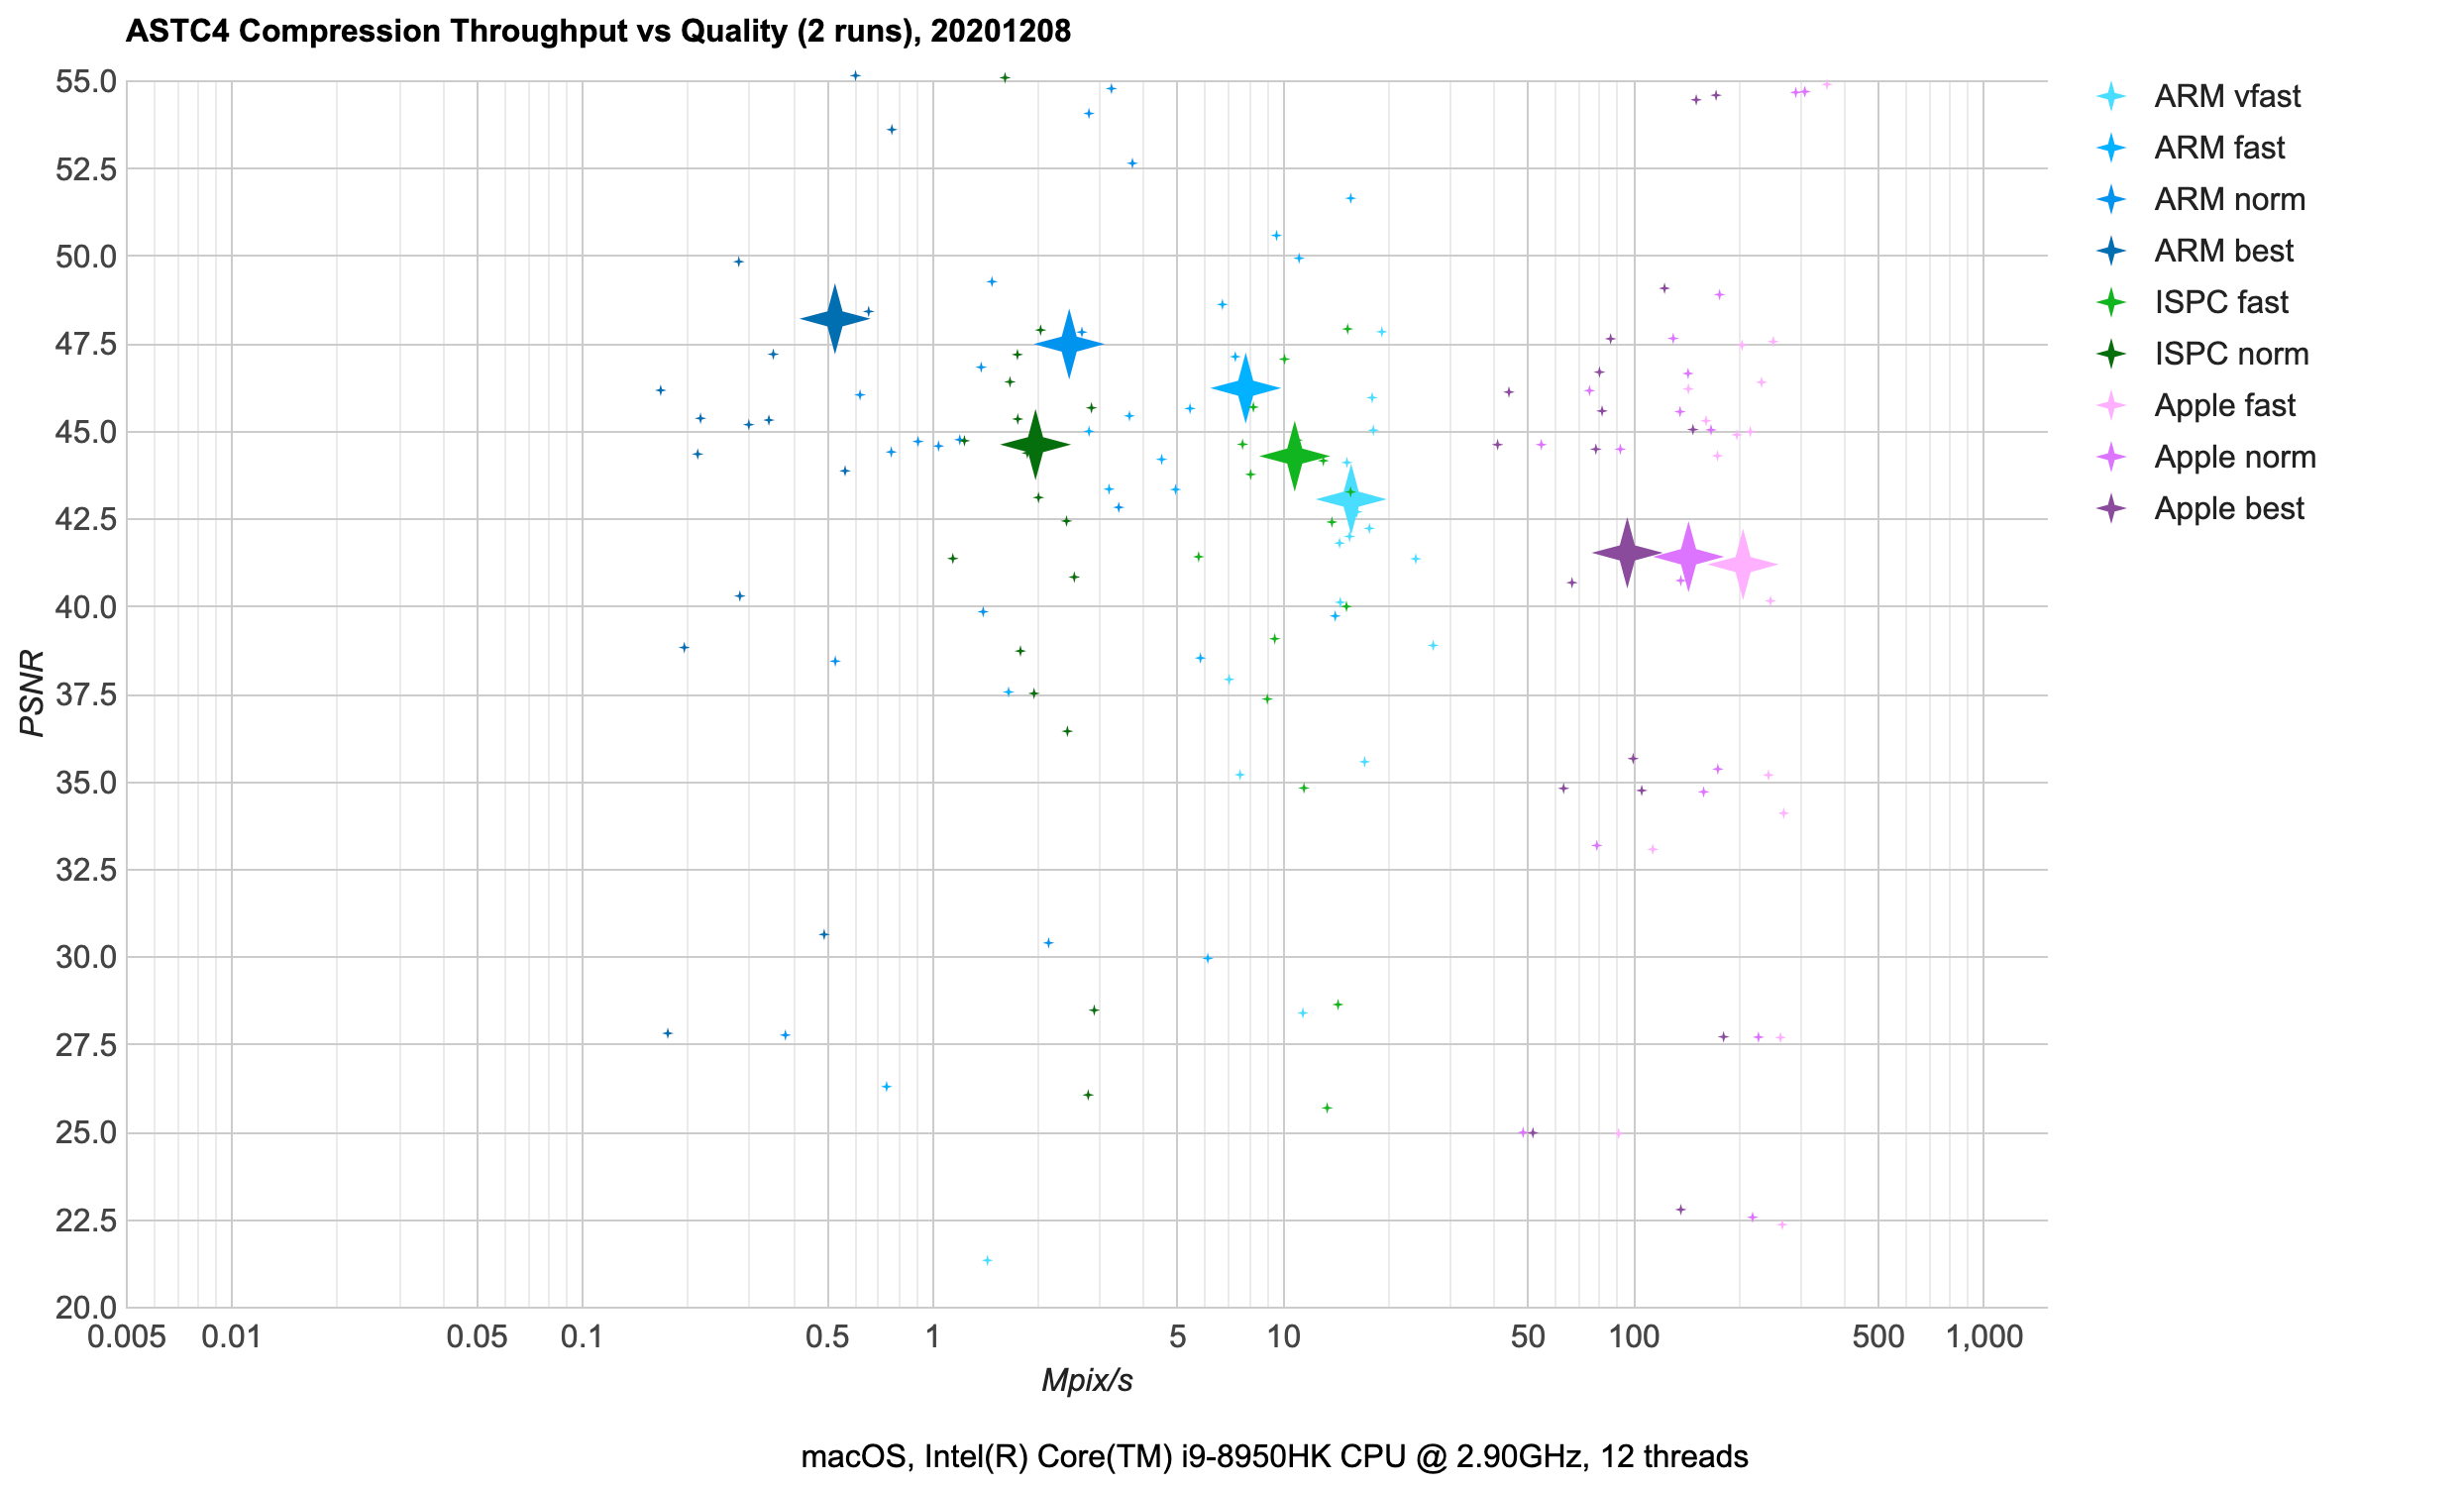
ARM astcenc (blue) is a good choice there. It used to be several times slower in 1.x versions; back then ISPC
(green) might have been better. Apple (purple) is of limited use, since it only works on Apple platforms and
sometimes produces non-deterministic results. It’s impressively faster than others though, although at expense
of some quality loss.- Just like with BC7, all the low-quality results are from normal maps. This one’s curious, since I am passing a
“normal map please” flag to the compressor here, and ASTC format is supposed to handle uncorrelated components
in a nice way. Weird, needs more investigation! Anyway, at 8 bits/pixel for normal maps one can use EAC RG compression
format, which I’m also not looking at in this post :)
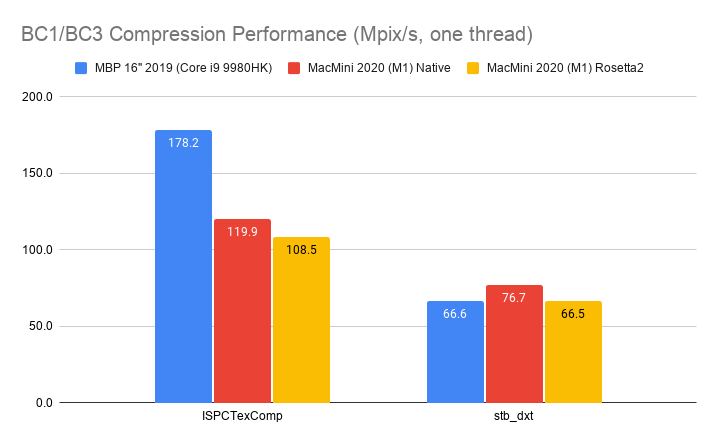
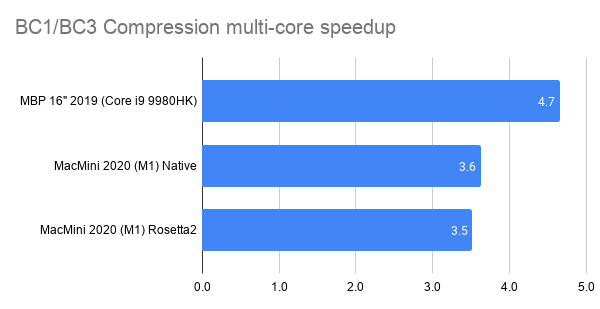
DXTC (PC): 4 bits/pixel for RGB (BC1 aka DXT1), 8 bits/pixel for RGBA (BC3 aka DXT5). This has been on PCs
since forever, and BC1 is still quite used if you need to get below 8 bits/pixel
(it’s literally the only option available, since BC7 is always 8 bits/pixel).
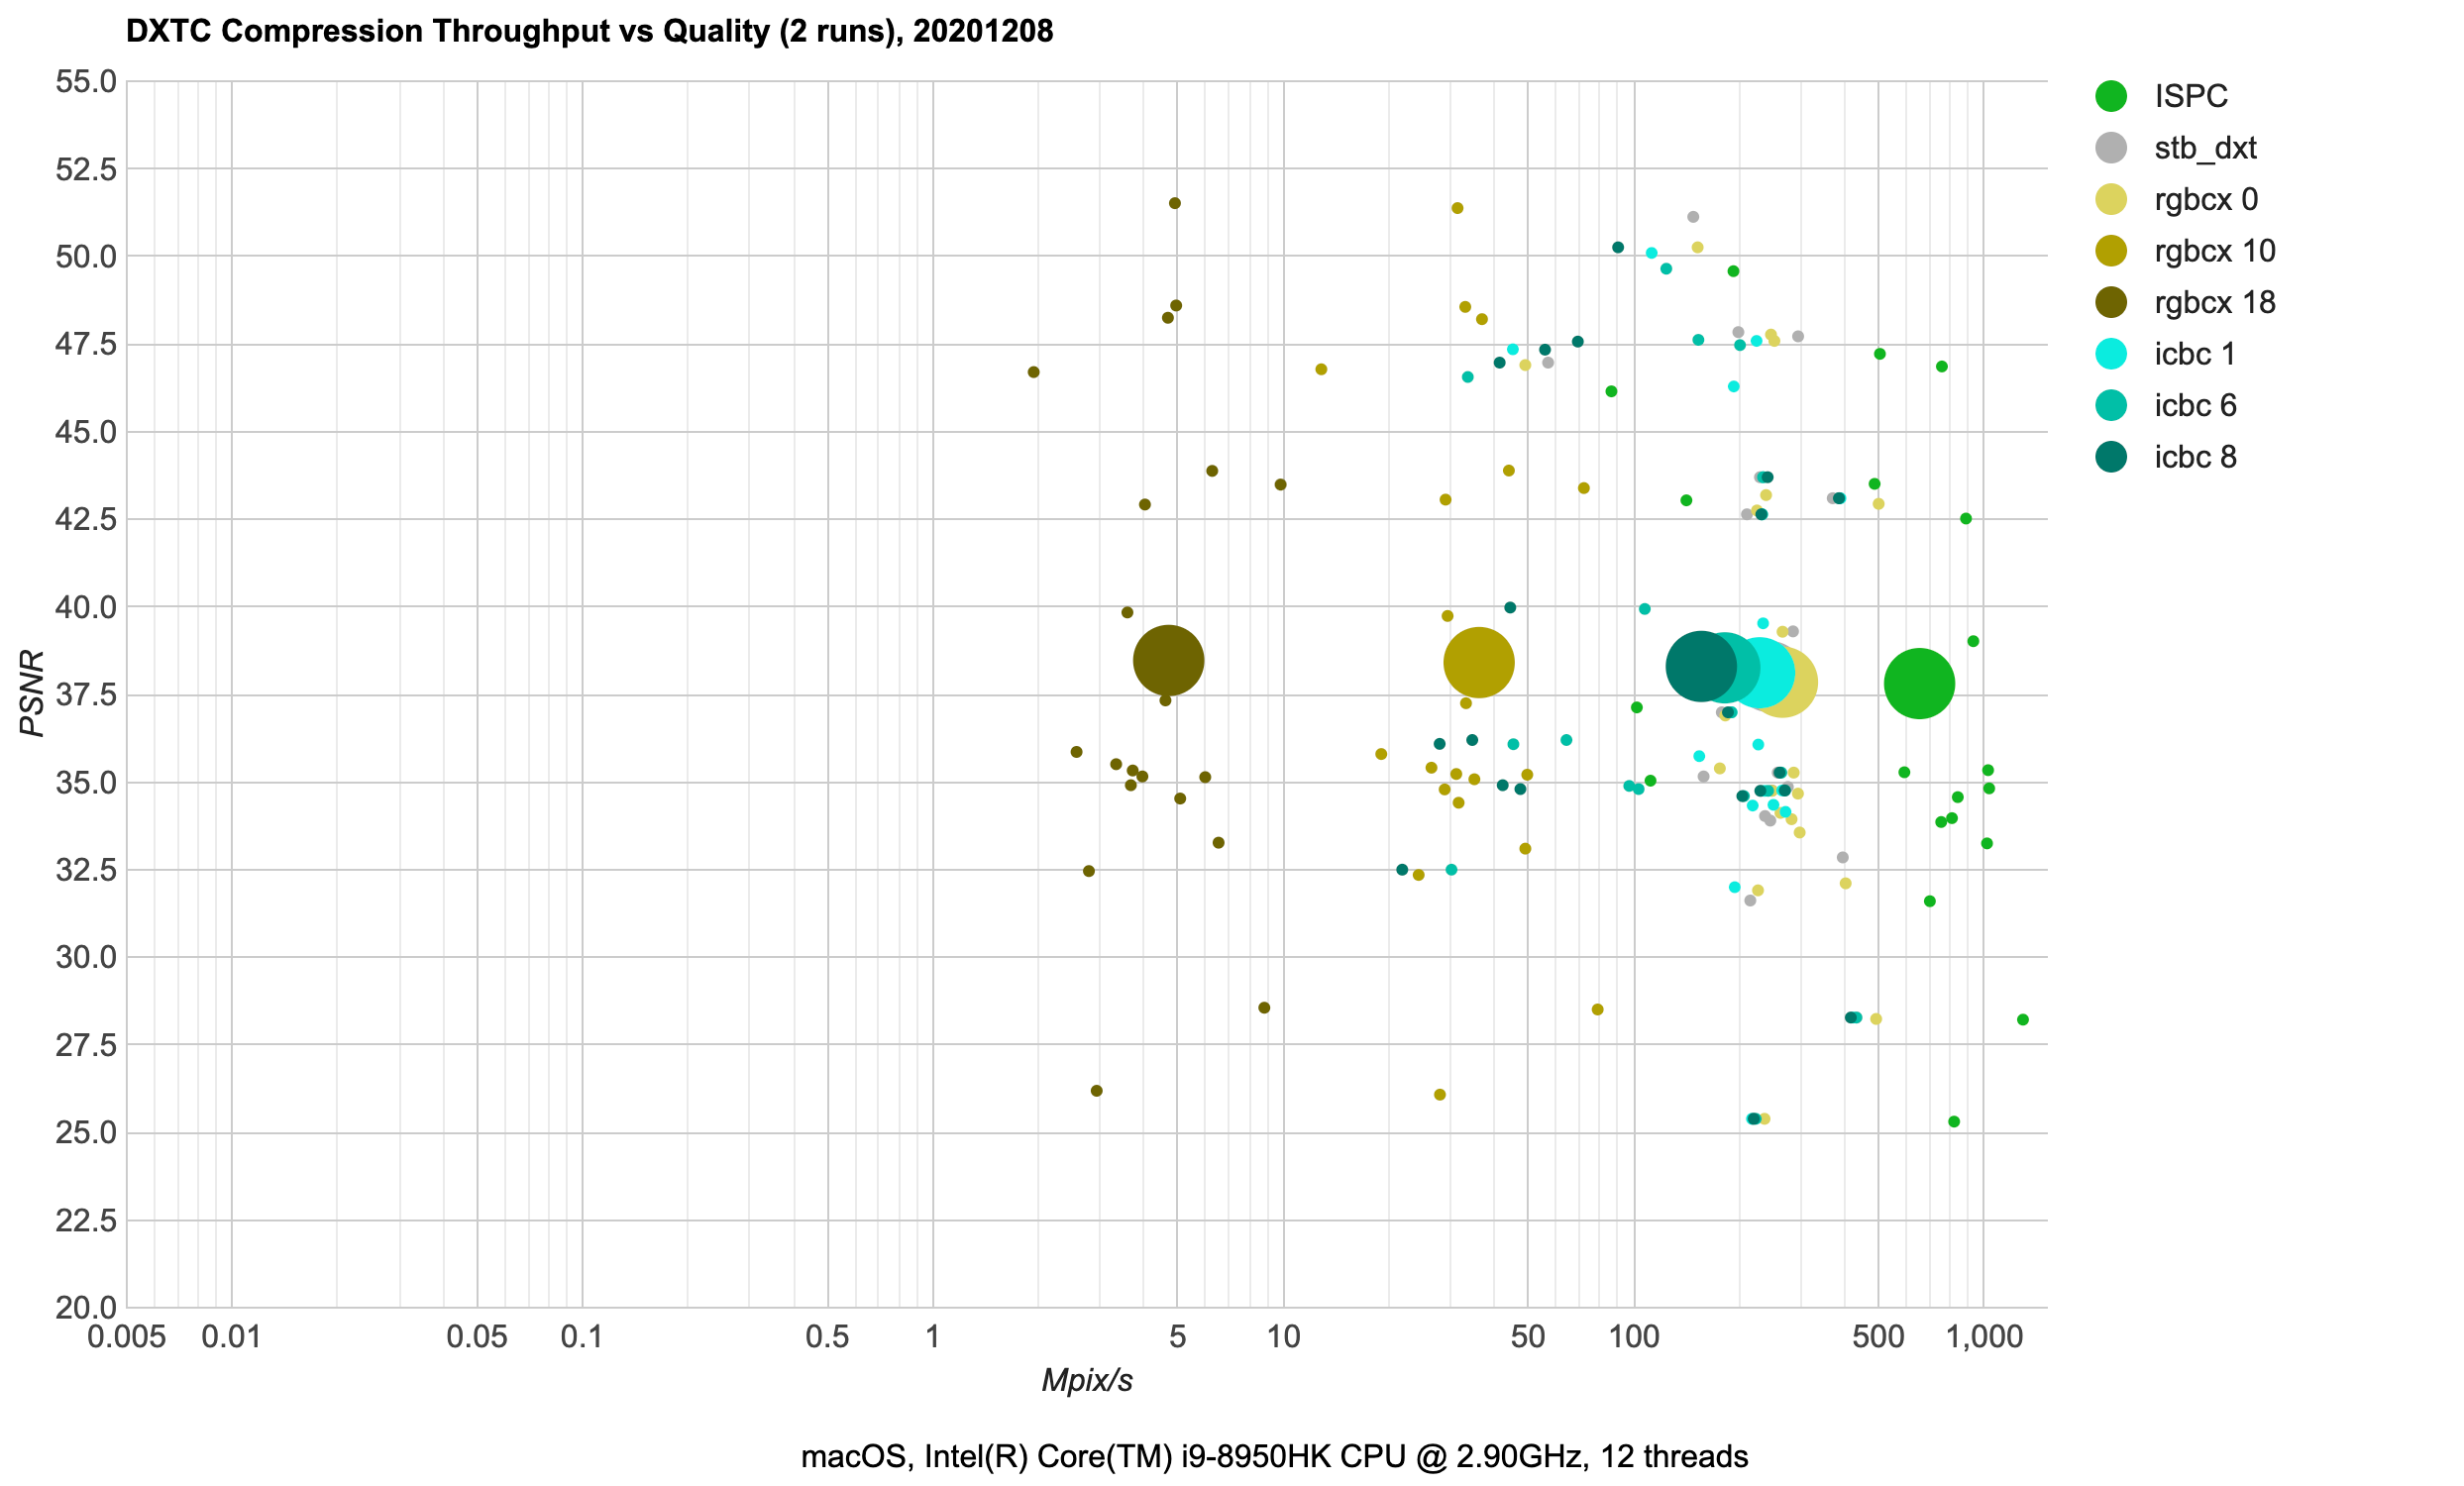
It’s a fairly simple format, and that combined with the “has been there for 20 years” aspect means that effective
compression techniques for it are well researched at this point.
ISPC (green) has been the go-to compressor for some years in many places, offering impressive compression performance.stb_dxt (gray; hiding between icbc 1 and rgbcx 0 in the chart) has been available for a long time too, for
a small and decently fast compressor.rgbcx (yellow) and icbc (cyan) are fairly new (both appeared in Spring 2020), and both are able to squeeze out
a (little) bit more quality of this old format. icbc is BC1 only though; here in my testbed it falls back to
stb_dxt for RGBA/BC3 images.
ASTC 6x6 (mobile): 3.6 bits/pixel, using 6x6 pixel blocks. Same platform availability as ASTC 4x4.
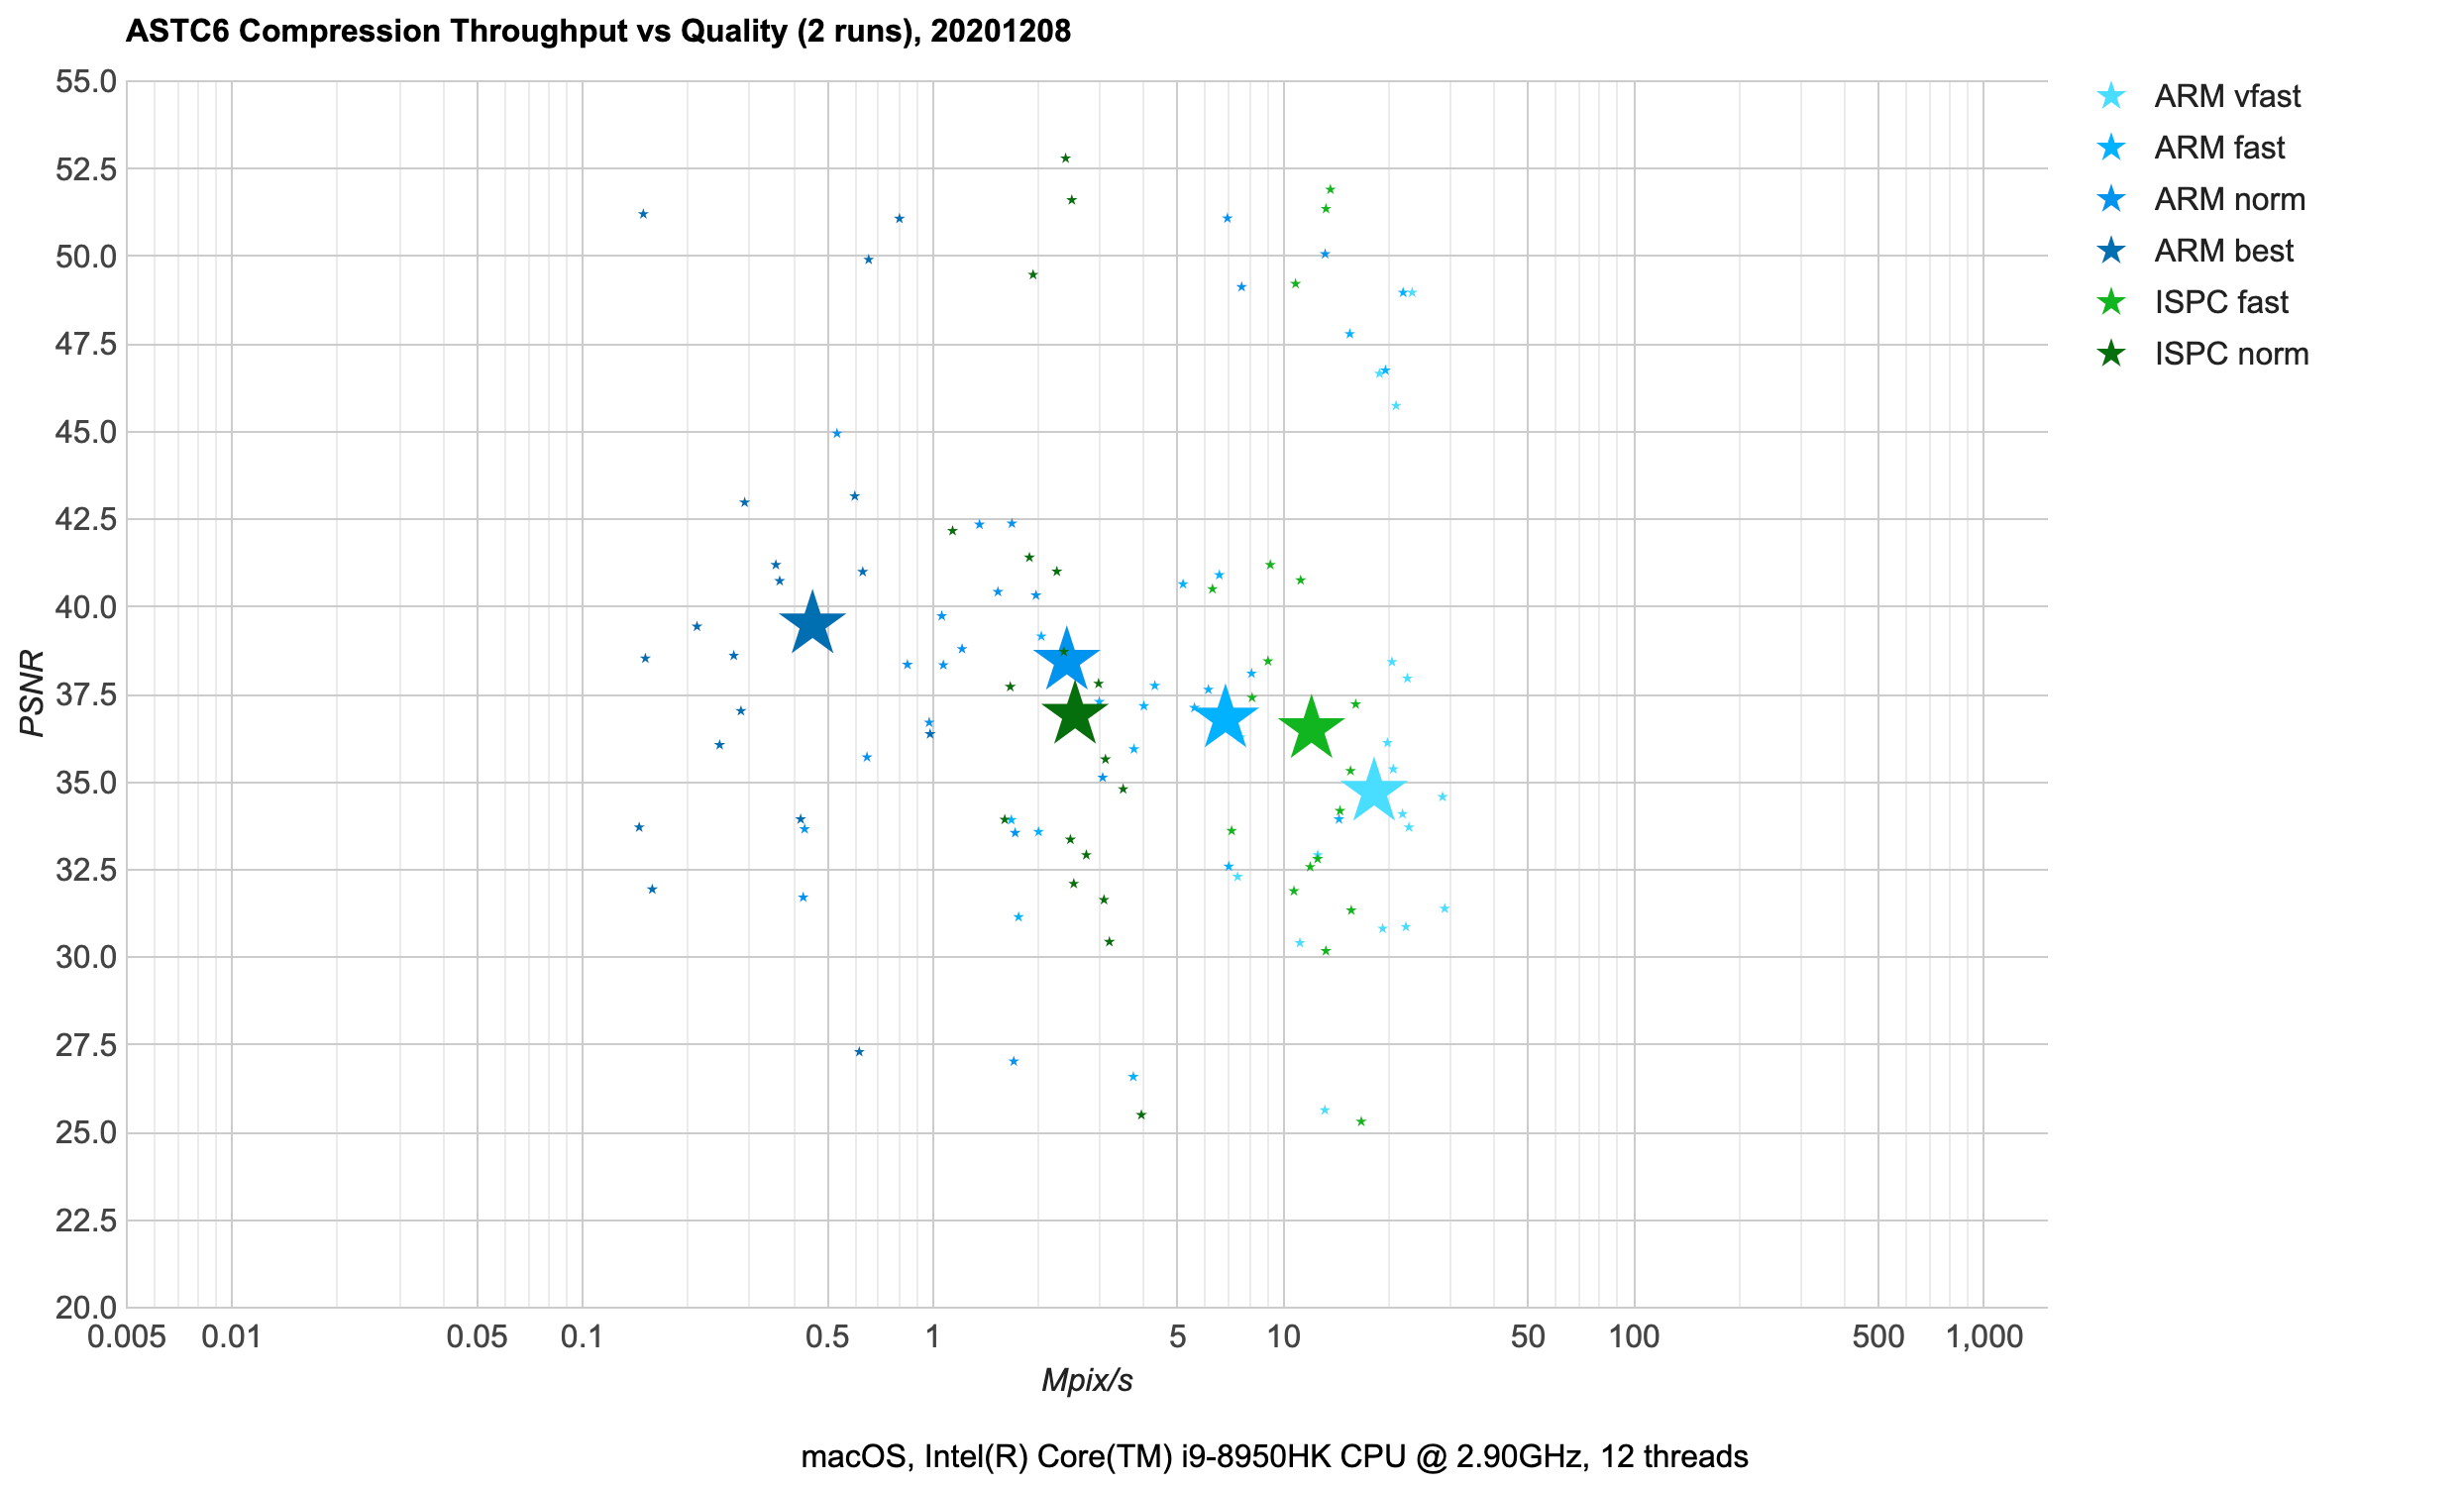
- Same conclusions as for ASTC 4x4:
ARM compressor is a good choice here. Well, there isn’t much to
choose from, now is there :)
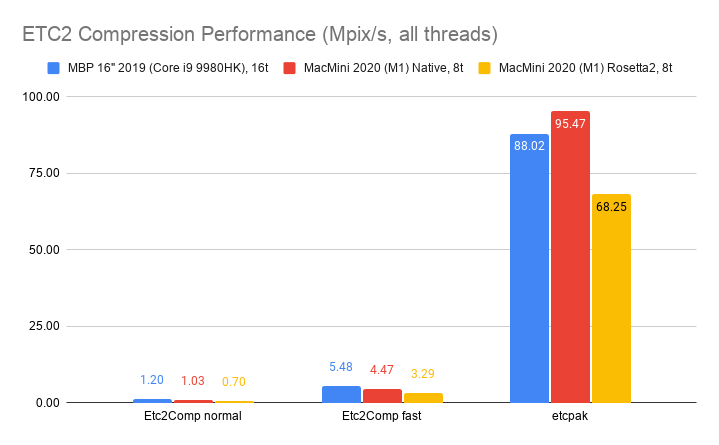
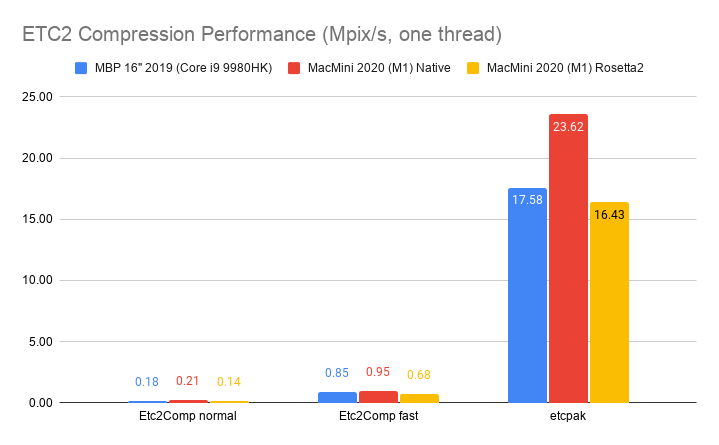
ETC2 (mobile): 4 bits/pixel for RGB, 8 bits/pixel for RGBA. Has been on mobile slightly longer than ASTC has
(ETC2 is supported on all OpenGL ES 3.0, Vulkan and Metal mobile GPUs – it’s only OpenGL ES 2.0 GPUs that might not
have it).
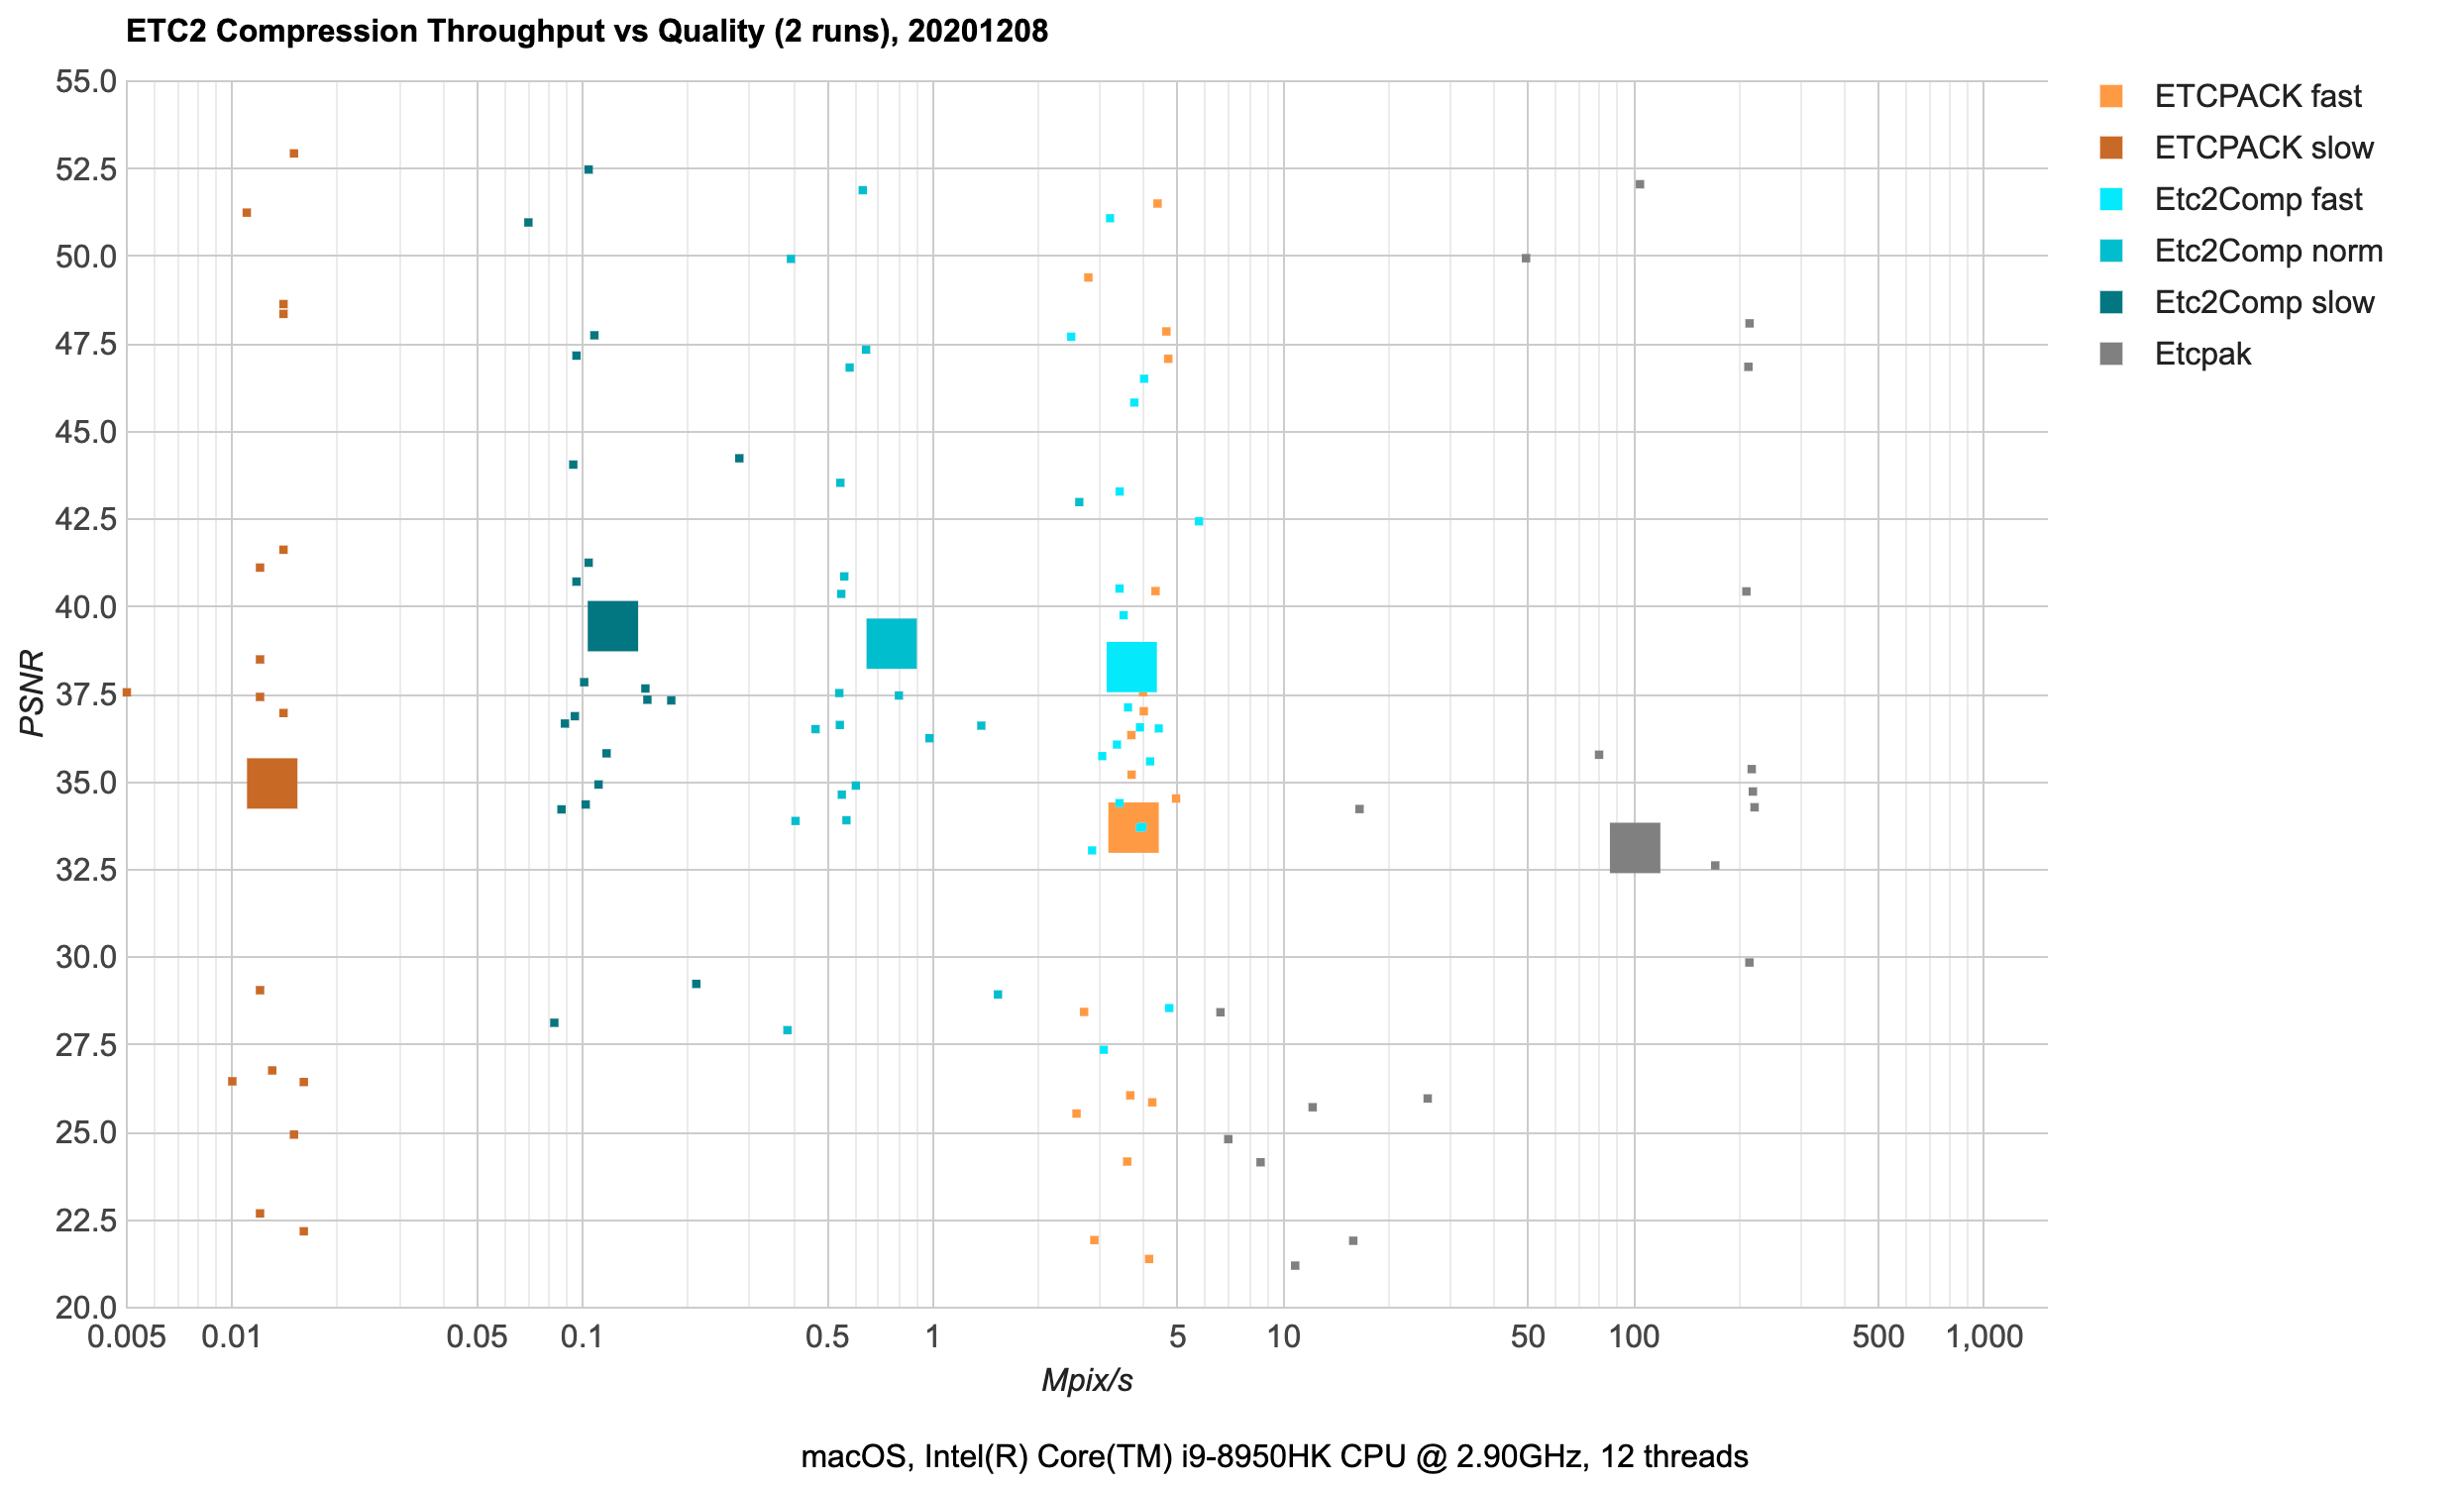
- Use
Etc2Comp (cyan) - it’s not very fast (only 0.1-5 Mpix/s speed) but produces good quality for the format.
- If compression speed is important,
etcpak (gray) is fast.
ETCPACK (orange) does not look like it’s useful for anything :)
ASTC 8x8 (mobile): 2 bits/pixel, using 8x8 pixel blocks. Same platform availability as other ASTC variants.
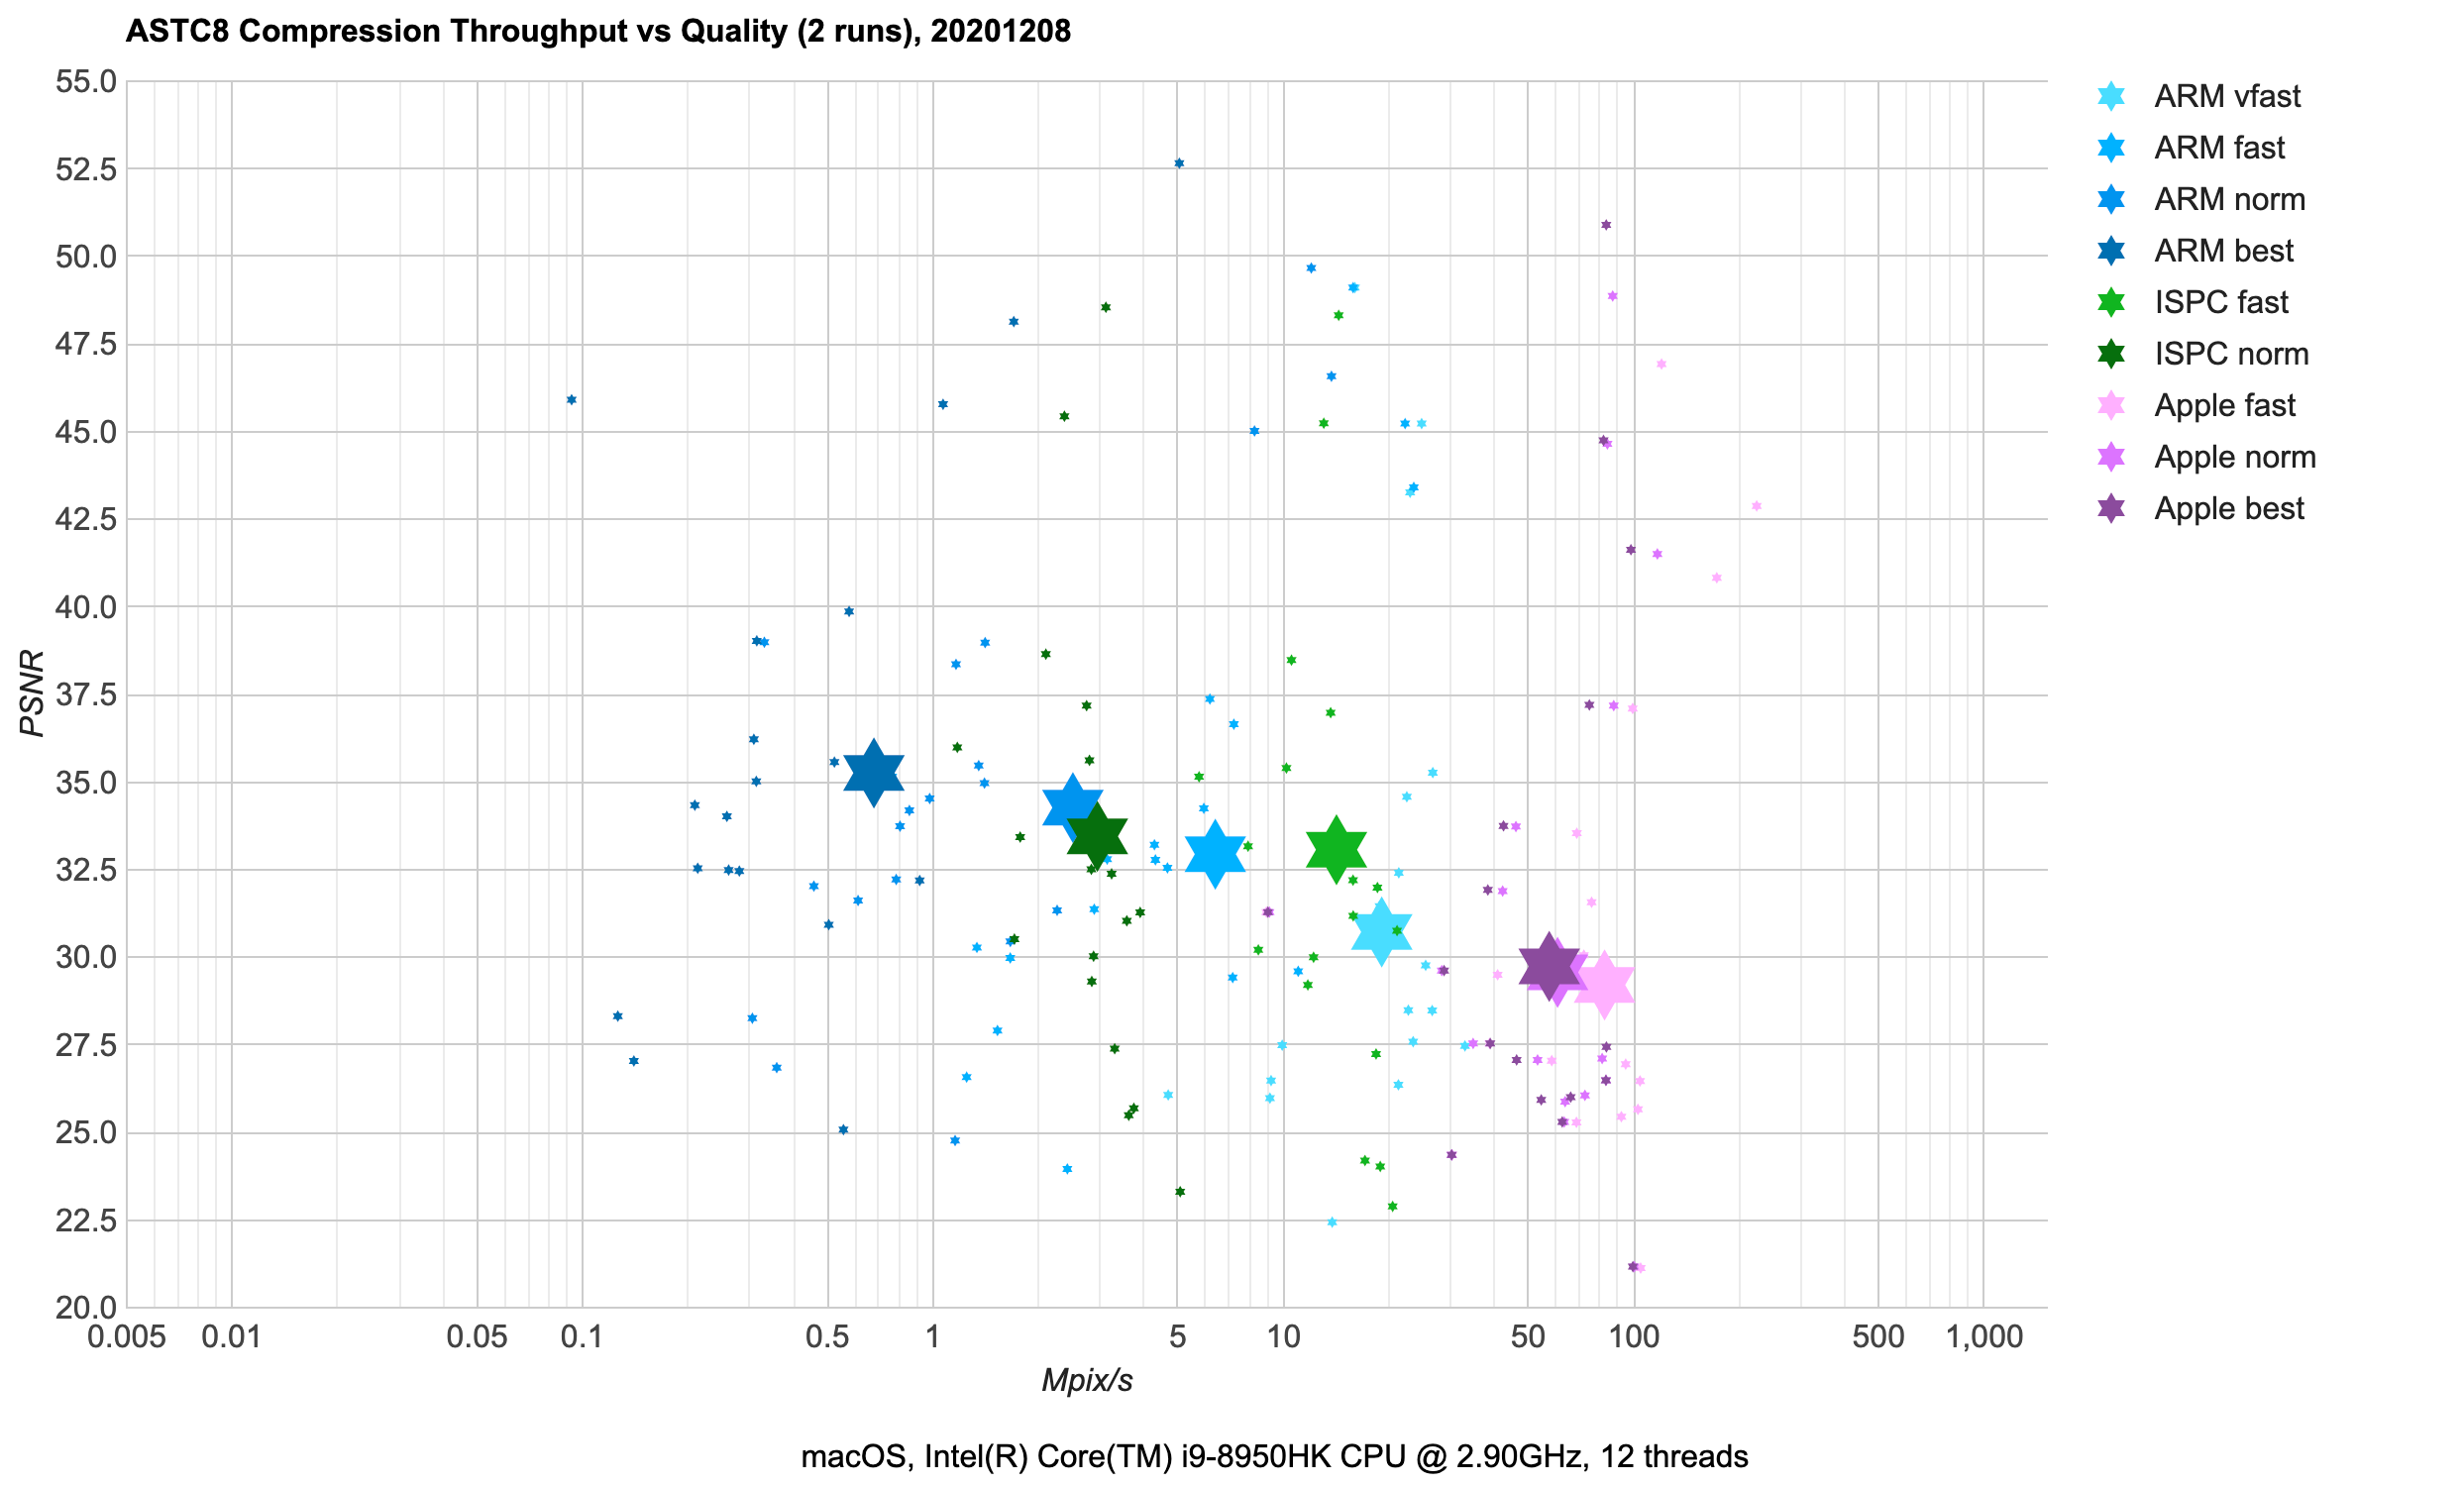
- Similar conclusions as for ASTC 4x4:
ARM compressor is a good choice here; ISPC is not bad either.
- Same comments w.r.t.
Apple one as in 4x4 case.
Further Work
For the “maybe someday” part…:
- Investigate other texture formats, like:
- BC4 (PC) / EAC R (mobile) for grayscale images,
- BC5 (PC) / EAC RG (mobile) for normal maps,
- BC6H (PC) / ASTC HDR (mobile) for high dynamic range images,
- PVRTC (mobile)? Not sure if it’s very practical these days though.
- ETC (mobile)? Likewise, not sure if needed much, with ETC2 & ASTC superseding it.
- Look at some GPU compute shader based texture compressors, e.g. Matias Goldberg
betsy or AMD Compressonator.
- Also would like to look into determinism of those. Even already on CPUs it’s easy to have a compressor
that produces different results when ran on different machines. In GPU land it’s probably way
more common!
- Looks into other compression libraries.
- I’ve skipped some for this time since I was too lazy to build them (e.g. Compressonator does not
compile on macOS).
- etcpak “QuickETC2” (commit) branch looks
interesting, but I haven’t tried it yet.
- There’s a whole set of compressors that are focused on “Rate Distortion Optimization” (RDO)
compression aspect, where they can trade off texture quality for better further compressibility
of texture data for storage (i.e. if game data files are using zlib-compression, the compressor
can make compressed bits “zlib friendlier”). Oodle Texture
and Binomial Basis are compressors like that, however both are not publicly
available so it’s not trivial to casually try them out :)
- Maybe there are other compressors out there, that are worth looking at? Who knows!
That’s it for now! Go and compress some textures!