Curious Case of Slow Texture Importing, and xperf

I was looking at a curious bug report: “Texture importing got much slower in current beta”. At first look, I dismissed it under “eh, someone’s being confused” (quickly tried on several textures, did not notice any regression). But then I got a proper bug report with several textures. One of them was importing about 10 times slower than it used to be.

Why would anyone make texture importing that much slower? No one would, of course. Turns out, this was an unintended consequence of generally improving things.

But, the bug report made me use xperf (a.k.a. Windows Performance Toolkit) for the first time. Believe it or not, I’ve never used it before!

So here’s the story

We’ve got a TGA texture (2048x2048, uncompressed - a 12MB file) that takes about 10 seconds to import in current beta build, but it took ~1 second on Unity 4.6.

First wild guess: did someone accidentally disable multithreaded texture compression? Nope, doesn’t look like it (making final texture be uncompressed still shows massive regression).

Second guess: we are using FreeImage library to import textures. Maybe someone, I dunno, updated it and comitted a debug build? Nope, last change to our build was done many moons ago.

Time to profile. My quick “I need to get some answer in 5 seconds” profiler on Windows is Very Sleepy, so let’s look at that:

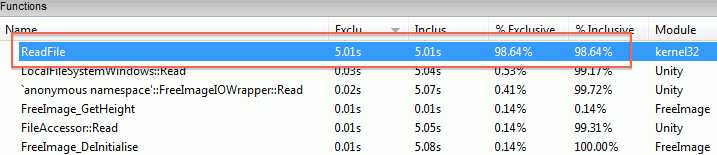
Wait what? All the time is spent in WinAPI ReadFile function?!

Is there something special about the TGA file I’m testing on? Let’s make the same sized, uncompressed PNG image (so file size comes out the same).

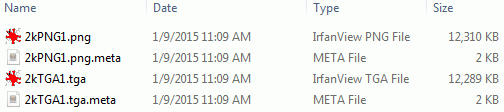
The PNG imports in 108ms, while TGA in 9800ms (I’ve turned off DXT compression, to focus on raw import time). In Unity 4.6 the same work is done 116ms (PNG) and 310ms (TGA). File sizes roughly the same. WAT!

Enter xperf

Asked a coworker who knows something about Windows: “why would reading one file spend all time in ReadFile, but another file of same size read much faster?”, and he said “look with xperf”.

I’ve read about xperf at the excellent Bruce Dawson’s blog, but never tried it myself. Before today, that is.

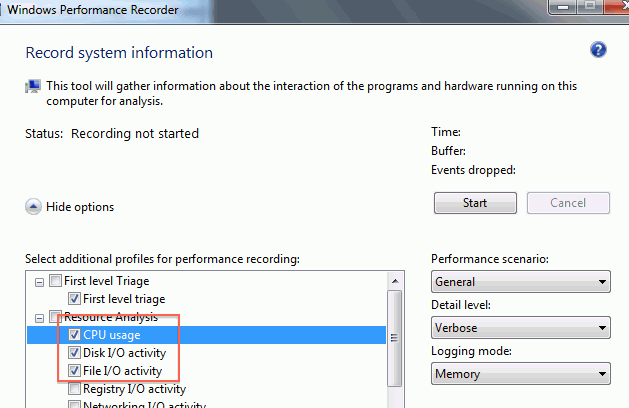
So, launch Windows Performance Recorder (I don’t even know if it comes with some VS or Windows SDK version or needs to be installed separately… it was on my machine somehow), tick CPU and disk/file I/O and click Start:

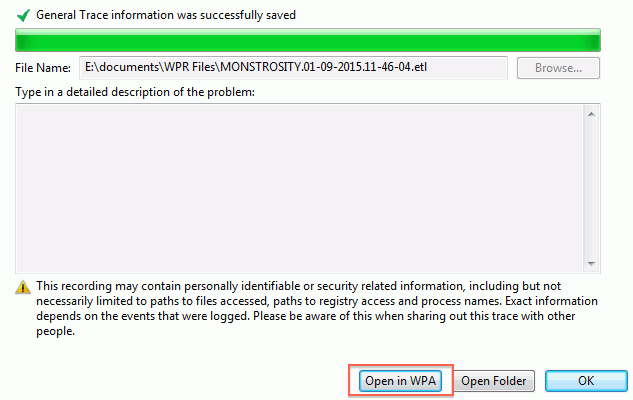
Do texture importing in Unity, click save, and on this fairly confusing screen click “Open in WPA”:

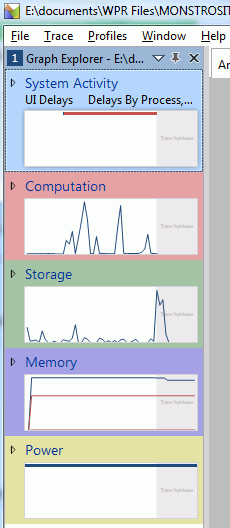
The overview in the sidebar gives usage graphs of our stuff. A curious thing: neither CPU (Computation) nor Storage graphs show intense activity? The plot thickens!

CPU usage investigation

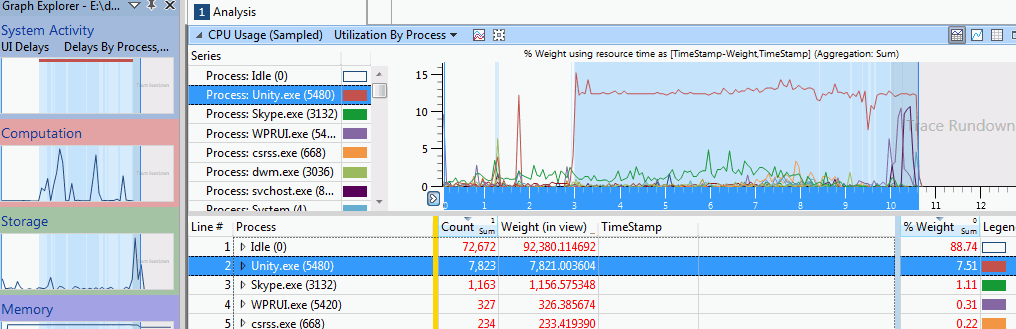
Double clicking the Computation graph shows timeline of CPU usage, with graphs for each process. We can see Unity.exe taking up some CPU during a time period, which the UI nicely highlights for us.

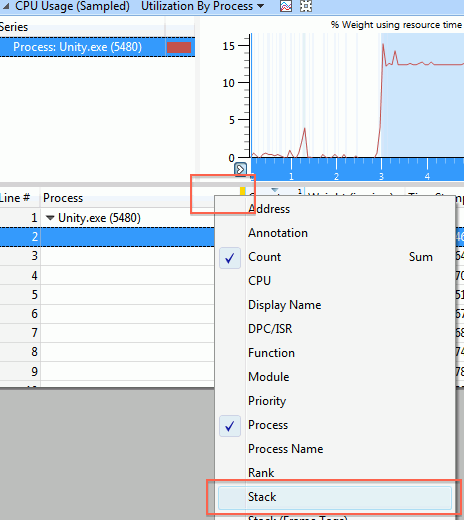
Next thing is, we want to know what is using the CPU. Now, the UI groups things by the columns on the left side of the yellow divider, and displays details for them on the right side of it. We’re interested in a callstack now, so context-click on the left side of the divider, and pick “Stack”:

Oh right, to get any useful stacks we’ll need to tell xperf to load the symbols. So you go Trace -> Configure Symbol Paths, add Unity folder there, and then Trace -> Load Symbols.

And then you wait. And wait some more…

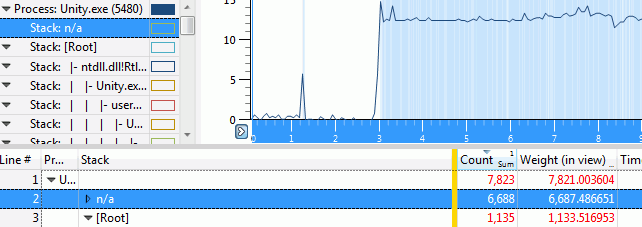
And then you get the callstacks! Not quite sure what the “n/a” entry is; my best guess that just represents unused CPU cores or sleeping threads or something like that.

Digging into the other call stack, we see that indeed, all the time is spent in ReadFile.

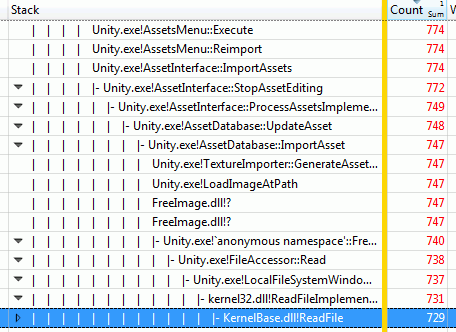
Ok, so that was not terribly useful; we already knew that from the Very Sleepy profiling session.

Let’s look at I/O usage

Remember the “Storage” graph on sidebar that wasn’t showing much activity? Turns out, you can expand it into more graphs.

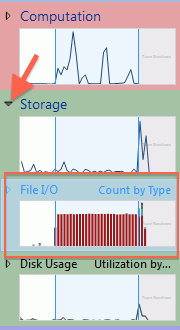
Now we’re getting somewhere! The “File I/O” overview graph shows massive amounts of activity, when we were importing our TGA file. Just need to figure out what’s going on there. Double clicking on that graph in the sidebar gives I/O details:

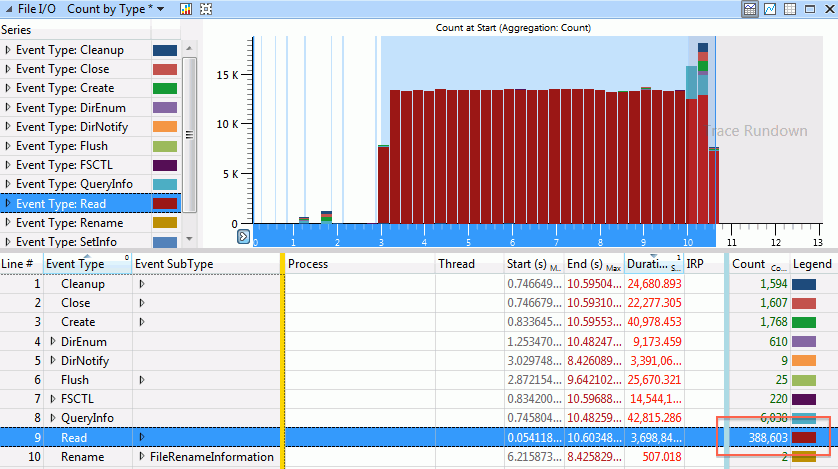
You can probably see where this is going now. We have a lot of file reads, in fact almost 400 thousand of them. That sounds a bit excessive.

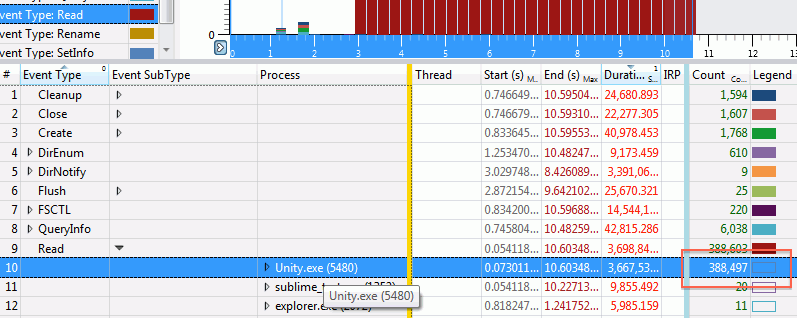
Just like in the CPU part, the UI sorts on columns to the left of the yellow divider. Let’s drag the “Process” column to the left; this shows that all these reads are coming from Unity indeed.

Expanding the actual events reveals the culprit:

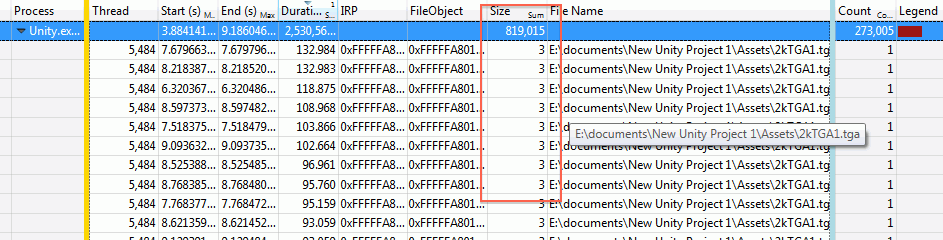
We are reading the file alright. 3 bytes at a time.

But why and how?

But why are we reading a 12 megabyte TGA file in three-byte chunks? No one updated our image reading library in a long time, so how come things have regressed?

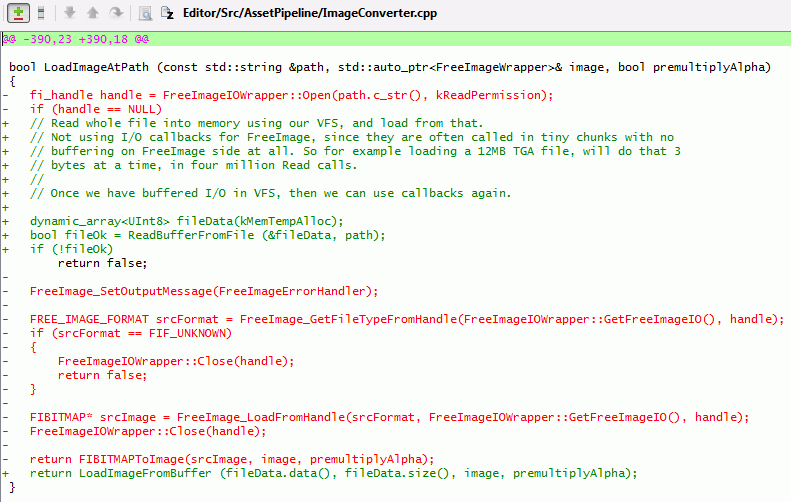
Found the place in code where we’re calling into FreeImage. Looks like we’re setting up our own I/O routines and telling FreeImage to use them:

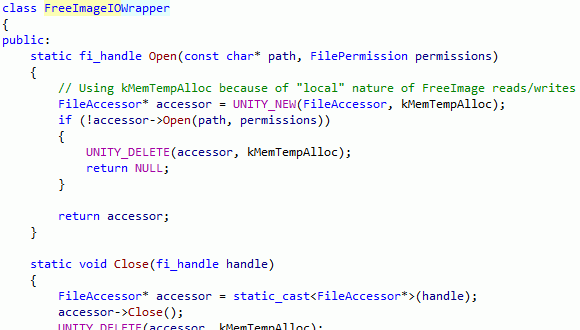
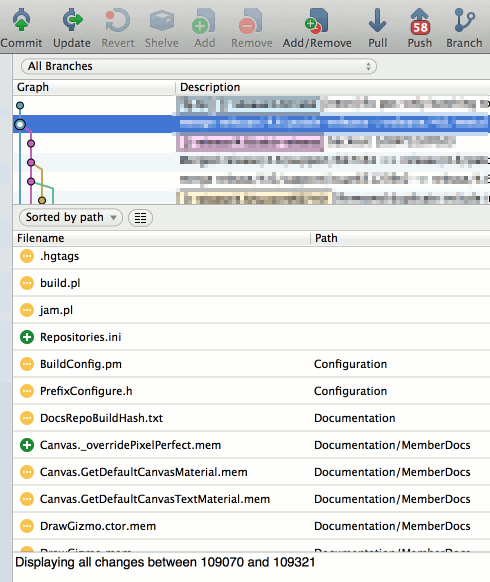
Version control history check: indeed, a few weeks ago a change in that code was made, that switched from basically “hey, load an image from this file path” to “hey, load an image using these I/O callbacks”

This generally makes sense. If we have our own file system functions, it makes sense to use them. That way we can support reading from some non-plain-files (e.g. archives, or compressed files), etc. In this particular case, the change was done to support LZ4 compression in lightmap cache (FreeImage would need to import texture files without knowing that they have LZ4 compression done on top of them).

So all that is good. Except when that changes things to have wildly different performance characteristics, that is.

When you don’t pass file I/O routines to FreeImage, then it uses a “default set”, which is just C stdio ones:

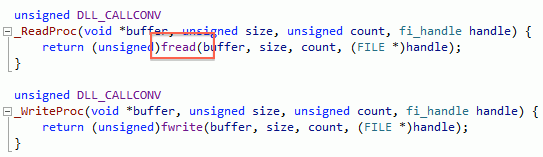
Now, C stdio routines do I/O buffering by default… our I/O routines do not. And FreeImage’s TGA loader does a very large number of one-pixel reads.

To be fair, the “read TGA one pixel at a time” seems to be fixed in upstream FreeImage these days; we’re just using a quite old version. So looking at this bug made me realize how old our version of FreeImage is, and make a note to upgrade it at some point. But not today.

The Fix

So, a proper fix here would be to setup buffered I/O routines for FreeImage to use. Turns out we don’t have any of them at the moment. They aren’t terribly hard to do; I poked the relevant folks to do them.

In the meantime, to check if that was really the culprit, and to not have “well TGAs import much slower”, I just made a hotfix that reads whole image into memory, and then loads from that.

Is it okay to read whole image into memory buffer? Depends. I’d guess in 95% cases it is okay, especially now that Unity editor is 64 bit. Uncompressed data for majority of images will end up being much larger than the file size anyway. Probably the only exception could be .PSD files, where they could have a lot of layers, but we’re only interested in reading the “composited image” file section. So yeah, that’s why I said “hotfix”; and a proper solution would be having buffered I/O routines, and/or upgrading FreeImage.

This actually made TGA and PNG importing faster than before: 75ms for TGA, 87ms for PNG (Unity 4.6: 310ms TGA, 116ms PNG; current beta before the fix: 9800ms TGA, 108ms PNG).

Yay.

Conclusion

Be careful when replacing built-in functionality of something with your own implementation (e.g. standard I/O or memory allocation or logging or … routines of some library). They might have different performance characteristics!

xperf on Windows is very useful! Go and read Bruce Dawson’s blog for way more details.

On Mac, Apple’s Instruments is a similar tool. I think I’ll use that in some next blog entry.

I probably should have guessed that “too many, too small file read calls” is the actual cause after two minutes of looking into the issue. I don’t have a good excuse on why I did not. Oh well, next time I’ll know :)


Divide and Conquer Debugging

It should not be news to anyone that ability to narrow down a problem while debugging is an incredibly useful skill. Yet from time to time, I see people just helplessly randomly stumbling around, when they are trying to debug something. So with this in mind (and also “less tweeting, more blogging!” in mind for 2015), here’s a practical story.

This happened at work yesterday, and is just an ordinary bug investigation. It’s not some complex bug, and investigation was very short - all of it took less time than writing this blog post.

Bug report

We’re adding iOS Metal support to Unity 4.6.x, and one of the beta testers reported this: “iOS Metal renders submeshes incorrectly”. There was a nice project attached that shows the issue very clearly. He has some meshes with multiple materials on them, and the 2nd material parts are displayed in the wrong position.

The scene looks like this in the Unity editor:

But when ran on iOS device, it looks like this:

Not good! Well, at least the bug report is very nice :)

Initial guesses

Since the problematic parts are the second material on each object, and it only happens on the device, then the user’s “iOS Metal renders submeshes incorrectly” guess makes perfect sense (spoiler alert: the problem was elsewhere).

Ok, so what is different between editor (where everything works) and device (where it’s broken)?

  • Metal: device is running Metal, whereas editor is running OpenGL.
  • CPU: device is running on ARM, editor running on Intel.
  • Need to check which shaders are used on these objects; maybe they are something crazy that results in differences.

Some other exotic things might be different, but first let’s take the above.

Initial Cuts

Run the scene on the device using OpenGL ES 2.0 instead. Ha! The issue is still there. Which means Metal is not the culprit at all!

Run it using a slightly older stable Unity version (4.6.1). The issue is not there. Which means it’s some regression somewhere since Unity 4.6.1 and the code we’re based on now. Thankfully that’s only a couple weeks of commits.

We just need to find what regressed, when and why.

Digging Deeper

Let’s look at the frame on the device, using Xcode frame capture.

Hmm. We see that the scene is rendered in two draw calls (whereas it’s really six sub-objects), via Unity’s dynamic batching.

Dynamic batching is a CPU-side optimization we have where small objects using identical rendering state are transformed into world space on the CPU, into a dynamic geometry buffer, and rendered in a single draw call. So this spends some CPU time to transform the vertices, but saves some time on the API/driver side. For very small objects (sprites etc.) this tends to be a win.

Actually, I could have seen that it’s two draw calls in the editor directly, but it did not occur to me to look for that.

Let’s check what happens if we explicitly disable dynamic batching. Ha! The issue is gone.

So by now, what we know is: it’s some recent regression in dynamic batching, that happens on iOS device but not in the editor; and is not Metal related at all.

But it’s not that “all dynamic batching got broken”, because:

  • Half of the bug scene (the pink objects) are dynamic-batched, and they render correctly.
  • We do have automated graphics tests that cover dynamic batching; they run on iOS; and they did not notice any regressions.

Finding It

Since the regression is recent (4.6.1 worked, and was something like three weeks old), I chose to look at everything that changed since that release, and try to guess which changes are dynamic batching related, and could affect iOS but not the editor.

This is like a heuristic step before/instead of doing actual “bisecting the bug”. Unity codebase is large and testing builds isn’t an extremely fast process (mercurial update, build editor, build iOS support, build iOS application, run). If the bug was a regression from a really old Unity version, then I probably would have tried several in-between versions to narrow it down.

I used perhaps the most useful SourceTree feature - you select two changesets, and it shows the full diff between them. So looking at the whole diff was just several clicks away:

A bunch of changes there are immediately “not relevant” - definitely everything documentation related; almost definitely anything editor related; etc.

This one looked like a candidate for investigation (a change in matrix related ARM NEON code):

This one interesting too (a change in dynamic batching criteria):

And this one (a change in dynamic batching ARM NEON code):

I started looking at the last one…

Lo and behold, it had a typo indeed; the {d1[1]} thing was storing the w component of transformed vertex position, instead of z like it’s supposed to!

The code was in the part where dynamic batching is done on vertex positions only, i.e. it was only used on objects with shaders that only need positions (and not normals, texture coordinates etc.). This explains why half of the scene was correct (pink objects use shader that needs normals as well), and why our graphics tests did not catch this (so turns out, they don’t test dynamic batching with position-only shaders).

Fixing It

The fix is literally a one character change:

…and the batching code is getting some more tests.


Importing cubemaps from single images

So this tweet on EXR format in texture pipeline and replies on cubemaps made me write this…

Typically skies or environment maps are authored as regular 2D textures, and then turned into cubemaps at “import time”. There are various cubemap layouts commonly used: lat-long, spheremap, cross-layout etc.

In Unity 4 we had the pipeline where the user had to pick which projection the source image is using. But for Unity 5, ReJ realized that it’s just boring useless work! You can tell these projections apart quite easily by looking at image aspect ratio.

So now we default to “automatic” cubemap projection, which goes like this:

  • If aspect is 4:3 or 3:4, it’s a horizontal or vertical cross layout.
  • If aspect is square, it’s a sphere map.
  • If aspect is 6:1 or 1:6, it’s six cubemap faces in a row or column.
  • If aspect is 1:1.85, it’s a lat-long map.

Now, some images don’t quite match these exact ratios, so the code is doing some heuristics. Actual code looks like this right now:

float longAxis = image.GetWidth();
float shortAxis = image.GetHeight();
bool definitelyNotLatLong = false;
if (longAxis < shortAxis)
{
    Swap (longAxis, shortAxis);
    // images that have height > width are never latlong maps
    definitelyNotLatLong = true;
}

const float aspect = shortAxis / longAxis;
const float probSphere = 1-Abs(aspect - 1.0f);
const float probLatLong = (definitelyNotLatLong) ?
    0 :
    1-Abs(aspect - 1.0f / 1.85f);
const float probCross = 1-Abs(aspect - 3.0f / 4.0f);
const float probLine = 1-Abs(aspect - 1.0f / 6.0f);
if (probSphere > probCross &&
    probSphere > probLine &&
    probSphere > probLatLong)
{
    // sphere map
    return kGenerateSpheremap;
}
if (probLatLong > probCross &&
    probLatLong > probLine)
{
    // lat-long map
    return kGenerateLatLong;
}
if (probCross > probLine)
{
    // cross layout
    return kGenerateCross;
}
// six images in a row
return kGenerateLine;

So that’s it. There’s no point in forcing your artists to paint lat-long maps, and use some external software to convert to cross layout, or something.

Now of course, you can’t just look at image aspect and determine all possible projections out of it. For example, both spheremap and “angular map” are square. But in my experience heuristics like the above are good enough to cover most common use cases (which seem to be: lat-long, cross layout or a sphere map).


US Vacation Report 2014

This April I had a vacation in the USA, so here’s a write up and a bunch of photos. Our trip: 12 days, group of five (myself, my wife, our two kids and my sister), rented a car and drove around. Made the itinerary ourselves; tried to stay out of big cities or hotel chains – used airbnb where possible. For everyone except me, this was the first trip to USA; I actually never did venture outside of conference cities before either.

TL;DR: Grand Canyon and Death Valley are awesome.

Summary of what we wanted:

  • See nature. Grand Canyon, Death Valley, Yosemite, Highway 1 etc. were on the potential list. Decided to skip Yosemite this time.
  • No serious hiking; that’s hard to do with kids and we’re lazy :)

Asking friends, reading the internets (wikitravel, wikipedia, lonely planet, random blogs), came up with a list of “places I’d like to go”. Thanks for everyone on Facebook for telling that my initial plan was way too ambitious. This is what we ended up at:

Flew to Vegas, a couple of round trips from there (to Valley of Fire and Grand Canyon), and then off towards the ocean. Through Death Valley, and then up north to San Francisco. Fly back from there. In total ended up close to 3000 kilometers; a pretty good balance between “want to see lots of stuff” and “gotta always be driving”.

Almost all photos below are my wife’s. Equipment: Canon EOS 70D with Canon 24-70mm f/2.8 L II and Sigma 8-16mm f/4.5-5.6. A couple photos by me, taken with iPhone 4S :)

Day 1: Valley of Fire

Close to Vegas, there’s this amazing formation of red sandstone. It’s fairly big, so that took the whole day. A good short trip for a jetlagged day :)

This is Elephant Rock, if you squint enough:

Day 2: Vegas to Grand Canyon via Route 66

Stela (my 4yo daughter) is a huge fan of Pixar’s Cars, so a short detour though actual Route 66, and the Hackberry General Store was a joy for her.

Yellow Arizona landscapes:

Arrived at Grand Canyon towards the evening, in the South Rim. It is touristy, so we picked a less-central trail (Kaibab Trail). The views are absolutely breathtaking; something that is very hard to tell via photos. The scale is hard to comprehend: heigt from the rim to the bottom is 1.6km!

We walked a bit below the rim on Kaibab Trail. Would be cool to get to the bottom, but that is a full-day hike one way. Some next time.

Day 3: Grand Canyon, and back to Vegas through Hoover Dam

It’s next to impossible to find lodging at the Grand Canyon Village itself (unless you book half a year in advance?), so we slept in Tusayan 10km south. Next morning, went to canyon rim again.

Visited Hoover Dam on the way back to Vegas:

Day 4: Death Valley

Death Valley, lowest and driest place in North America, and hottest place on Earth. This was April, so the temperature was a mild 40°C in the shade :) Death Valley is amazing due to lots and lots of very different geological things close to each other.

Here, Zabriskie Point, a fantastic erosional landscape. If you’re into obscure movies, you might know a film of the same name.

Next up, Devil’s Golf Course, a salt pan. Apparently almost a century ago one guide book had “Only the devil could play golf here” description, and it stuck. Salt crystals are really sharp on these rocks; there are signs advising “do not trip over or you’ll cut yourself”.

Natural Bridge in the mountains right next to it. It was also getting very, very hot.

Badwater Basin, lowest point in North America. Aistė (my wife) walking on pure salt.

Artist’s Palette, with rocks of any color you like.

Remains of a borax mine, Harmony Borax Works:

Mesquite Flat Sand Dunes. They say some scenes from Star Wars were shot here!

Day 5: Death Valley to Pacific

We stayed at Panamint Springs Resort in the Panamint Valley. Tried to catch a sunrise next morning, but it was all cloudy :( Ground here is covered with salt as well:

Leaving Panamint Valley, and through much more green California:

Day 6: San Luis Obispo to Big Sur

Spent a night in San Luis Obispo (lovely little town!), and took the Route 1 up north towards Big Sur.

Turns out, the coast redwoods are quite tall!

Day 7: Big Sur to Santa Cruz

Impressive scenery of ocean and clouds and rocks; and Bixby Creek Bridge.

Jellyfish at Monterey Aquarium:

Big waves and Santa Cruz beach:

Days 8, 9, 10: To San Francisco and there

Rented an apartment in the western side (Sunset District), so that it would be possible to find some parking space :) Moraga Steps and view towards sunset.

Obligatory Golden Gate Bridge.

Muir Woods just north of SF. This is again a redwood park, but much more crowded than Big Sur.

Random places in SF: wall art at Broadway/Columbus, and a block of Lombard Street, “the crookedest street in the world”.

Day 11: back home

A long flight back home. 5AM in the airport :)


Rant about rants about OpenGL

Oh boy, people do talk about state of OpenGL lately! Some exhibits: Joshua Barczak’s “OpenGL is Broken”, Timothy Lottes’ reply on that, Michael Marks’ reply to Timothy’s reply. Or an earlier Rich Geldreich’s “Things that drive me nuts about OpenGL” and again Timothy’s reply.

Edit: Joshua’s followup

In all this talk, one side (the one that says GL is broken) frequently bring up Mantle or Direct3D 12. The other side (the one that says GL is just fine and is indeed better) frequently bring up AZDO (“Almost Zero Driver Overhead”) approaches. There are long twitter and reddit and hackernews threads on all this.

It might seem weird – why OpenGL would get such bashing all of a sudden? But this is much better state than some 7 years ago… Back then almost no one cared about OpenGL at all! If people complain, that at least means they do care!

But you know what, both of these sides are right.

OpenGL has issues

Trying to flat-out deny that would be ignorant. Too many ways to do things; too much legacy; integer names instead of pointer handles; bind-to-edit; poor multi-threading; lack of offline shader compilation; the list goes on – all these are real actual issues. And yes, most or all of these are being worked on, or indeed are fixed if you can use latest GL versions.

These technical issues are important, I think. And no, saying “state changes are expensive? don’t do them” – which much of AZDO advocacy ends up being – is not a real answer IMHO. Yes, moving to “pull data from GPU” model is perhaps the future and is great. Does not mean you can completely ignore CPU side things and pretend inefficiencies do not exist there. CPUs are still great at doing some things!

However, the biggest issue in my view is not a technical one, but a political one. On Windows, out of the box, you do not get an OpenGL driver (but you do get a D3D one for most GPUs). And no, actual people out there do not update their drivers. Ever.

I know that you do. And your technically savvy gamer friends do. But for each one of you, there are 10 people who don’t. We have hardware stats from hundreds of millions of machines; the most popular driver versions on Windows are the ones that ship with the OS.

On Mac, OpenGL is “somewhat behind” (GL 4.1 right now). But in comparison to Windows, it’s a much better practical usage, since GL drivers do come with the OS. And OS updates are free, and somehow Mac users do update their OSes at much faster rate than Windows users do.

I’ve no idea about user behaviour Linux. I know there are binary drivers for NV/AMD (tracking latest GL), and open source for Intel (behind latest GL), and nouveau and gallium etc. But no idea about whether Linux people update drivers, or whether they come with OS etc. So no informed opinion on this particular part from me.

So, on Windows we have the problem that GL drivers aren’t shipped with OS, and that people generally don’t update the OS. How to solve that? Perhaps all of us should try to persuade Microsoft to change this, and ship GL drivers with OS & windows updates. Maybe it’s not as crazy as it sounds these days (hey, no one believed MS would ever support WebGL… but they do! kind of).

On Mac we don’t have that particular problem, but we do have a problem that GL implementation is lagging behind the latest version. How to solve that? Perhaps try to persuade Apple to not lag behind. And/or make such kickass games that the advantage of latest GL tech would be too obvious to ignore (this one is a bit of a chicken-and-egg problem, sure).

OpenGL also has potential

Modern OpenGL does indeed have some crazy-awesome features. Check out AZDO again - that’s a whole new level of thinking there. The combination of persistent mapping, fine-grained fences, bindless resources and multi-draw-indirect does enable building substantially different rendering pipelines.

The extension mechanism is an excellent vehicle for bleeding-edge capability delivery. Bindless and sparse textures, flexible indirect draw, persistent buffer mapping, stencil export and so on – all these things appeared as extensions in OpenGL, long before Direct3D picked them up.

OpenGL is an API that spans the most platforms. On some of them, it is the only API. This is a valuable thing.

This is where I forgot what I wanted to say

I’m not sure where I’m going with this, really. Maybe “make love, instead of fighting over whether OpenGL is good or bad”. It will all be alright in the end. Or something like that.

If you really want OpenGL fixed, perhaps joining Khronos is a good idea. That particular piece is a topic for another rant I guess… We (Unity) are on Khronos but there’s too much bureaucracy for my taste so I just can’t be bothered. Thankfully Christophe often carries the flag.

I’m actually quite happy that Mantle and upcoming DX12 has caused quite a stir of discussions (to be fair PS3’s libGCM was probably the first “modern to the metal” API, but everyone who knows anyting about it can’t say it). Once things shake out, we’ll be left with a better world of graphics APIs. Maybe that will be the world with more than two non-console APIs, who knows. In any case, competition is good!