Daily Pathtracer 12: GPU Buffer-Oriented D3D11
Introduction and index of this series is here.
In the previous post, I changed the CPU path tracer from recursion (depth first) based approach to “buffer based” (breadth first) one. It got slightly slower on PC, and stayed around the same performance on a Mac.
I was curious how a similar approach would work on the GPU. Would it be slower or faster than a “super naïve GPU path tracer” I had before? No idea! Let’s find that out. Maybe we’ll learn something along the way.
Time for another confession: while I “conceptually” know how a GPU works, and have read & heard a lot of material on the topic, I don’t have much “actual” experience in optimizing compute shaders. Last time I was doing “serious” shader optimization was regular vertex/pixel shader workloads, and that was some years ago too. So I surely lack intuition in optimization approaches & experience with available tools! Everything below might be a complete blunder, and/or I might be making wrong conclusions. You’ve been warned!
Current depth-first GPU implementation
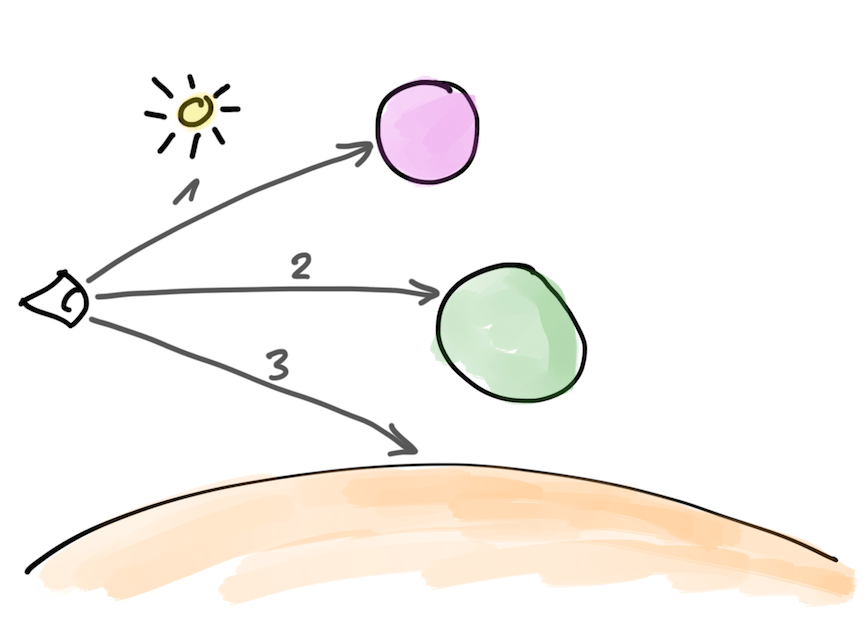
Recall that in my current GPU attempt (see Metal and D3D11 posts), each compute shader invocation maps to one pixel on screen. It traces several “full” ray paths; with rays being scattered off surface hits, extra rays being sent towards light sources, and so on.
Intuitively, while ray execution patterns past the primary eye rays “must be bad” for the GPU (they would be going all over the place, hitting different materials etc.)… It also has a great thing: there’s very little memory traffic. It only needs to read ~50 sphere and material structs, and only needs to write a single color per pixel.
This initial direct GPU version runs at 778 Mray/s on a PC with GeForce GTX 1080 Ti.
Initial buffer-based GPU implementation
Let’s for a moment pretend that GPU compute shader programming model does not have any unique properties or gotchas, and do the “most simple” buffer oriented implementation. It is structured very much like the buffer-oriented CPU implementation:
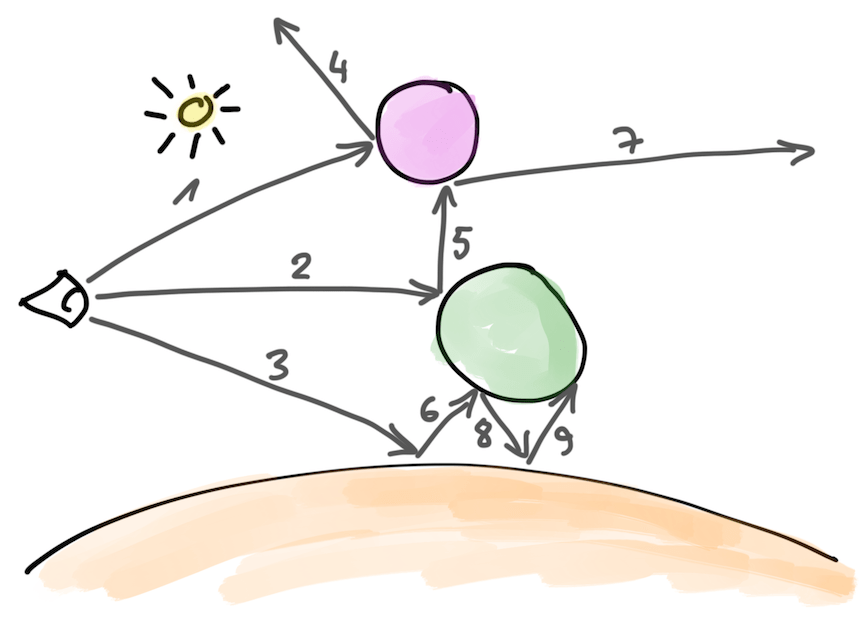
- One compute shader evaluates primary camera rays, and writes out their contribution into the image.
- Primary ray hits can only contribute emissive color in case they hit a light directly, or a sky color in case they don’t hit anything.
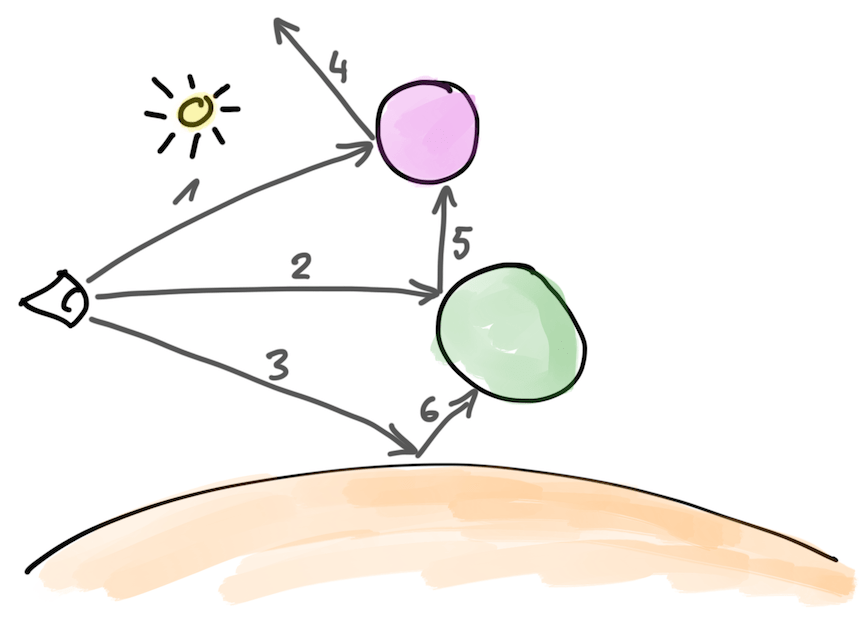
- However, whenever they hit a surface they can produce more rays for the next ray bounce: scattered ray,
or a light sampling (“shadow”) ray. These new rays are appended into a
StructuredBufferwith all the ray data (ray, attenuation so far, pixel location, etc.). Like this:
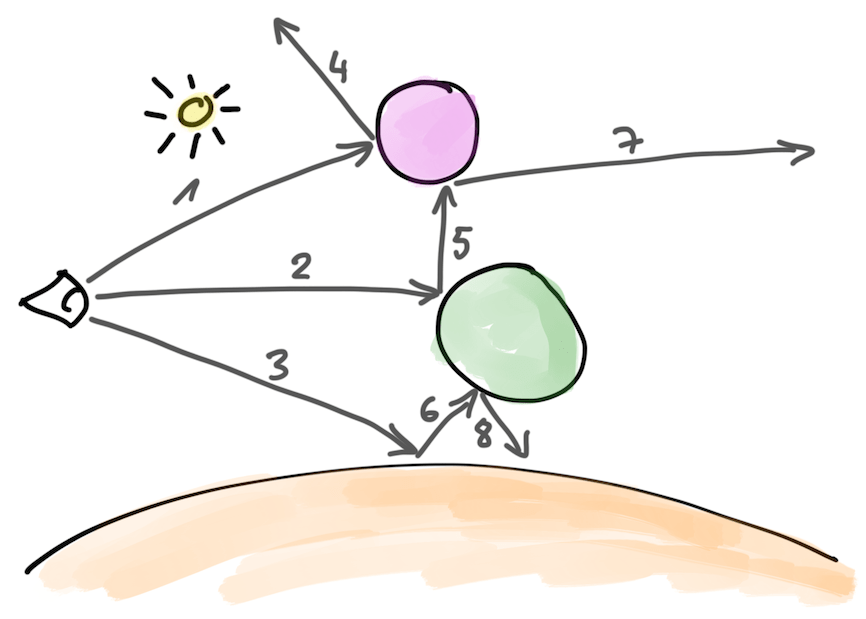
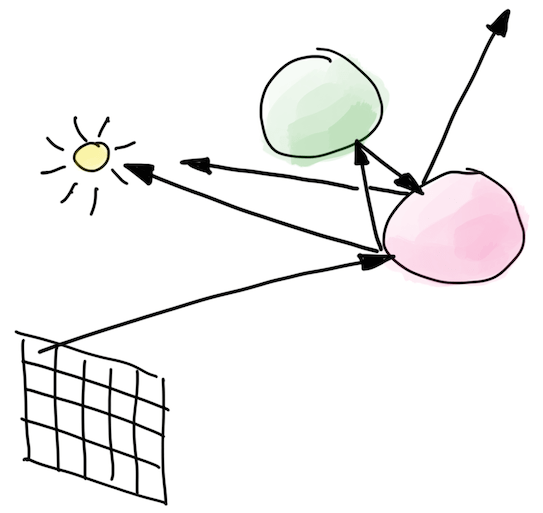
- Next up, I do a number of “bounce” iterations. This does an “indirect” compute shader dispatch (one thread
for each bounce/shadow ray produced in the earlier pass). The compute shader traces these new rays (coming from
a
StructuredBufferproduced earlier), evaluates their own contribution, adds it to the image at ray locations, and each ray surface hit can produce more rays for the next bounce. These new rays are written into anotherStructuredBuffer. Then, repeat this same step again up to N bounce iterations, swapping input & output ray buffers.
This initial commit is here.
Performance: 103 Mray/s (recall that our baseline is 778 Mray/s for the simple depth-first tracer).
༼ ༎ຶ ෴ ༎ຶ༽
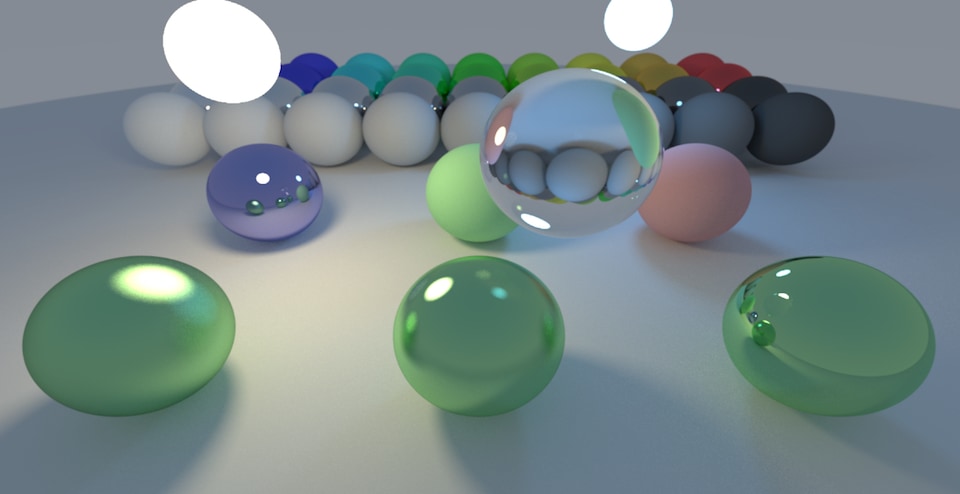
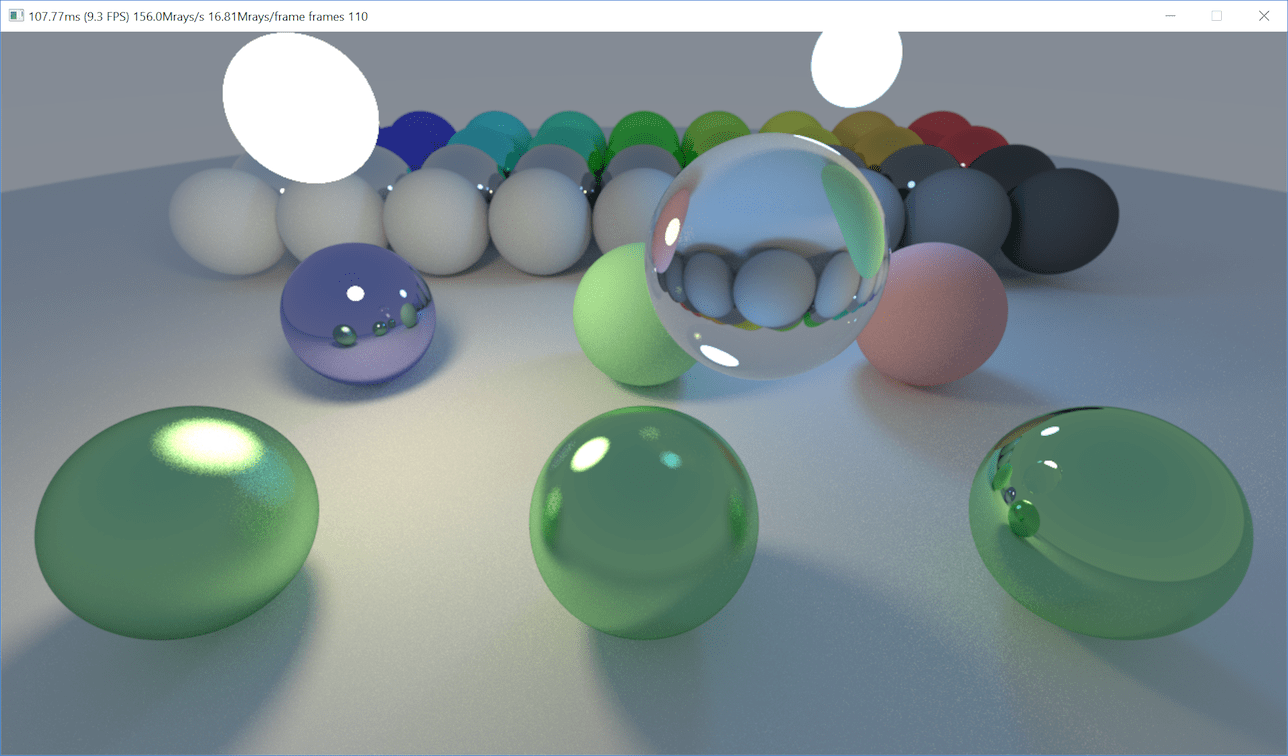
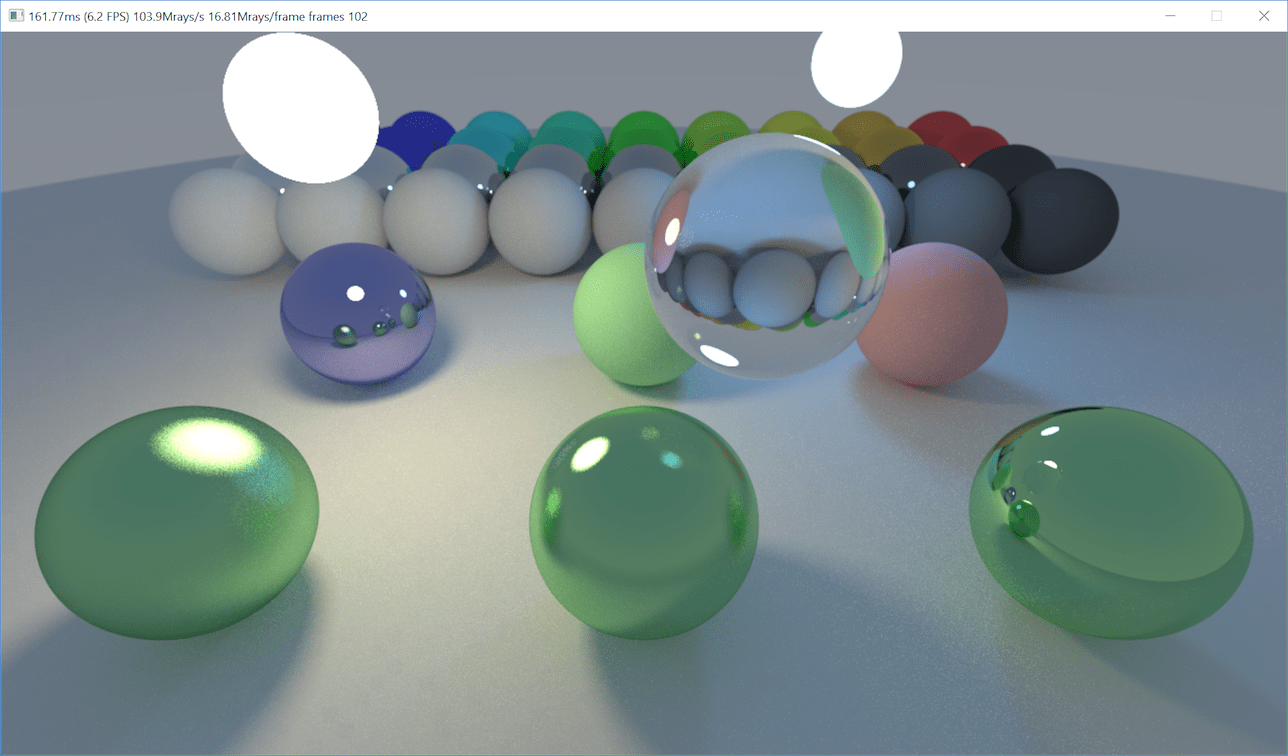
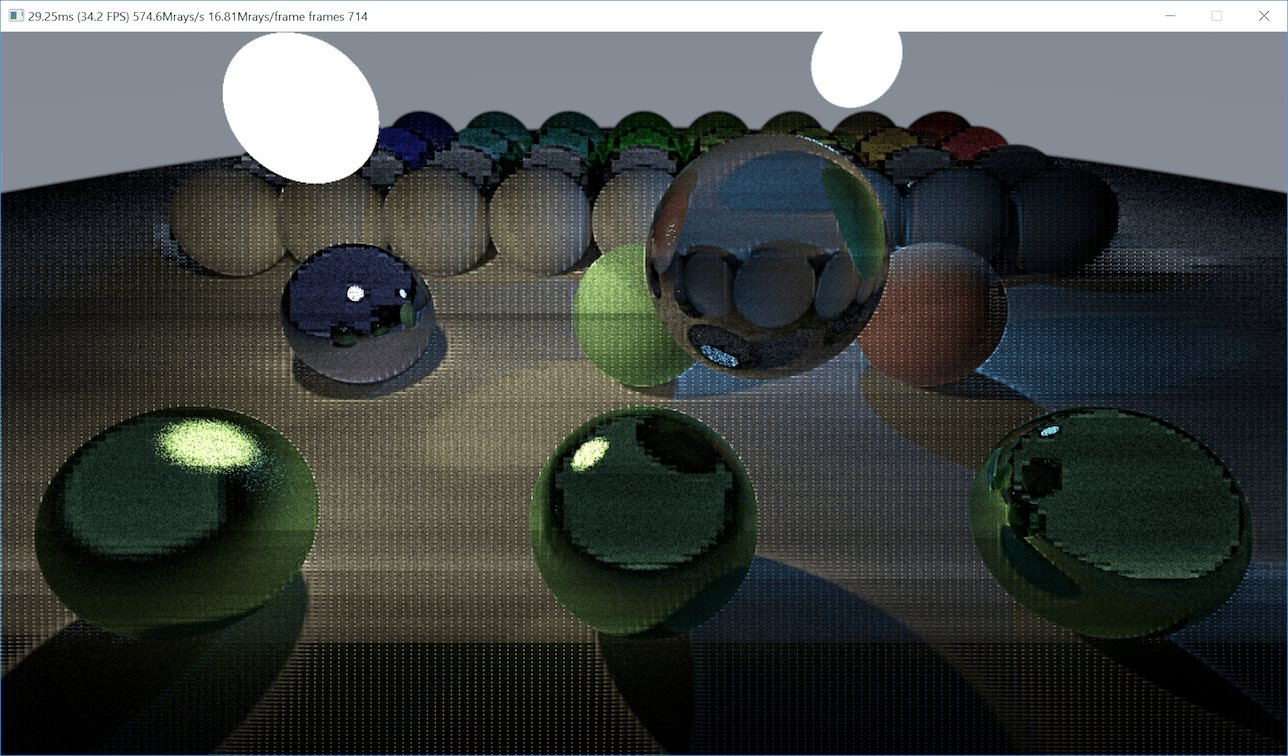
That’s not good at all! Also, it had a subtle lighting difference compared to the CPU implementation, mostly visible on the glass sphere. Here are images: CPU, GPU and increased contrast difference. The difference image revealed some block-like patterns too. Something is not good!
By the way, the “output rays in one CS invocation, then run another CS invocation for that amount of rays” bit is surprisingly non-intuitive, in terms of “ok how to actually do this”. Running a CS on D3D11 requires the user to pass number of thread groups, not number of threads! This basically means that I need to sneak in another tiny compute shader, that only runs on a single element, and all it does is divide a number that’s in one buffer, and write the result into another buffer. Why must simple things be cumbersome?!
Why so slow? Let’s try to find out
I think the recommended way of figuring out why a compute shader is slow, as of first half of 2018, is roughly this:
- Have an implementation for Playstation 4, and use profiling tools there! or,
- Have an implementation for D3D12 or Vulkan, run on an AMD GPU, and use Radeon GPU Profiler there!
That’s just great (not!)… I have a D3D11 implementation, and my GPU is NVIDIA. Let’s see what we have there.
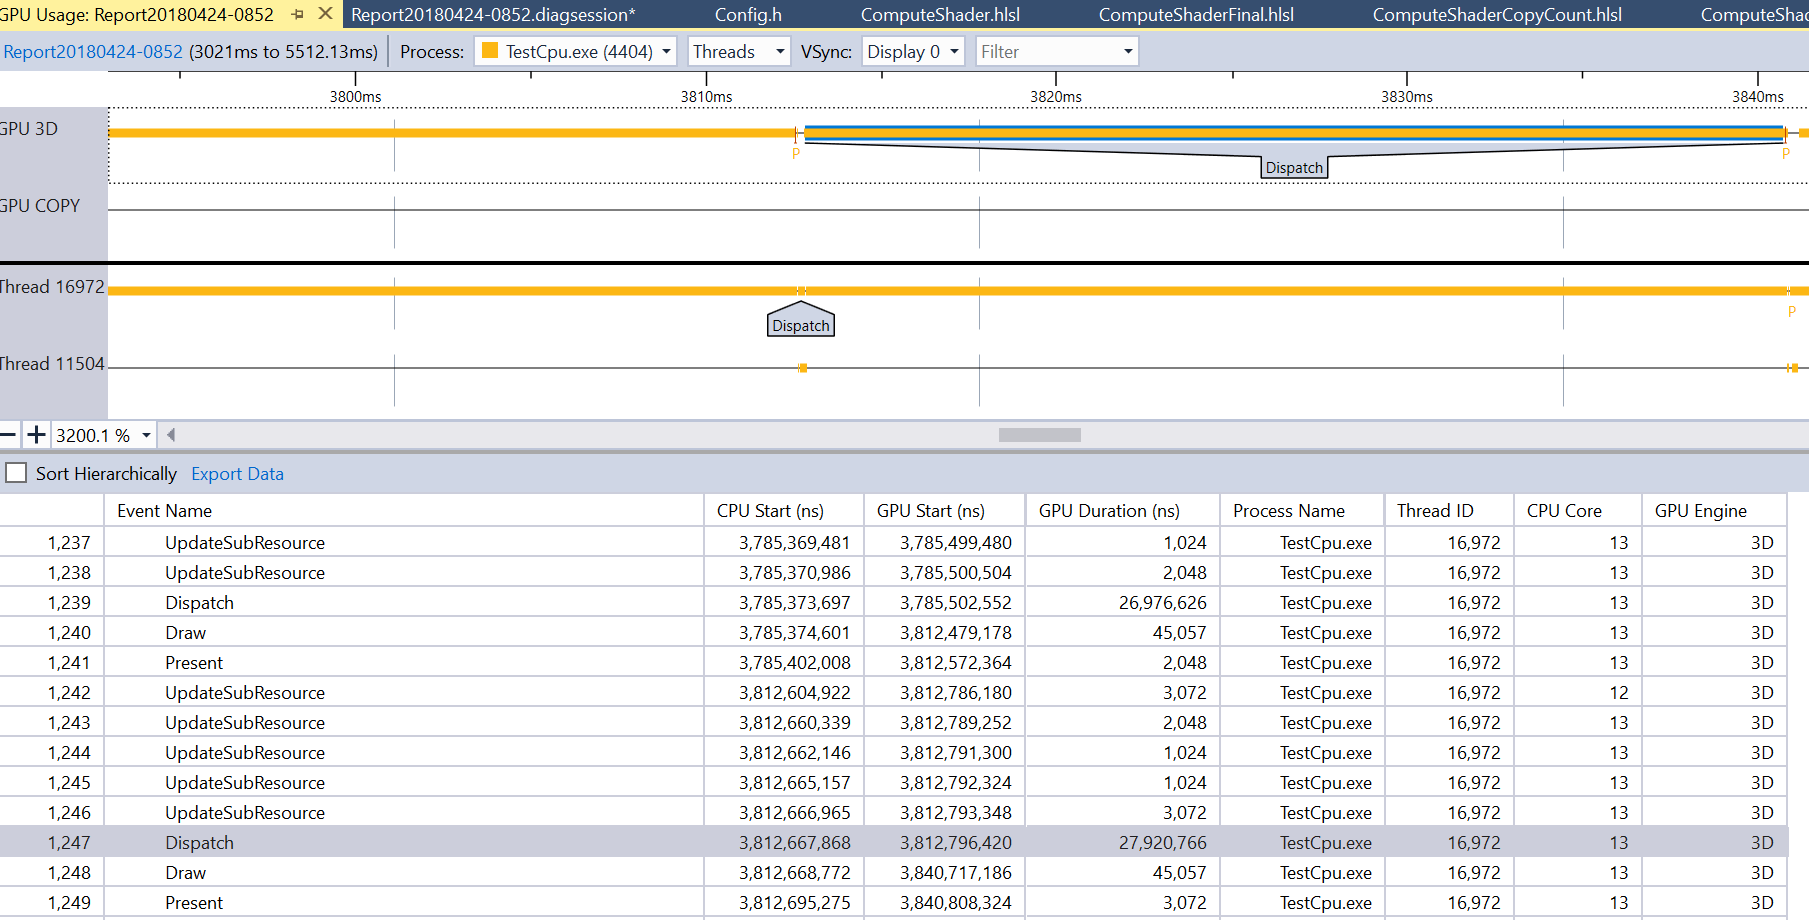
Visual Studio GPU Usage tool
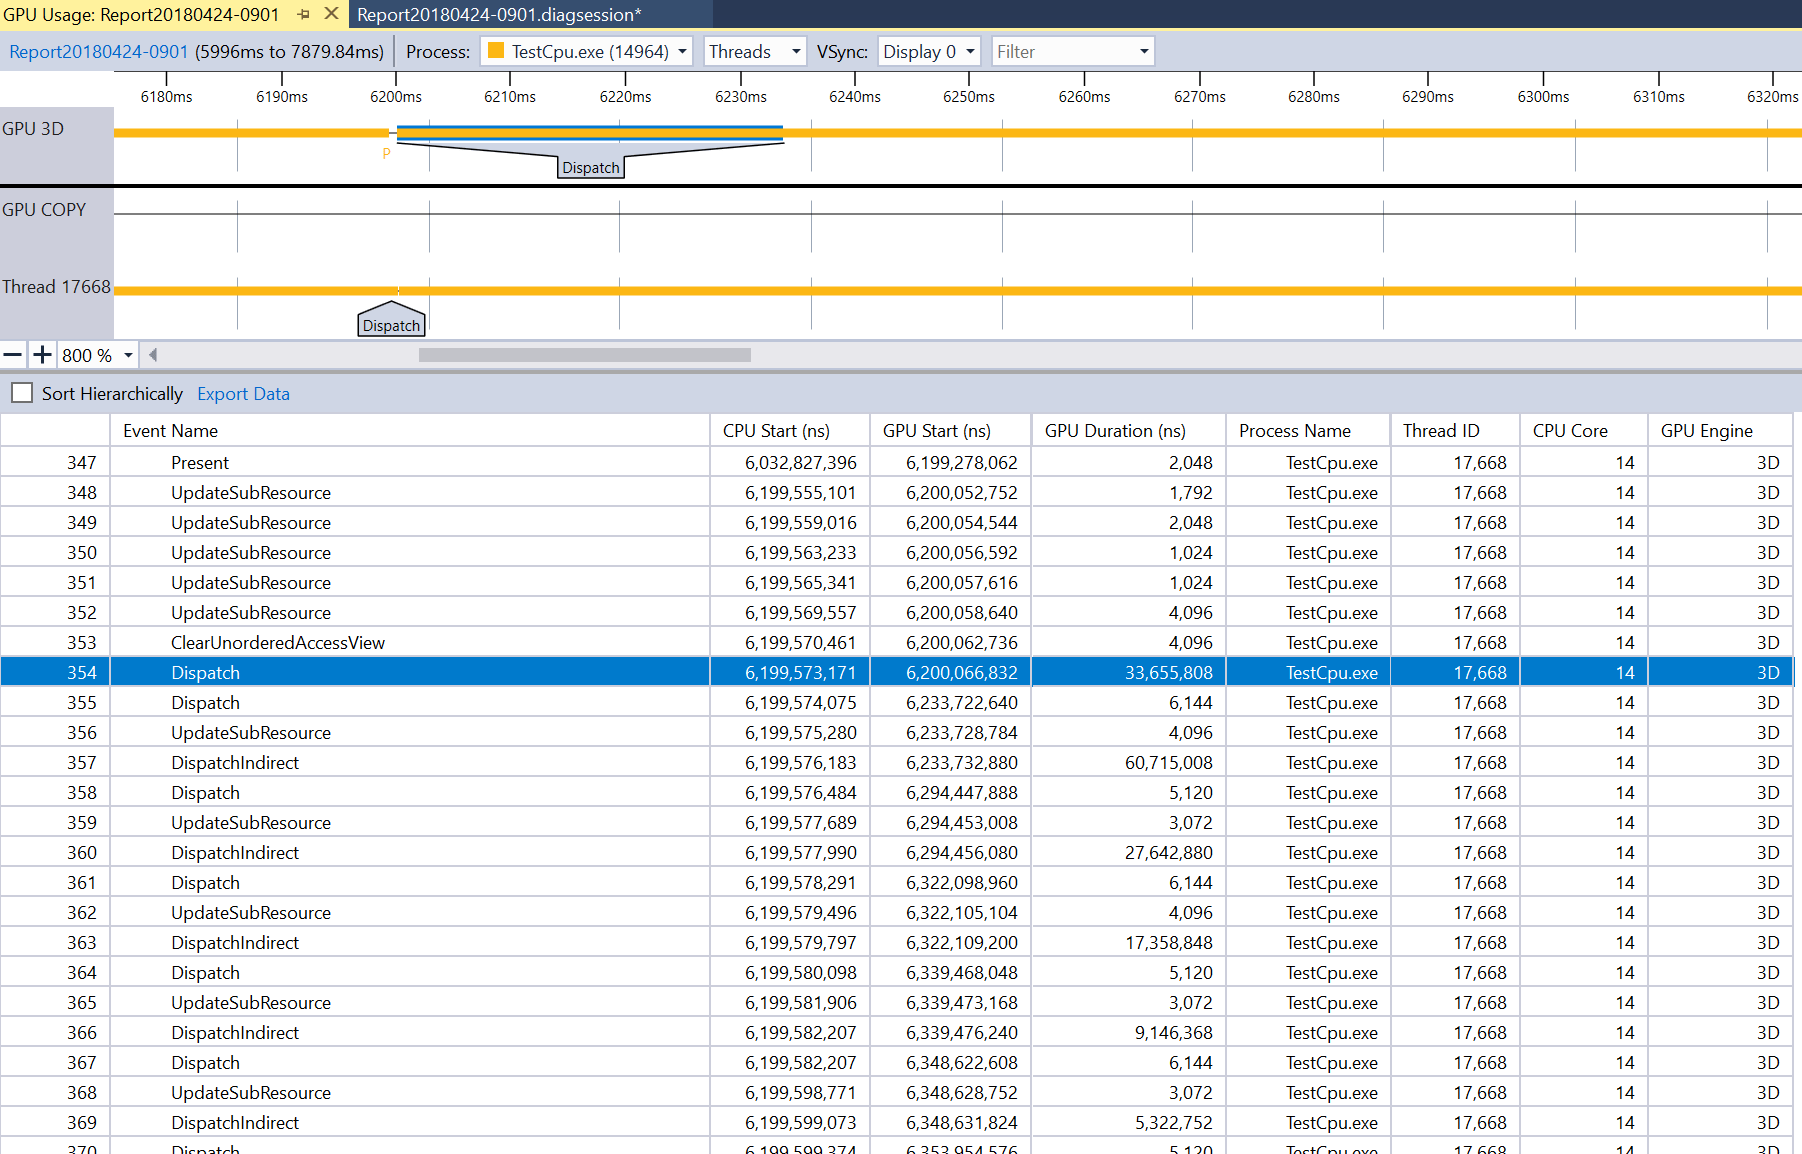
First off, let’s check whether Visual Studio has anything useful. There’s a GPU Usage tool in there. It can tell me that in my “fast” GPU implementation all the time is taken by a compute shader (well duh), and that in my “slow” implementation all the time is taken by these many compute shader dispatches. Ok so that wasn’t very useful in this case.
NVIDIA Nsight Graphics
I have used Nsight in the past, but I frankly forgot what for (might be debugging, might be profiling). Anyhoo, I forgot everything about it, and turns out their current incarnation, Nsight Graphics 1.0, is all different anyway.
Analyzing a frame in Nsight, it tells me this:
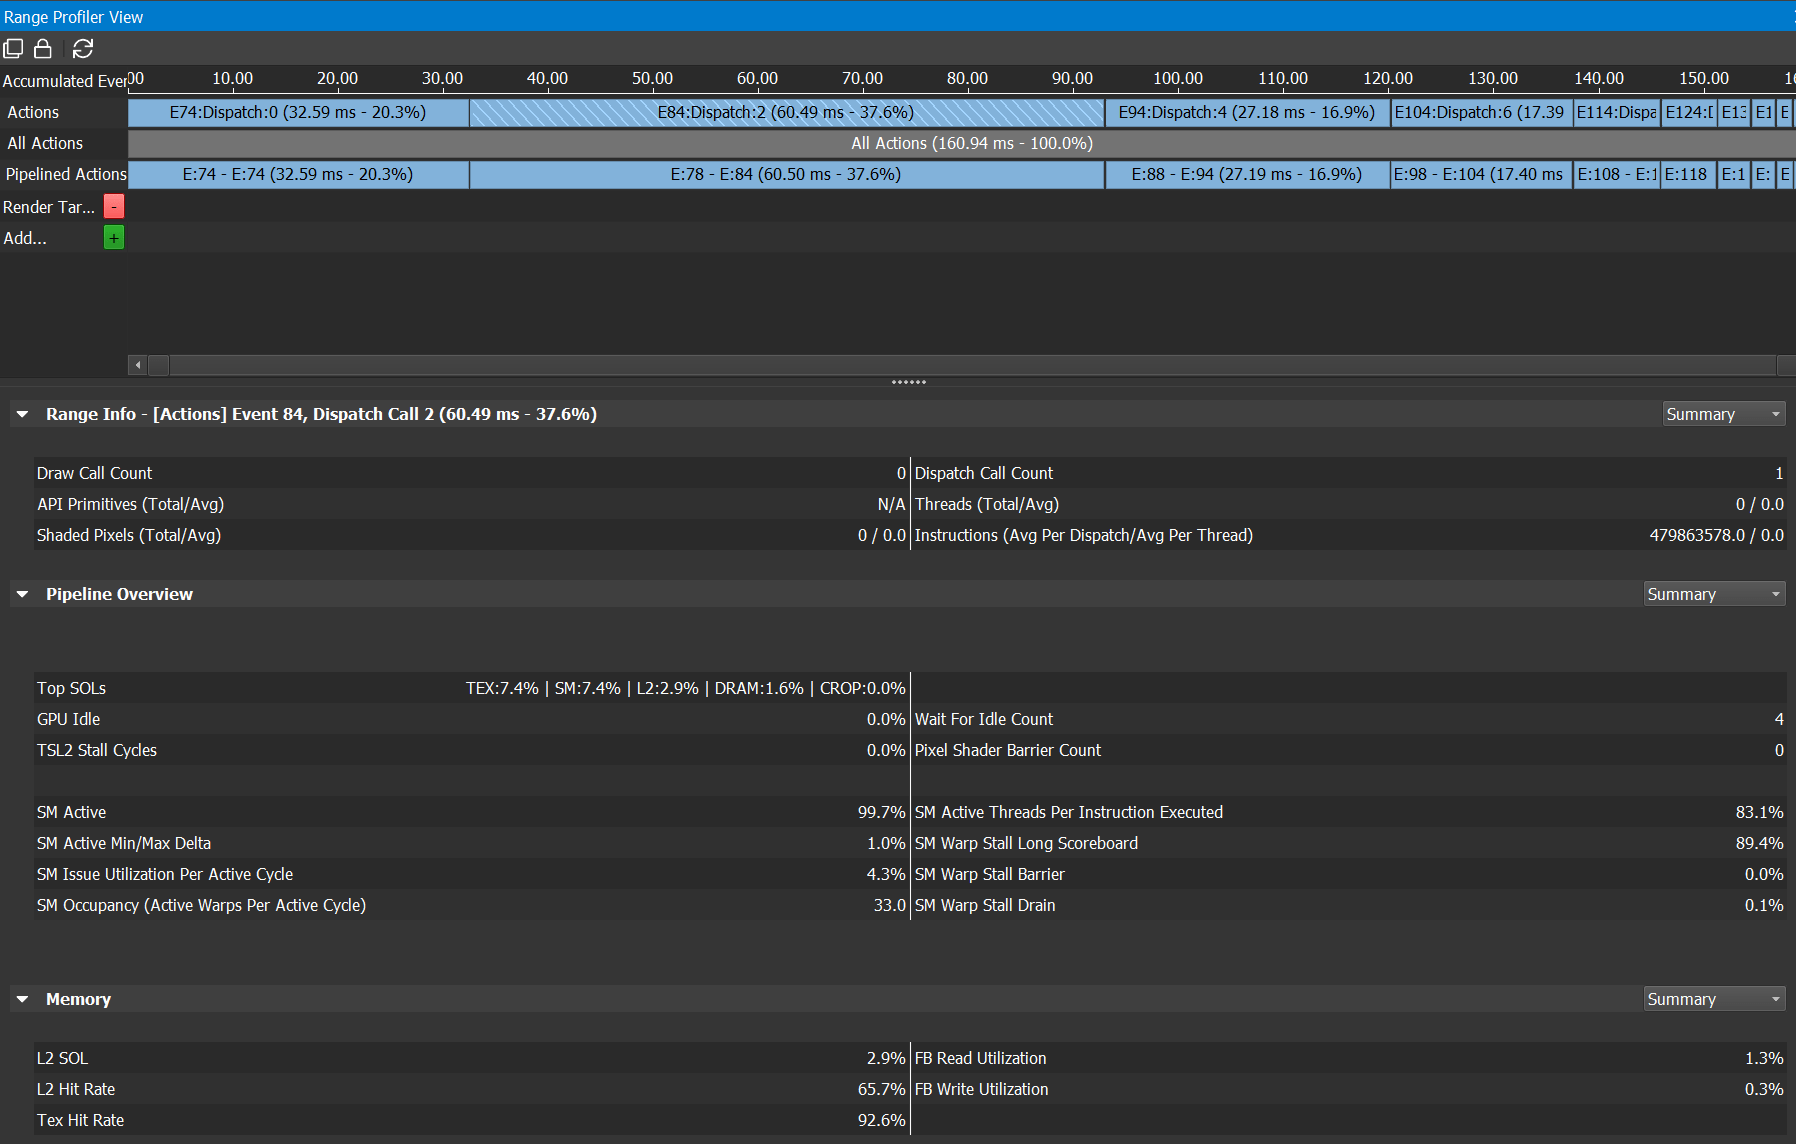
My guess for what all that means is basically this:
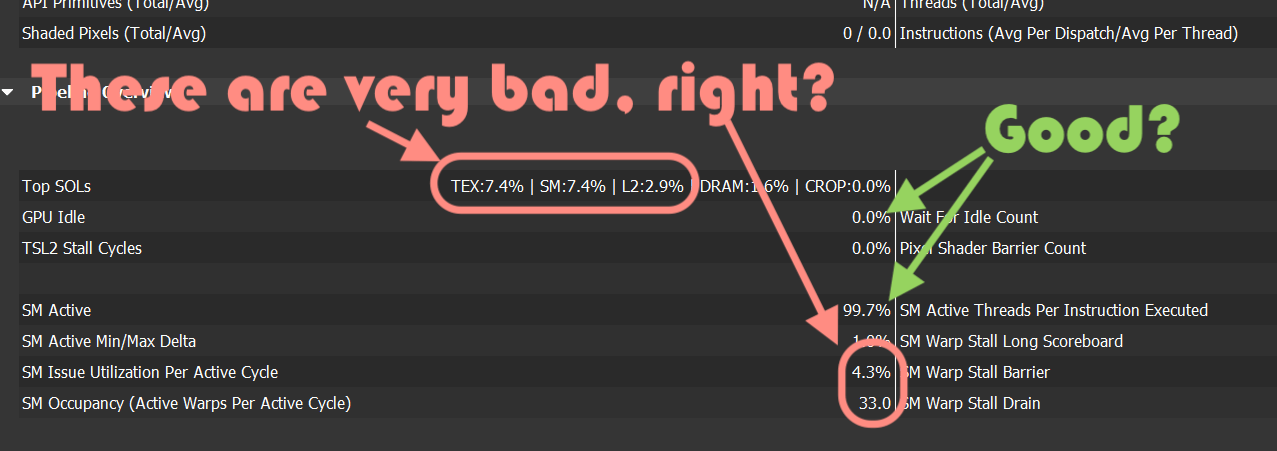
According to NVIDIA blogs, “SOL” in there means “speed of light”, so I think it’s telling me that my compute shader is running at about 7% of what it could run at. That’s obviously super bad! But what to do about it; why is my shader slow? I feel about 90% SOL.
Trying random things to speed it up
Without any of the above tools clearly telling me “hey, this thing in your shader is stupid, go fix it”, I resorted to applying random bits of knowledge I might have accumulated in the past. Which is basically all tweets from Sebastian Aaltonen and random docs from conferences, e.g. DirectCompute Optimizations and Best Practices from GTC 2010, and countless others that are similar.
First up, “avoid atomic operations” sounds like a sensible thing to do. My CS, for each thread, was counting
the number of rays traced (which is only used to display Mray/s figure!), by incrementing a global counter with
an InterlockedAdd function.
Let’s track the amount of rays inside the whole thread group via a groupshared variable, and only do the
global atomic at once per group (commit).
104 -> 125 Mray/s, not bad for such a simple change.
My “process ray bounce” compute shader was operating on 64 rays at once, let’s try tweaking that number. 256 rays in one go turned out to be fastest. Trivial change, 125 -> 147 Mray/s.
Let’s put new rays into group shared memory!
What I had so far mostly does not even need to be a compute shader, since I’m not using about the only feature that makes them worth having in the 1st place – which is “group shared” (aka thread-group local, aka LDS) memory.
Right now whenever any thread in my compute shader needs to emit a new ray for next bounce pass, it does
an atomic increment of a global ray counter, and writes the new ray into a StructuredBuffer. Let’s instead do this:
- Have a ray buffer for the whole thread group in
groupsharedmemory. - New rays are appended into that buffer (this still uses atomics, but they are on a thread group local variable),
- Once whole thread group is done, write it into the structured buffer with one global atomic operation and a bunch of memory copies.
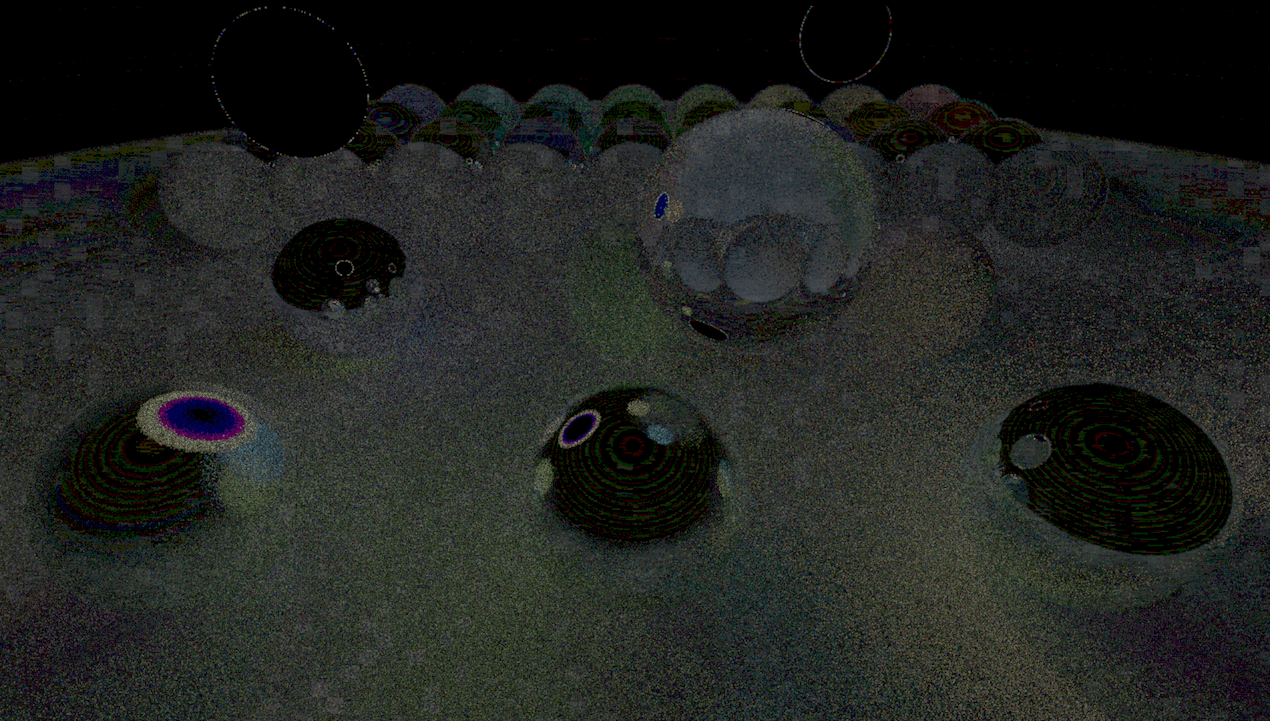
I did the above, basically going like this,
and this was the result…
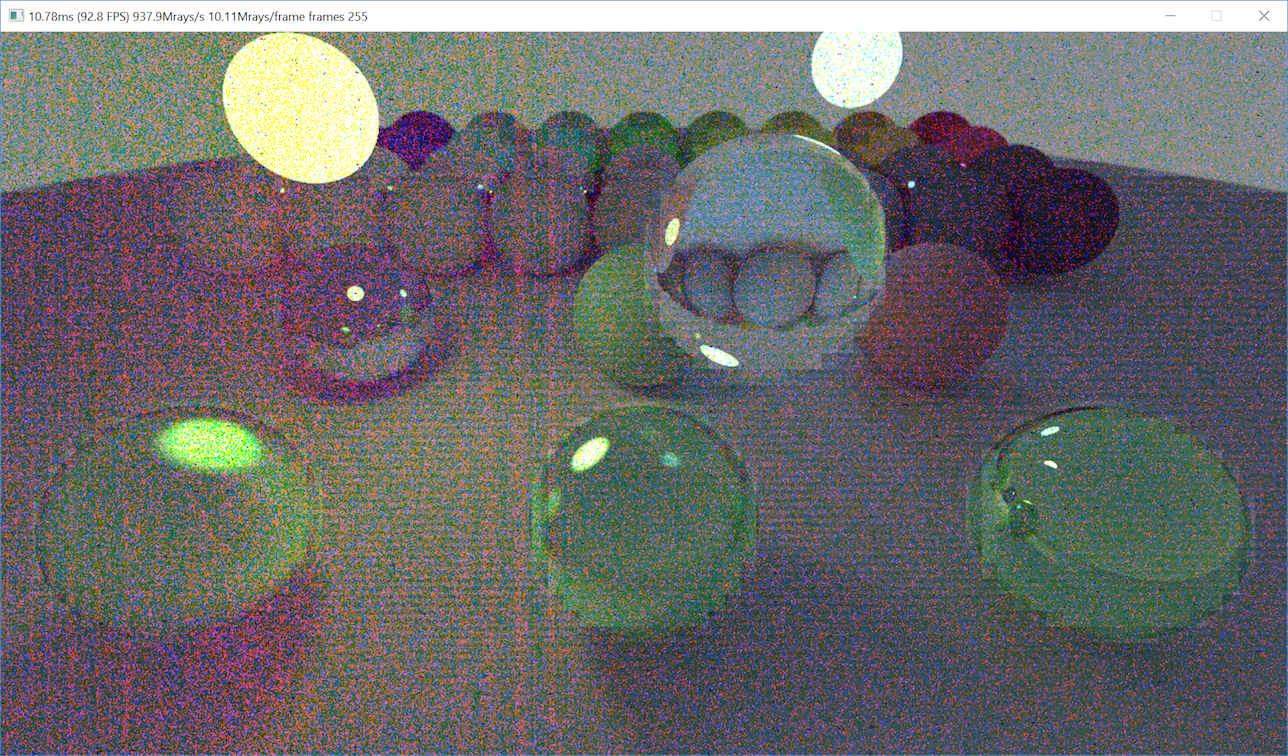
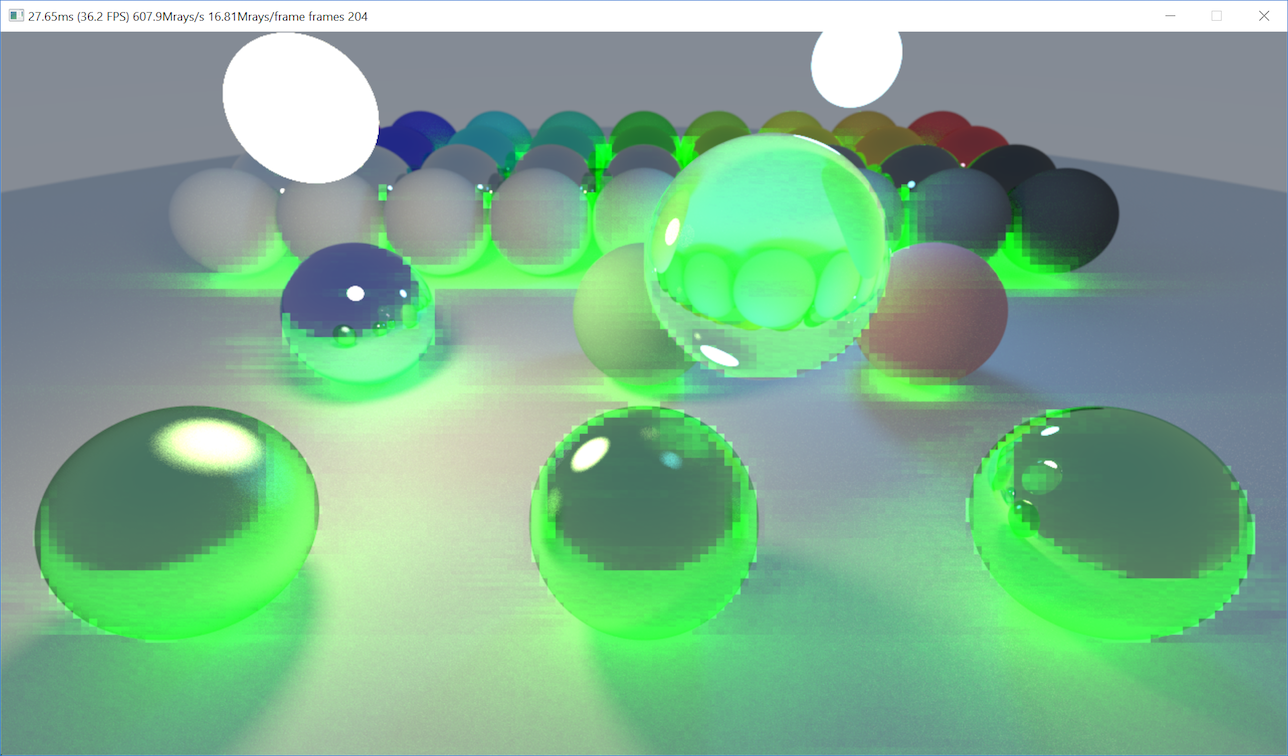
…it’s running quite fast at 937 Mray/s though, shipit :)
Let’s fix rendering
Recall how my “initial attempt” was also subtly different from the CPU rendering, sometimes in block-like artifacts?
Turns out, I was doing a “wrong thing”, in this bit of compute shader that processes a bounce iteration:
The compute shader traces these new rays, evaluates their own contribution, adds it to the image at ray locations
The actual code is dstImage[pixelCoord] += ... bits around here.
In this compute shader, each execution thread no longer maps to a completely separate pixel on screen! They just
grab a bunch of rays to process, each with their own pixel location. It can (and often does) end up, that several
threads at once process rays that hit the same pixel (think shadow & regular bounce ray for the same pixel; and also
I run at 4 rays per pixel to get anti-aliasing…).
The dstImage[pixelCoord] += bit is not atomic at all, and presumably by optimizing the compute shader to be faster,
the execution pattern of it started to be very different from before, and what was “subtle errors” turned into
“whoa random garbage” now. Or that was my theory, which I haven’t 100% double checked :)
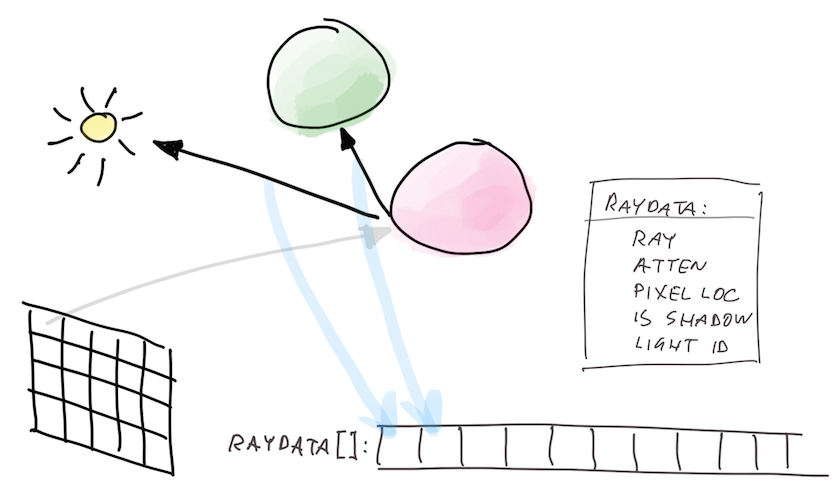
It seems that there’s no easy way to do atomic additions to floats on the GPU. You could implement that manually by doing a loop with an atomic compare/exchange, and maybe there are some GPU-specific shader extensions that for example would allow doing that for half-precision floats or somesuch. All that is “uhh sounds hard” in my book, so I decided to solve this problem by (mis)using the GPU rasterizer.
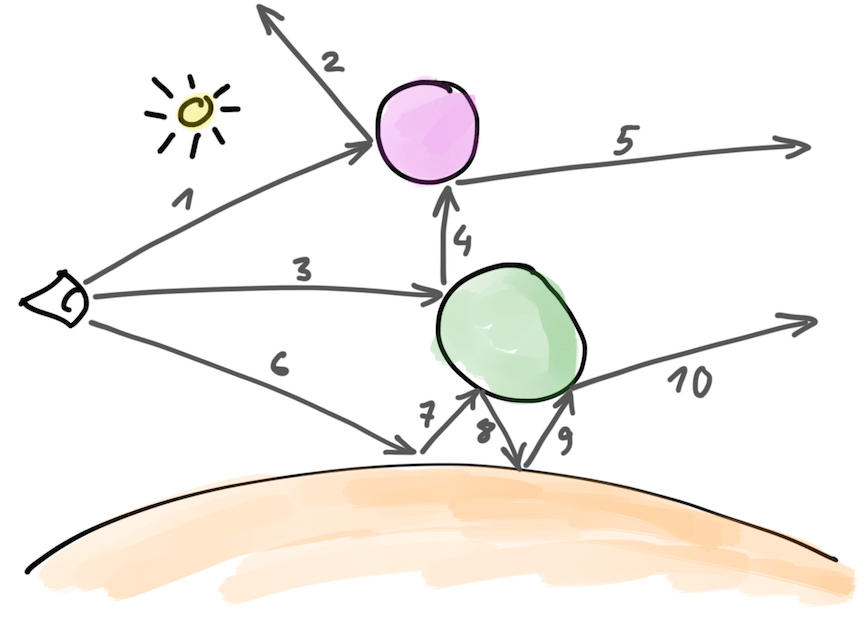
GPU rasterizer has a blending unit that can blend a lot of things, even if they hit the same locations on screen, and the results come out correctly! So in the bounce-processing compute shader, I don’t write anything into the output image; the shader only produces rays for the next bounce, and “splats” (pixel location + color) for the rasterizer to render later. The splats are also added into a buffer, which is then later on rendered as points.
Here’s a diagram that probably makes it even more confusing :)
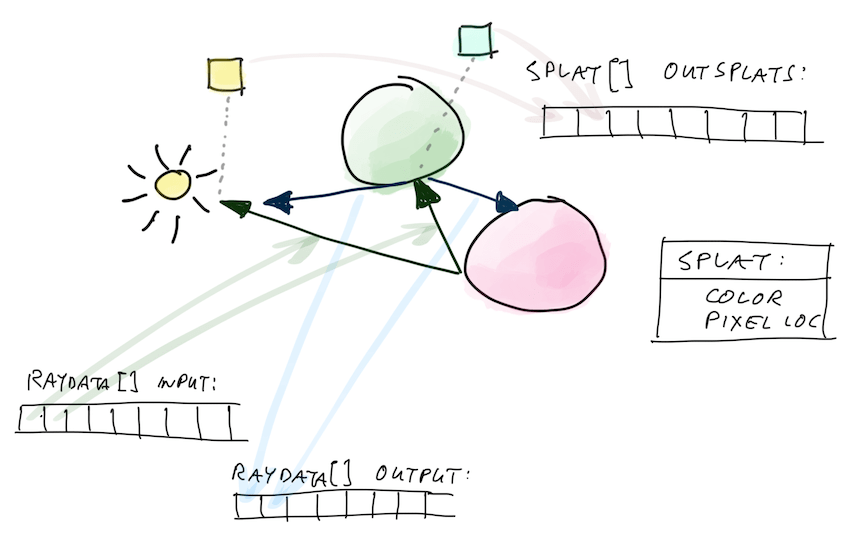
That fixed rendering to be correct though!
Ok what’s the performance now?
Doing the above (put rays & splats into groupshared memory, write to global buffers at end of group; blend splats
using the rasterizer – see commit)
got performance up from 147 to 611 Mray/s. I guess Yoda was not joking in that “LDS we must use” quote.
A couple more commits later I changed how I append items from group-local buffers into the global ones. I had this before:
groupshared s_Data[kSize];
groupshared uint s_DataCount;

// set count to zero at start
if (threadID == 0)
	s_DataCount = 0;
GroupMemoryBarrierWithGroupSync();

// each thread computes some data and adds it:
uint index;
InterlockedAdd(s_DataCount, 1, index);
s_Data[index] = ThisNewData;

// at the end, make first thread write out to global buffer:
GroupMemoryBarrierWithGroupSync();
if (threadID == 0)
{
	uint dataStart;
	g_DataCounts.InterlockedAdd(kCounterOffset, s_DataCount, dataStart);
	for (uint i = 0; i < s_DataCount; ++i)
	{
		g_Data[dataStart + i] = s_Data[i];
	}
}
this works, but only one thread in the whole group ends up doing “copy into global buffer” work. Doing this instead was quite a bit faster:
groupshared s_Data[kSize];
groupshared uint s_DataCount;
groupshared uint s_DataStart;

// set count to zero at start
if (threadID == 0)
	s_DataCount = 0;
GroupMemoryBarrierWithGroupSync();

// each thread computes some data and adds it:
uint index;
InterlockedAdd(s_DataCount, 1, index);
s_Data[index] = ThisNewData;

// at the end, make first thread reserve space in global buffer and
// find where it starts:
GroupMemoryBarrierWithGroupSync();
if (threadID == 0)
{
	g_DataCounts.InterlockedAdd(kCounterOffset, s_DataCount, s_DataStart);
}

// threads in the whole group copy their portion
uint myCount = (s_DataCount + kCSGroupSize - 1) / kCSGroupSize;
uint myStart = threadID * myCount;
for (uint i = myStart; i < myStart + myCount; ++i)
	if (i < s_DataCount)
		g_Data[s_DataStart + i] = s_Data[i];
Doing the above change for how rays are copied, and how splats are copied, increased performance from 619 to 644 Mray/s.
What else could be done?
So… 644 Mray/s is still behind the “super simple direct port” that I had running at 778 Mray/s…
Some completely random guesses on what else could be done to speed up the current “put rays/splats for whole bounce into a buffer” approach:
- The compute shaders use a lot of space in
groupsharedmemory right now: they have to have enough space to store the maximum amount of rays & splats that might get produced by the whole group! Large amount of groupshared space means the GPU can only run a very limited amount of groups at once, which is quite bad. Read more at “Optimizing GPU occupancy and resource usage with large thread groups”.
- I could compress my ray & splat data more, to take up less space. My ray data right now is
28 bytes
(
float3position,half3direction,half3attenuation,uintfor pixel location, light index and other flags); and splat data is 16 bytes (float3color,uintpixel location). Ray direction could use less space (e.g. 16 bit integers for X&Y components, one bit for sign of Z); attenuations & colors could be packed into smaller space than FP16 (R11G11B10 float, or RGB9E5, or RGBM, etc.). Ray position might be ok with less data than full FP32 float too. - Maybe there’s no need to store “maximum possible space” for the whole thread group, and instead have a buffer of fixed size, and write it out whenever it’s filled up.
- I could compress my ray & splat data more, to take up less space. My ray data right now is
28 bytes
(
- The “some threads possibly append into a local buffer” pattern seems to generally be called “stream compaction”,
and is a candidate for using “wave-level operations”. Sadly there’s no easy or cross-platform way of doing
these in D3D11.
- D3D12 shader model 6.0 has wave intrinsics, but that requires using D3D12, and also using the new DXC shader compiler.
- AMD has extensions to get to them in D3D11, see this or that post.
- NVIDIA also has extensions for D3D11, see this or that post.
- …I don’t want to be writing separate compute shaders for different GPUs just yet though.
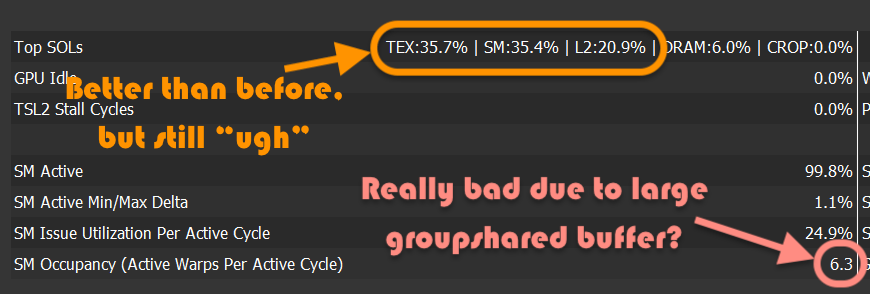
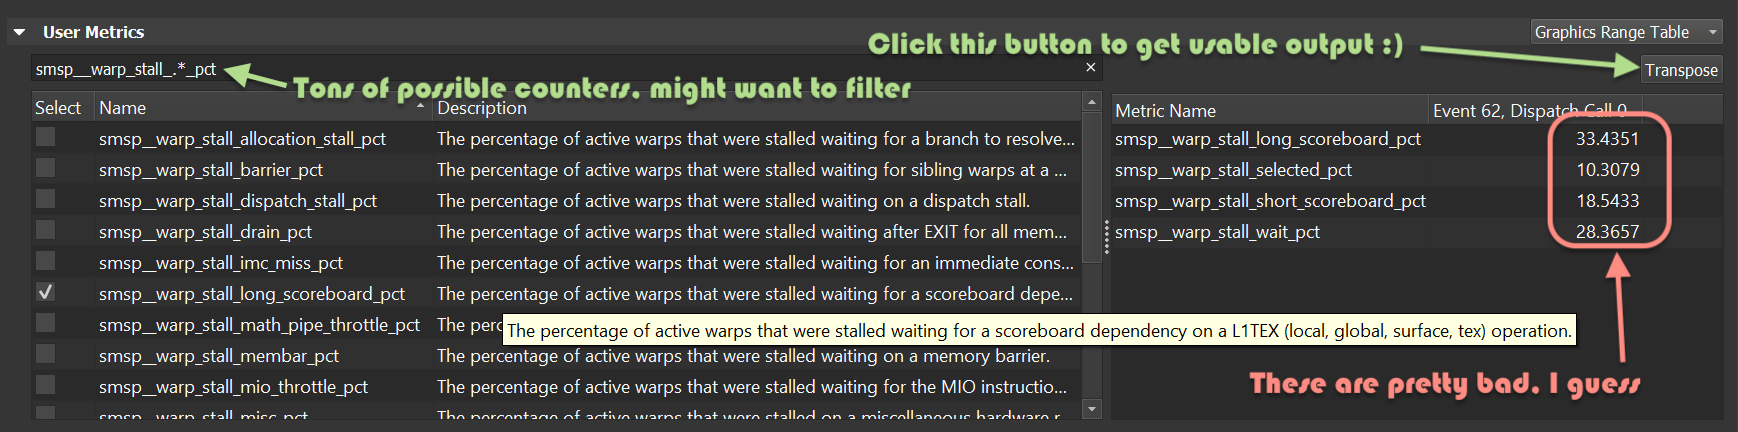
- Turns out that Nsight does have a lot of possibly useful counters, besides these “SOL” numbers (thanks
Nathan Hoobler for the tip). Have to select them
under “User Metrics” section, and of course good luck figuring out which ones of them are actually interesting :)
The “GPU Trace” feature mentioned on Nsight website looks potentially useful too, but is not available yet at the time of writing. - It’s also entirely possible that this whole approach is nonsense and can never be fast anyway!
Current status and what’s next
So, I tried a buffer-oriented approach on the GPU (current code at 12-gpu-buffer-d3d11 tag),
and learned a few things:
- Compute shader optimization feels like extremely beginner-unfriendly area. I’m somewhat versed in that whole space
and could even pass a Turing test in a graphics related conversation, yet still a lot of the information
sounds either complicated, or is hard to find in a nicely summarized form.
- Tools that present you with a sea of numbers don’t help the impression either.
- Looking at responses I got on twitter, seems that I’m not alone in this, so phew, it’s not just me.
- Apparently, using a PS4 or AMD on D3D12/Vulkan for compute shader optimization is the way to go :)
- Global atomics are slow.
- Using large amounts of group shared memory is slow (but can be faster than not using it at all).
- There’s a reason why
UnorderedAccessViewin D3D terms has “unordered” in the name. Writes into them can and will come out in unpredictable order! I had to resort to rasterizer’s blend unit to write out my “ray splats”. Doing “wrong” things can produce some “accidental noise art” though!
- What I got out of everything above so far is 644 Mray/s on GeForce 1080 Ti, which is a lot more complexity than the “stupidly simple” approach, and slower too :(
What’s next? I don’t know, we’ll see. Until next time!