Looks like I’ve been working at Unity for 14 years. What?!?! So here’s another blog post that looks
at the past without presenting any useful information, similar to the ones from two,
four, ten,
eleven years.
A year ago I wrote how I started mentoring
several juniors at work, and then how I’ve spent two years on
the build system team.
What happened next is that I somehow managed to convince others (or someone else has convinced me – it’s a blur)
that I should stop being on the build system team, “steal” the juniors I was mentoring and create a whole new team.
And so one thing led to another, and I ended up leading/managing a whole new 8-person team, with most of us being
in Unity Kaunas office. Due to lack of imagination, this was simply called
a “Core Kaunas” team.
We spent most of 2019 focusing on improving version control (mostly Perforce) integration in Unity – fixing bugs,
improving integration UI/UX, fixing lots of cases of versioned files being written to disk for no good reason
(which under Perforce causes a checkout), and so on. See release notes items starting with “Version Control” in
2019.3 release notes for an example. Most of that work ships in 2019.3,
some in 2020.1, some was backported all the way back to 2018.4 LTS. Most of what we did was either
reported bugs / feature requests by users, or things coming from our own internal production(s), that for the first time
ever used Perforce (on purpose! so that we could see the issues with our own eyes).
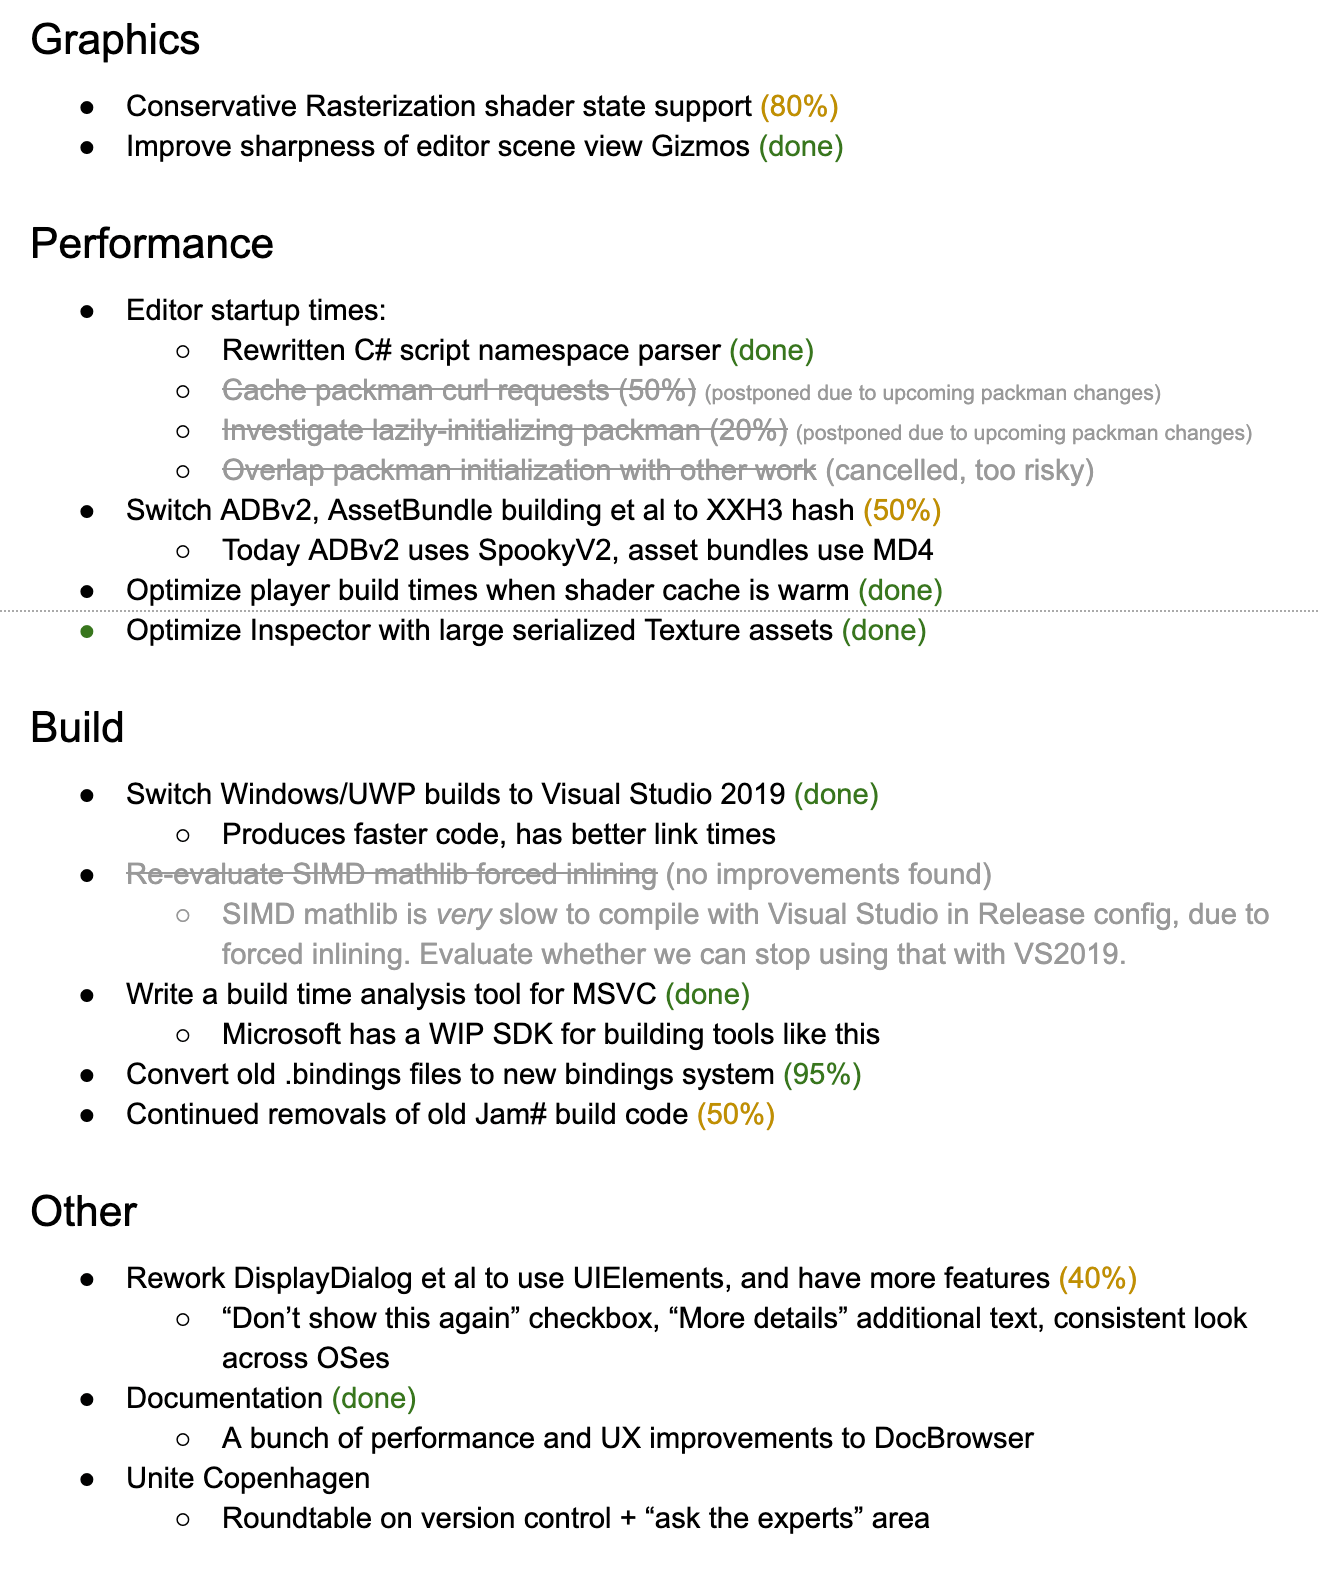
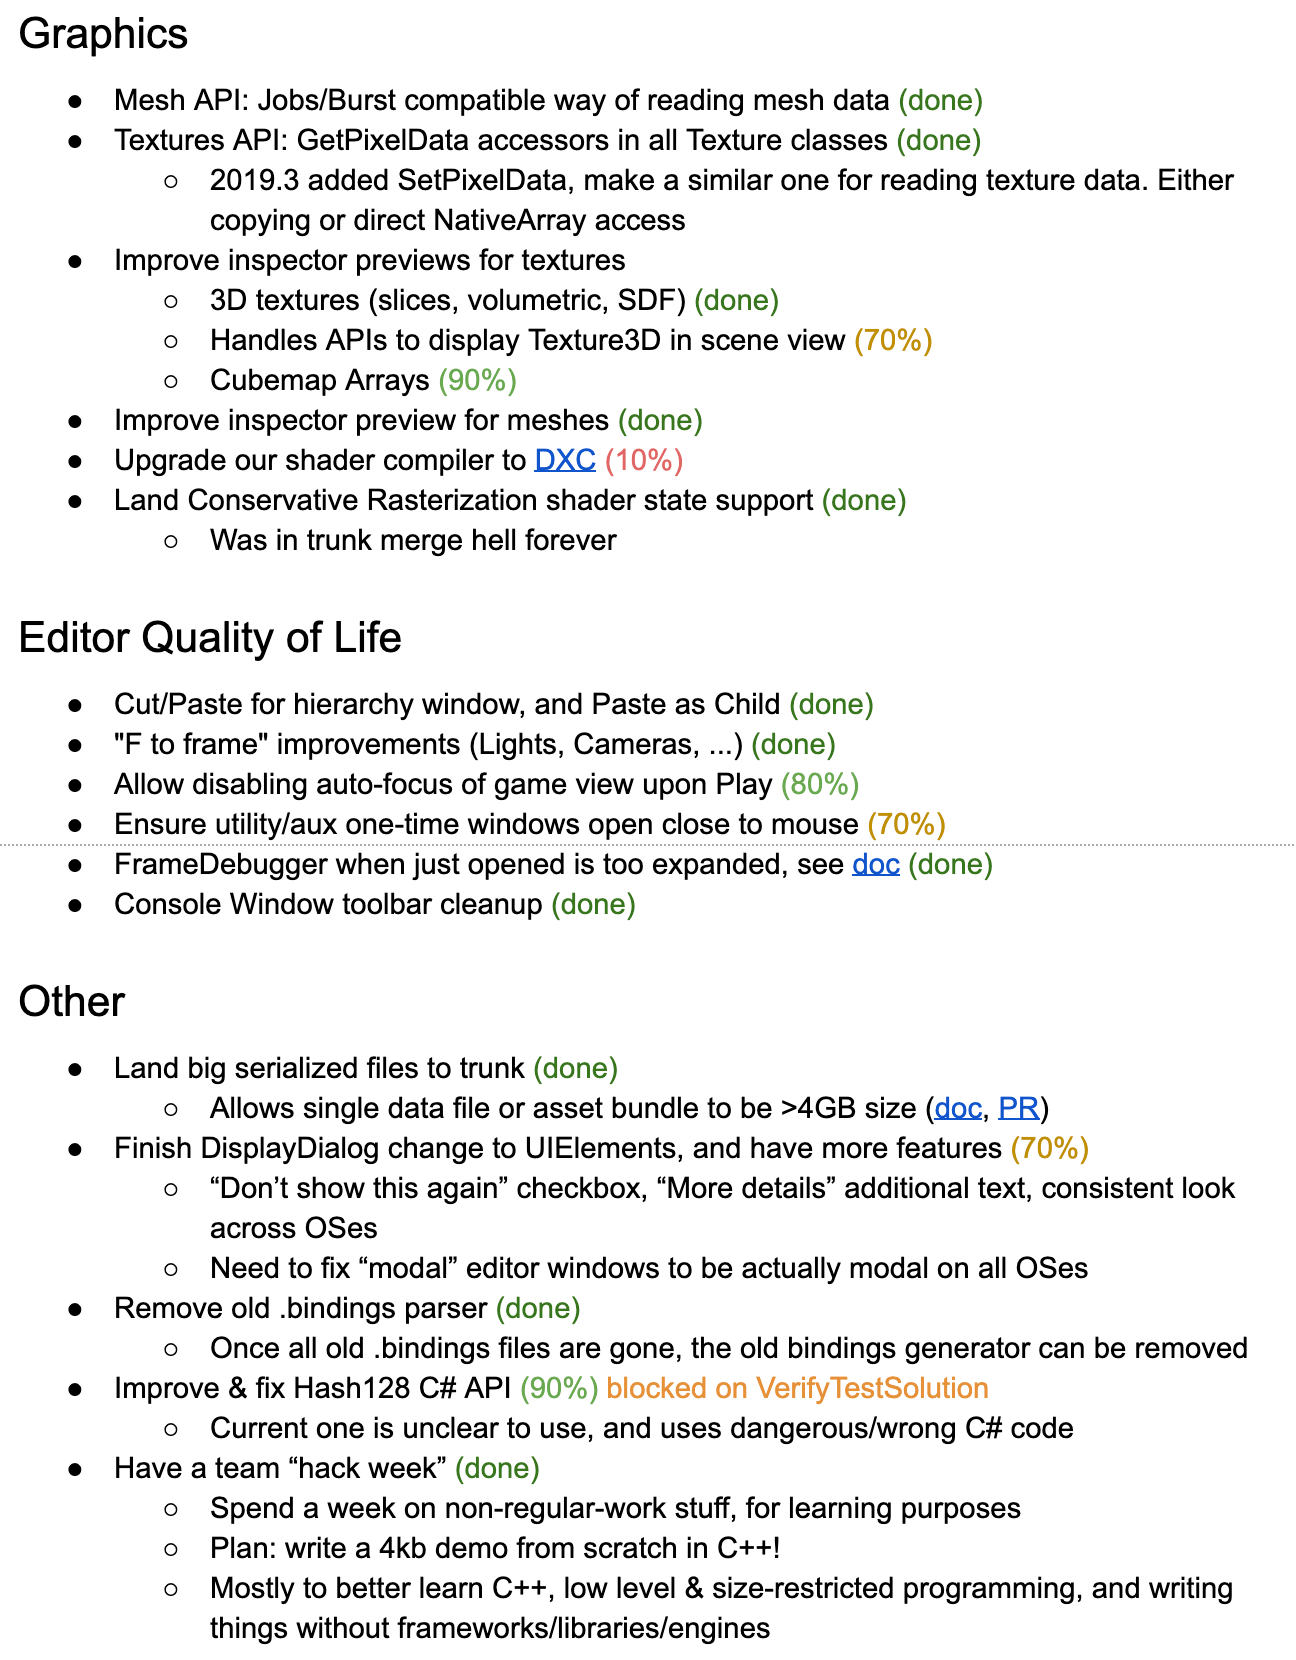
But also we managed to do some “random other” work, here’s a summary of what we casually did on the side
in 2019 Q3 and Q4 respectively:
For a team where 5 out of 8 people have only about a year of “professional programming/QA” experience, and where
this “side work” is not even our main focus area, I think that’s pretty decent! Happy there.
Starting this year, my team will be transitioning towards “various quality-of-life improvements” work, mostly
in the editor based on artist/production feedback. Not “large features”, but various “low hanging fruit” that
is relatively easy to do, but for whatever reason no one did yet. Some of that because teams are busy doing
more important stuffs, some because work lands in-between teams with unclear ownership, and so on. “Editor Quality of Life”
in Q4 random work image above is basically what we’re after. Version Control integration and improvements we’ll
hand over to another team. Let’s see how that goes.
On a more personal side of work, I keep on doing short summaries of every week, and then at end of year
I write up a “wot is it that aras did” doc. Partially because every one of my bosses is in some other office and I rarely
get to see them, and partially so that I can argue I’m worth my salary :), or whatever.
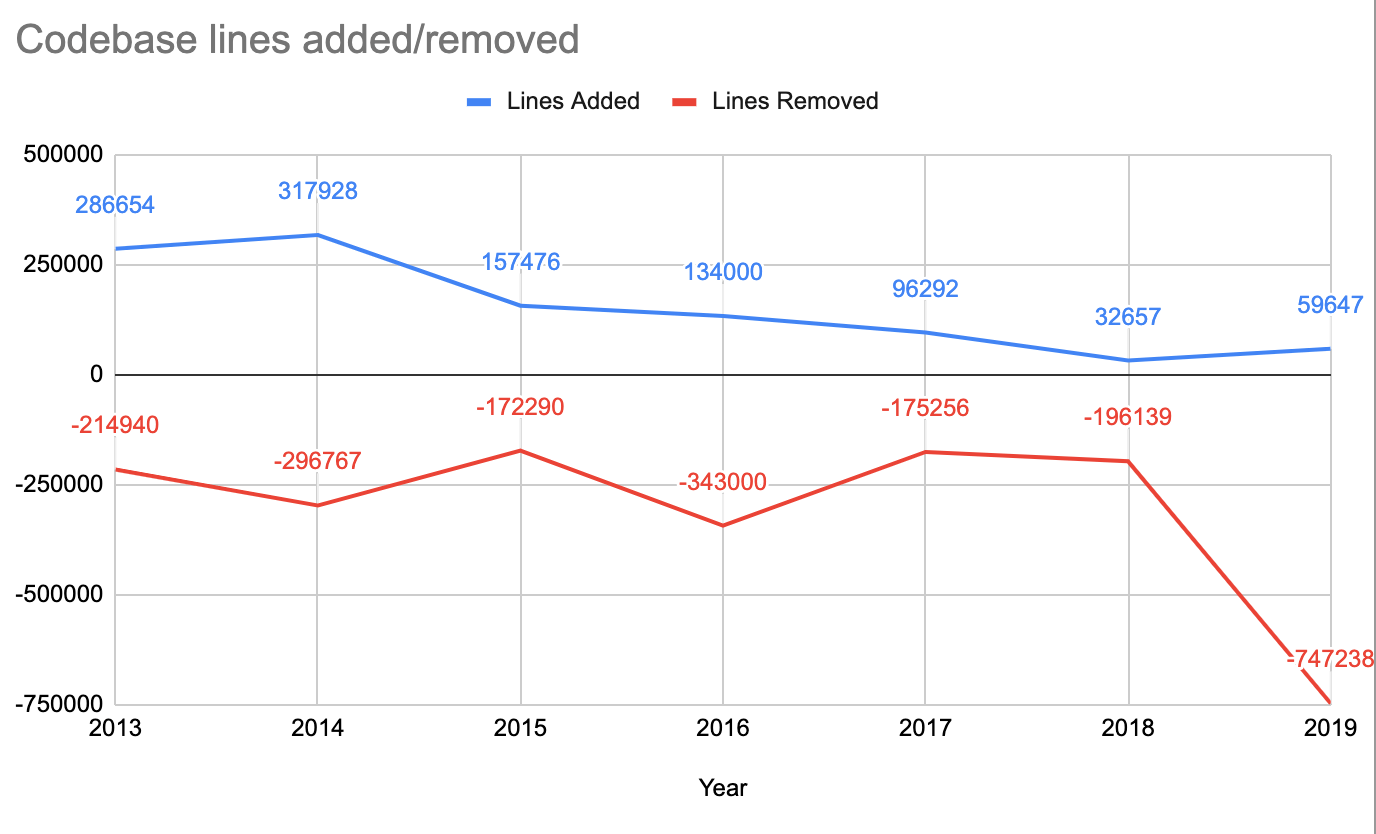
Happy to report that I managed to delete 747 thousand lines of code last year! That is a bit cheating though,
since half a million of that was versioned Quicktime headers, and turns out they are huge. Most of other deletions
were things like “remove the old C#<->C++ bindings system”, which is no longer used. Anyway, I like deleting code, and this year was good.
Looking forward to what “my” team will be able to pull off in 2020, and also how juniors on the team will
grow. Let’s make and ship more of these improvements, optimizations and “someone should totally have done this by
now” type of things. \o/
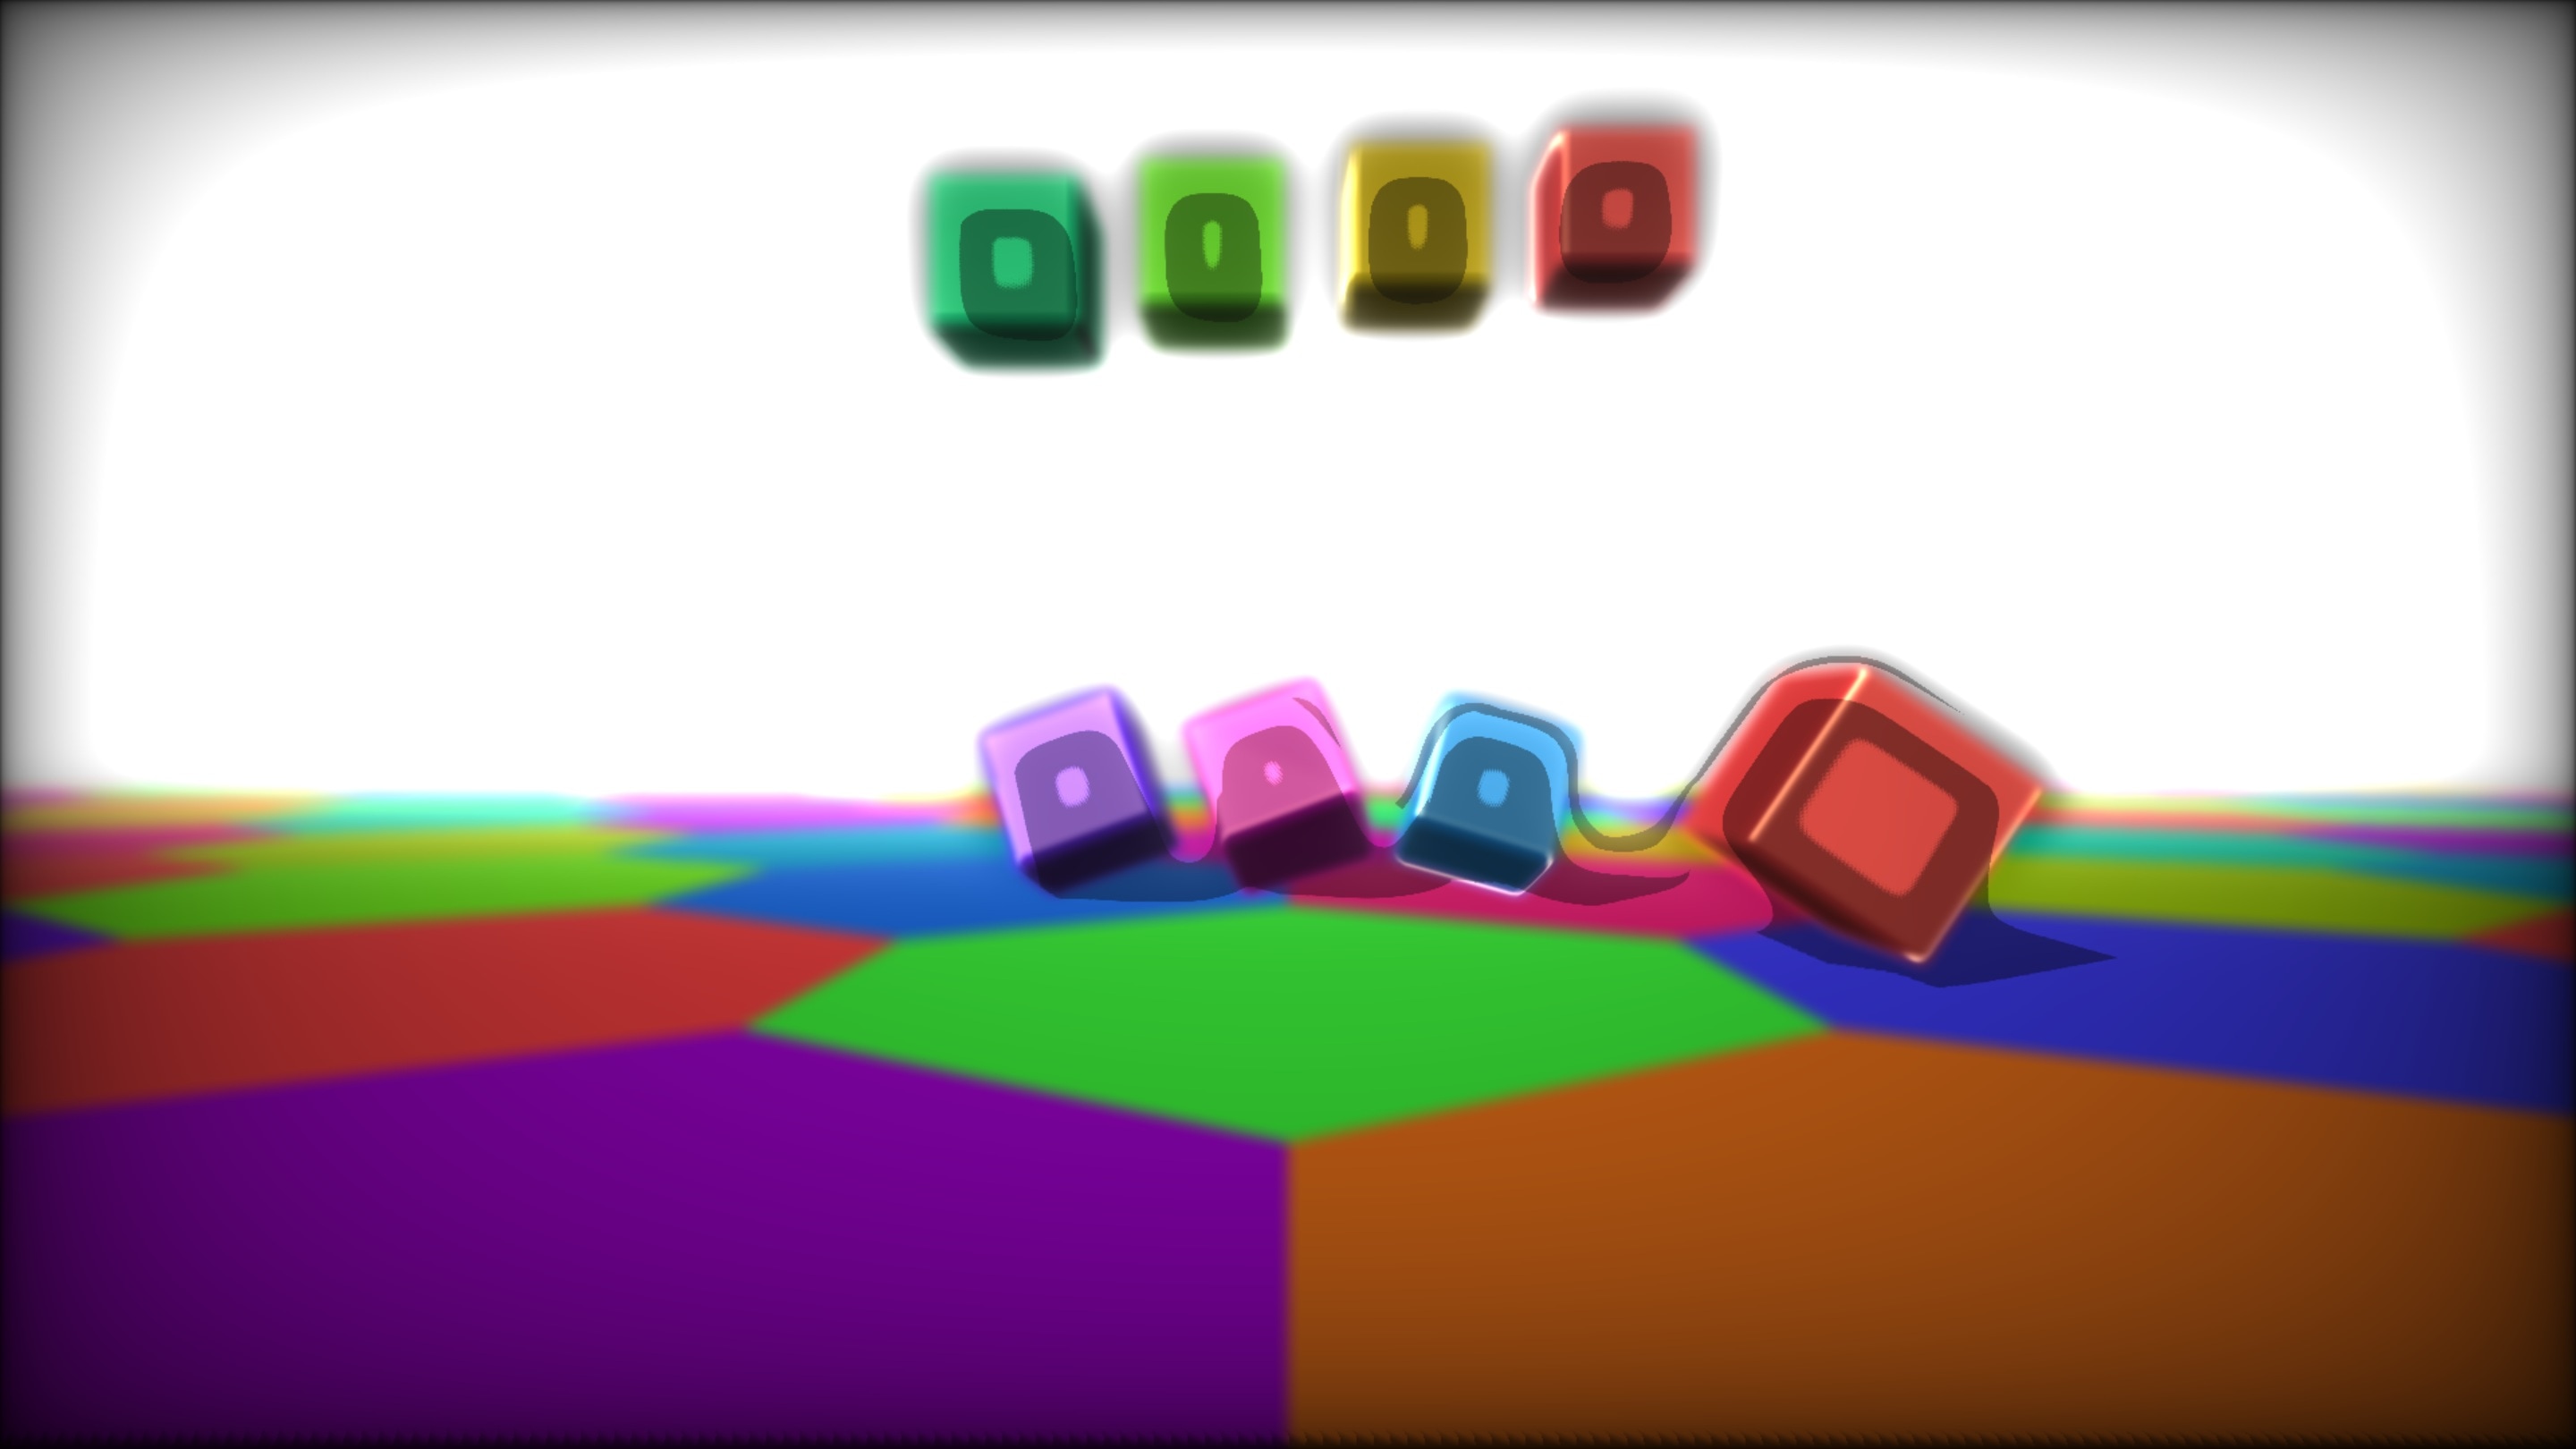
So a dozen years ago I wrote “hey, 4 kilobyte intros are starting to get interesting”. Fast forward to 2019,
and we made an attempt to make a 4KB demo with my team at work. None of us have any previous size-limited
demo experience? ✅ We have no idea what the demo would be about? ✅ Does it have a high chance of being
totally “not good”? ✅ So we did the only thing that made sense in this situation – try to do it!
We did not follow the modern trend of making 4KB demos that are purely “one giant shader that does
raymarching”, and instead did most of the code on the CPU in C++. Physics simulation? Sure why not.
Deferred rendering? Of course. Just write it in regular programming style, without paying
that much attention to size coding tricks (see in4k or
sizecoding)? Naturally.
Maybe that’s why this did not fit into 4 kilobytes :) and ended up being 6.6KB in size.
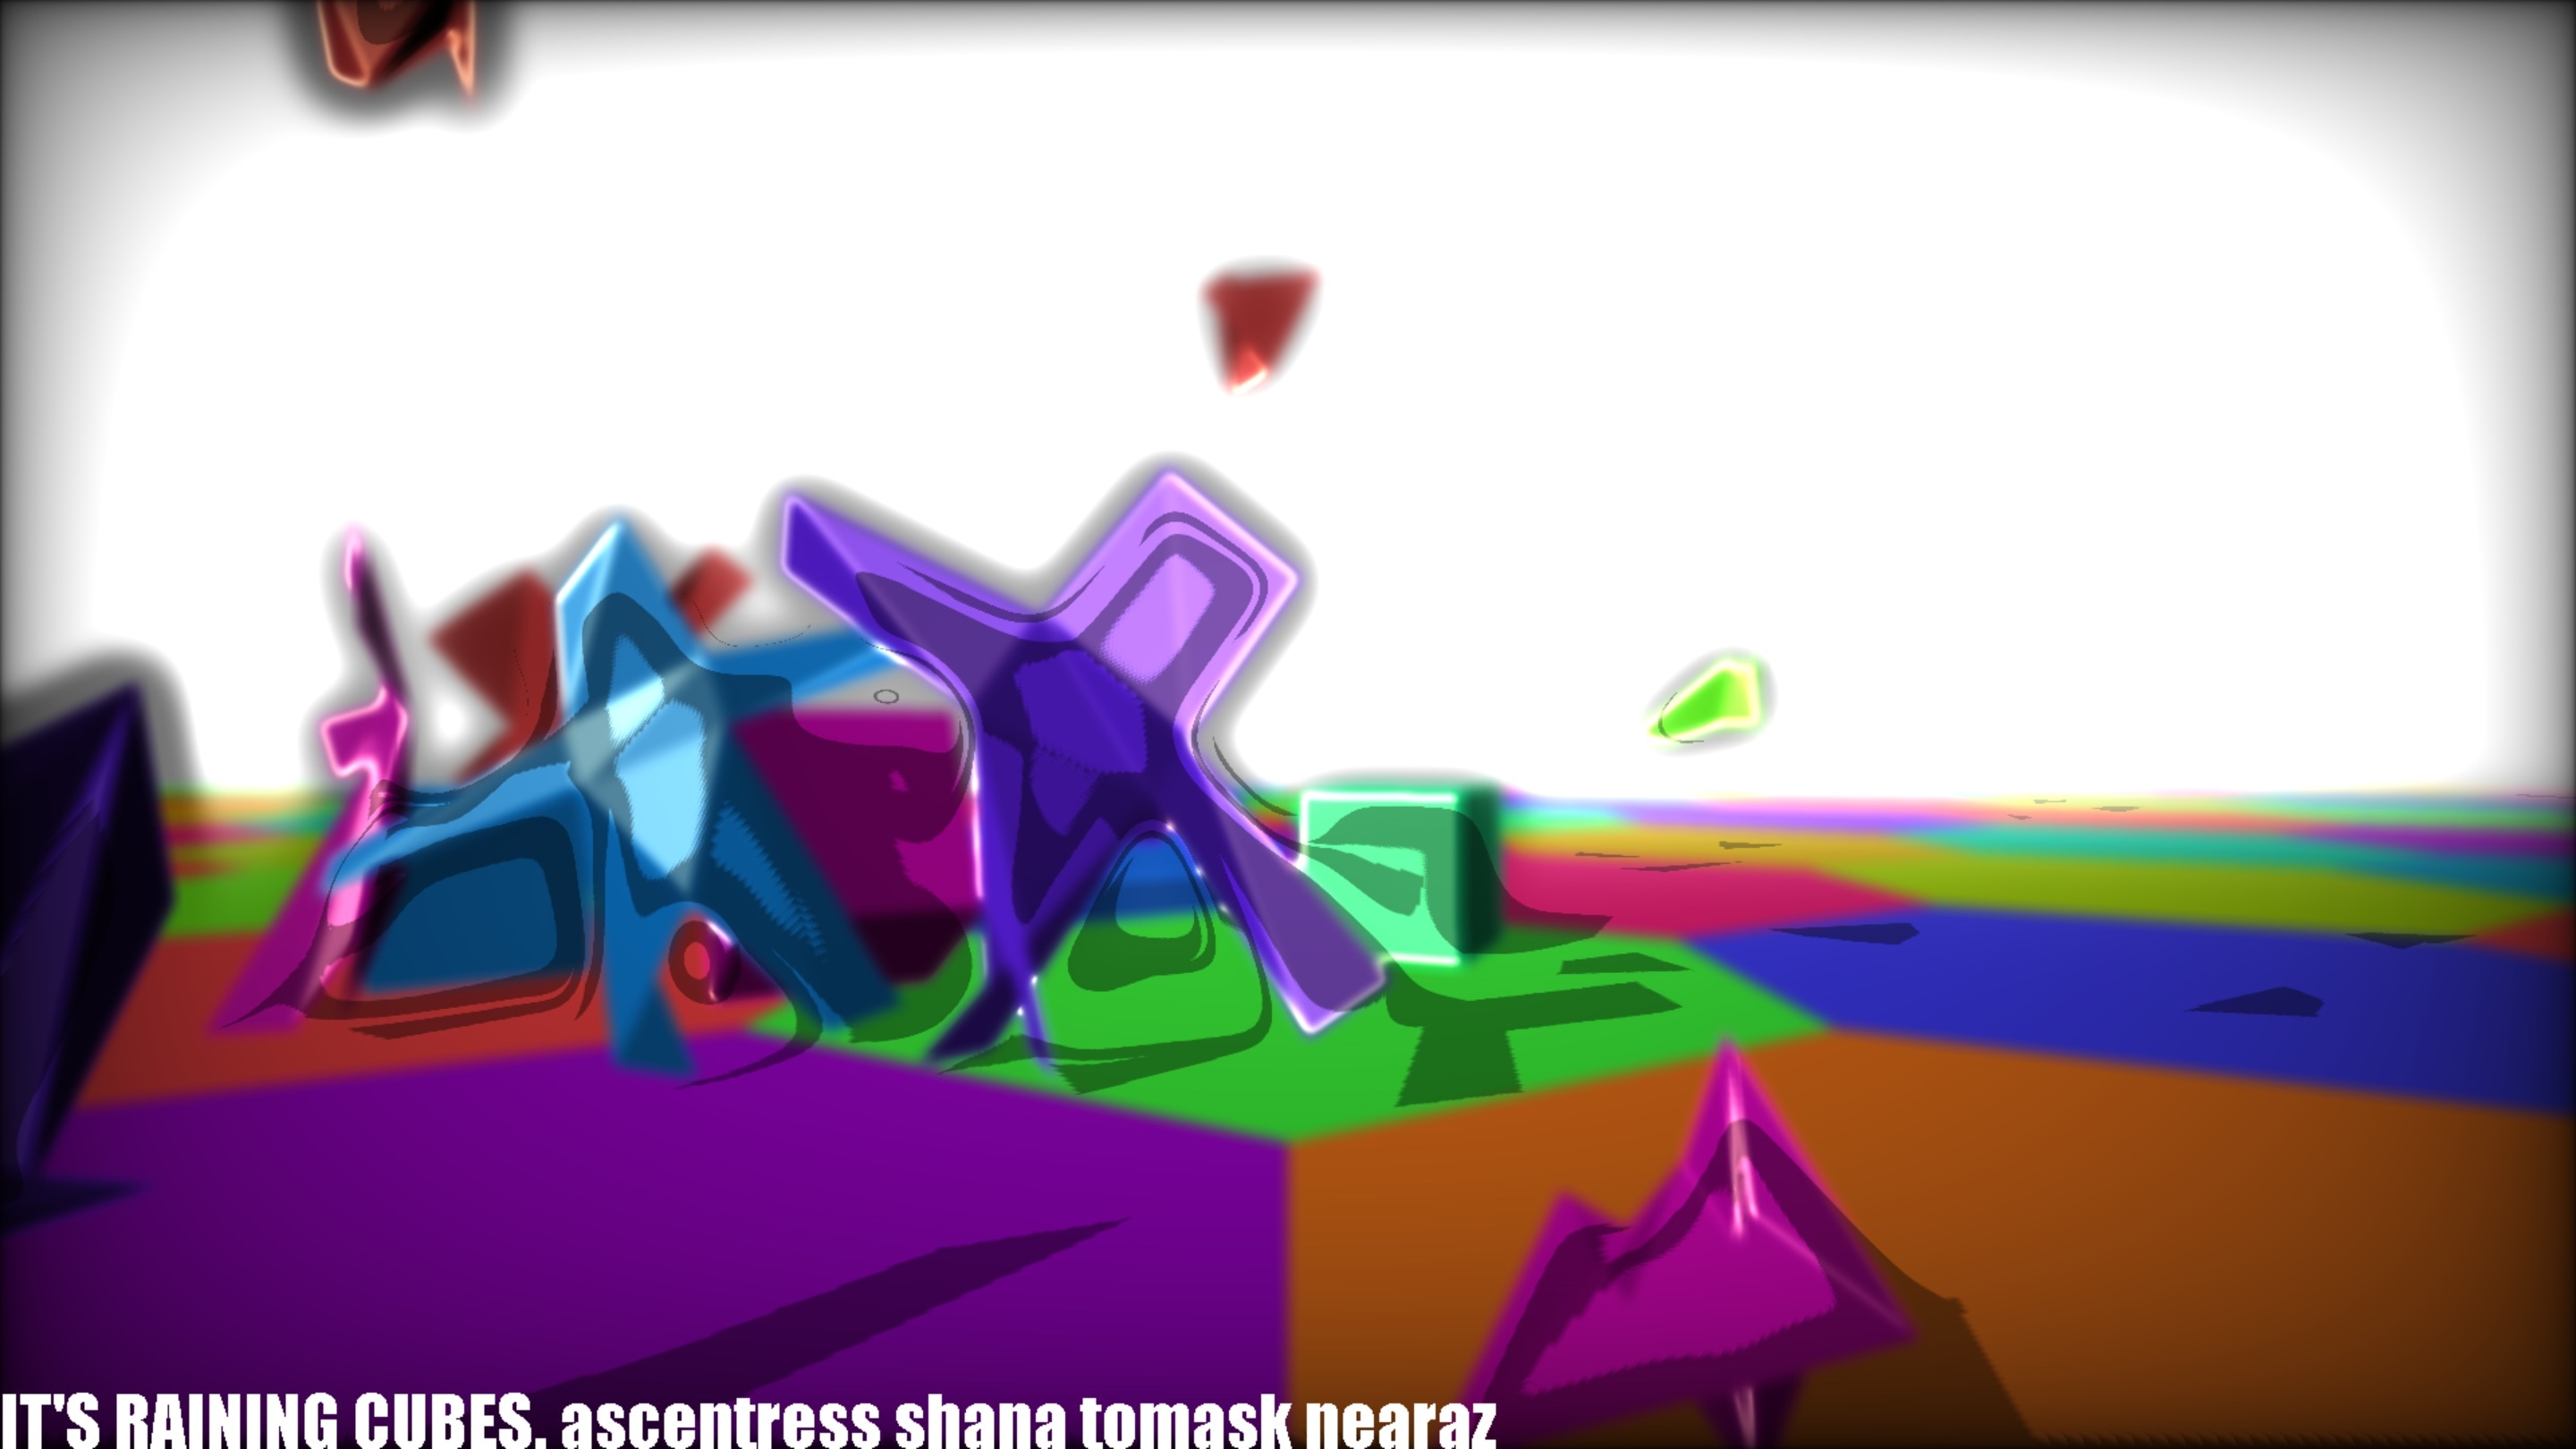
Verlet style physics simulation. Simulates points and springs between them; also approximates each cube
with a sphere :) and pushes points outside of them.
Deferred rendering (world’s most pointless deferred usage?) with colors, normals and the Z-buffer.
There’s one shadowmap for the light source. The whole G-buffer is blurred (including depth and normals too!)
with an Masaki Kawase style iterative filter and then the lighting is computed. That’s what produces the
bloom-like outlines, soft edges on cubes and weird shadow shapes. It should not have worked at all.
Music is made in Renoise, using 4klang for playback.
While it’s not impressive by any standards, I kinda expected us to achieve even less. Again, no previous experience
in this area whatsoever! Four (well ok, almost seven…) kilobytes is not much, but with tools like Crinkler
(great executable size reporting there, by the way -
here’s an example) it’s manageable. There’s some wrestling with MSVC if you
want to ignore all the default libraries, like you have to make your own implementations of _fltused, _ftol2(),
_ftol2_sse(), memset(); load functions like cos() manually from the old msvcrt.dll, and so on. Funtimes. But once
the basic setup is done, then it’s “just programming” really.
So! A while ago I worked on adding -ftime-trace support for Clang.
That landed and shipped in Clang 9.0 in
September of 2019, so \(^O^)/ Looks like it will also be coming to Sony development tools soon (see SN Systems
blog post).
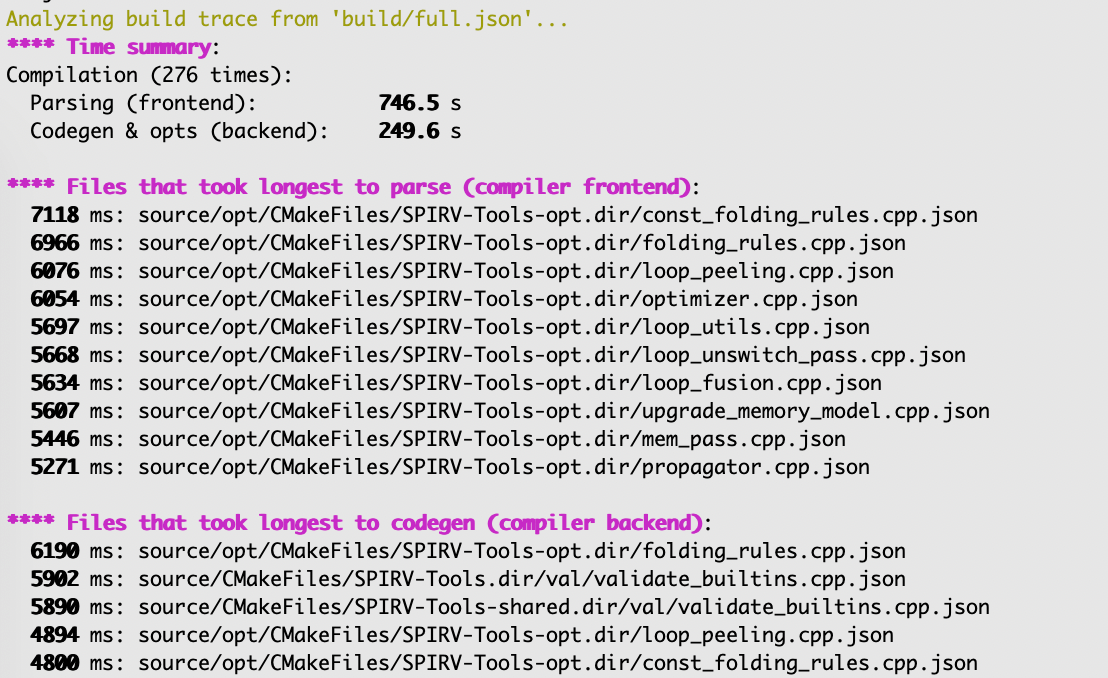
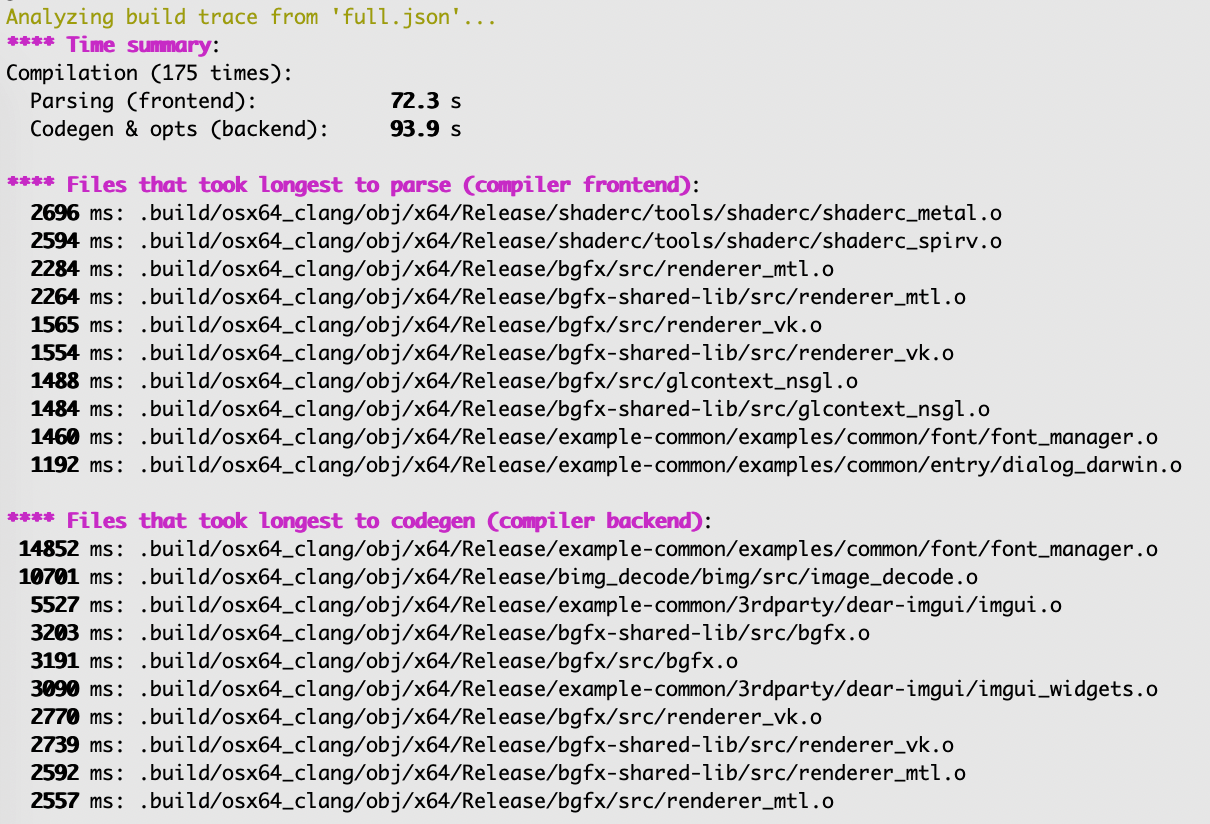
All that is good, but it works on one compiled file at a time. If you know which source files are problematic in your whole build,
then great. But what if you don’t, and just want to see things like “which headers are most expensive to include across whole codebase”?
Basically it grabs *.json files produced by -ftime-trace from your whole build, smashes them together and does
some analysis across all of them. For headers being included, templates being instantiated, functions code-generated, etc.
And then prints the slowest things, like this:
Aaanyway. Maybe that will be useful for someone. Issue reports and pull requests welcome, and here’s the github repo
again: github.com/aras-p/ClangBuildAnalyzer
So! Turns out my “two years in a build team” post was almost
the end of my time there :) I’ve started a new thing & new work area, and am wrapping up some of my leftover
build team work as we speak. But! I wanted to write about one particular aspect of this build system work,
which took almost three years in total.
Three. Years.
That’s a really long time, and that’s how long it took for us to switch from “the build system we had previously” to
“the build system we have now”. Turns out, replacing a system in an ever-moving product is really, really, REALLY hard.
Sometimes I see that whenever people dream up some New Fancier Better system, they think that making this new system is the
where most of the work will go into. In my experience (in build system, but also in a handful of other occasions),
in addition to developing the new things, you also have to cover these:
While you will be busy doing new stuff, how will you keep up with changes to the old stuff? In a build system, people will
keep on adding new files, libraries to be built, will tweak compiler flags, change preprocessor defines, update SDK/compiler
versions and so on. Same with any other area – the old system is “live”, being used and being changed over time; maybe data
for the old system is still being produced by someone out there. How will you transition all that?
How will the new system be rolled out, in a way that everything keeps on working, all the time?
We have hundreds of developers on this codebase, a lot of automated processes running (builds, tests, packaging etc.),
and if everyone loses even a day of work due to some mess-up, that’s a massive cost. Really risky changes
have to be rolled out incrementally somehow, and only rolled out to “everyone” when all the large issues are found
and fixed.
So here’s a story in how we did it! I don’t know if the chosen approach is good or bad; it seems to have worked out fine.
2016 May, “Jam with C#” project at Hackweek.
At Unity Hackweek 2016, one of the projects was
“what if instead of Jam syntax to describe the build, we had C#?”. There’s a short video of it here:
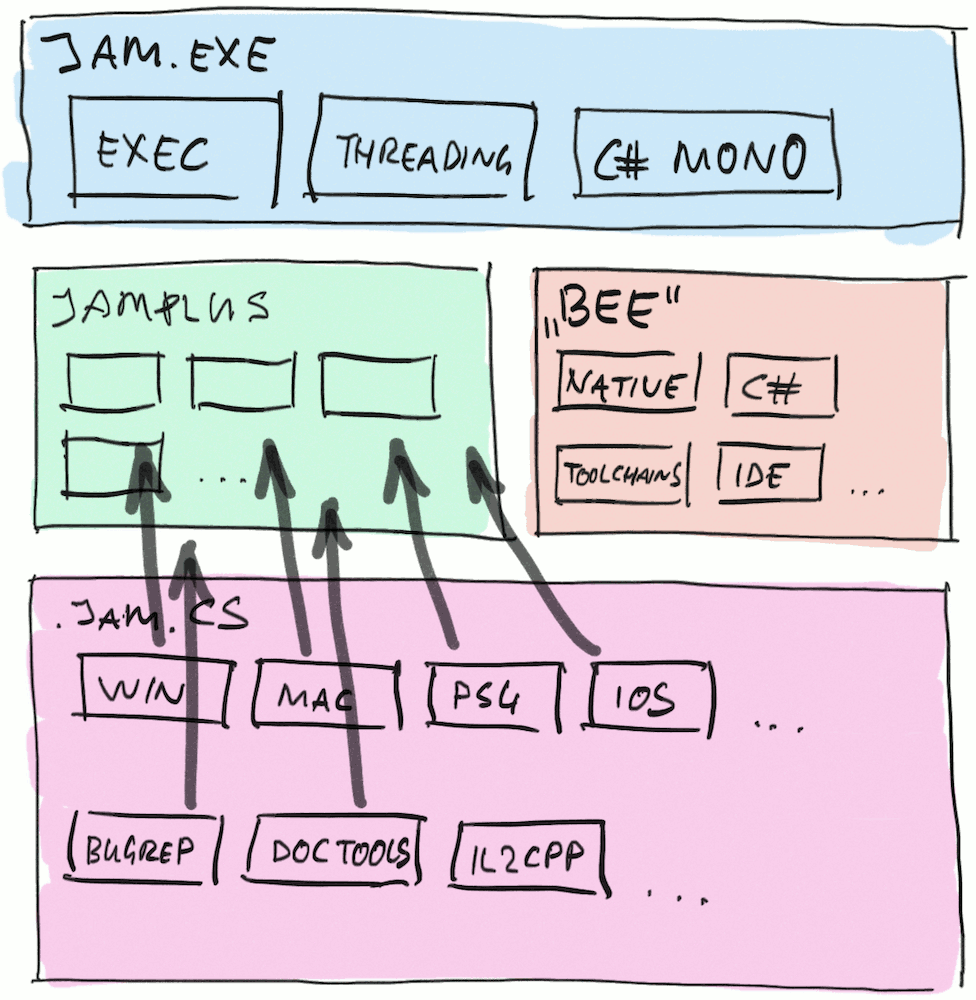
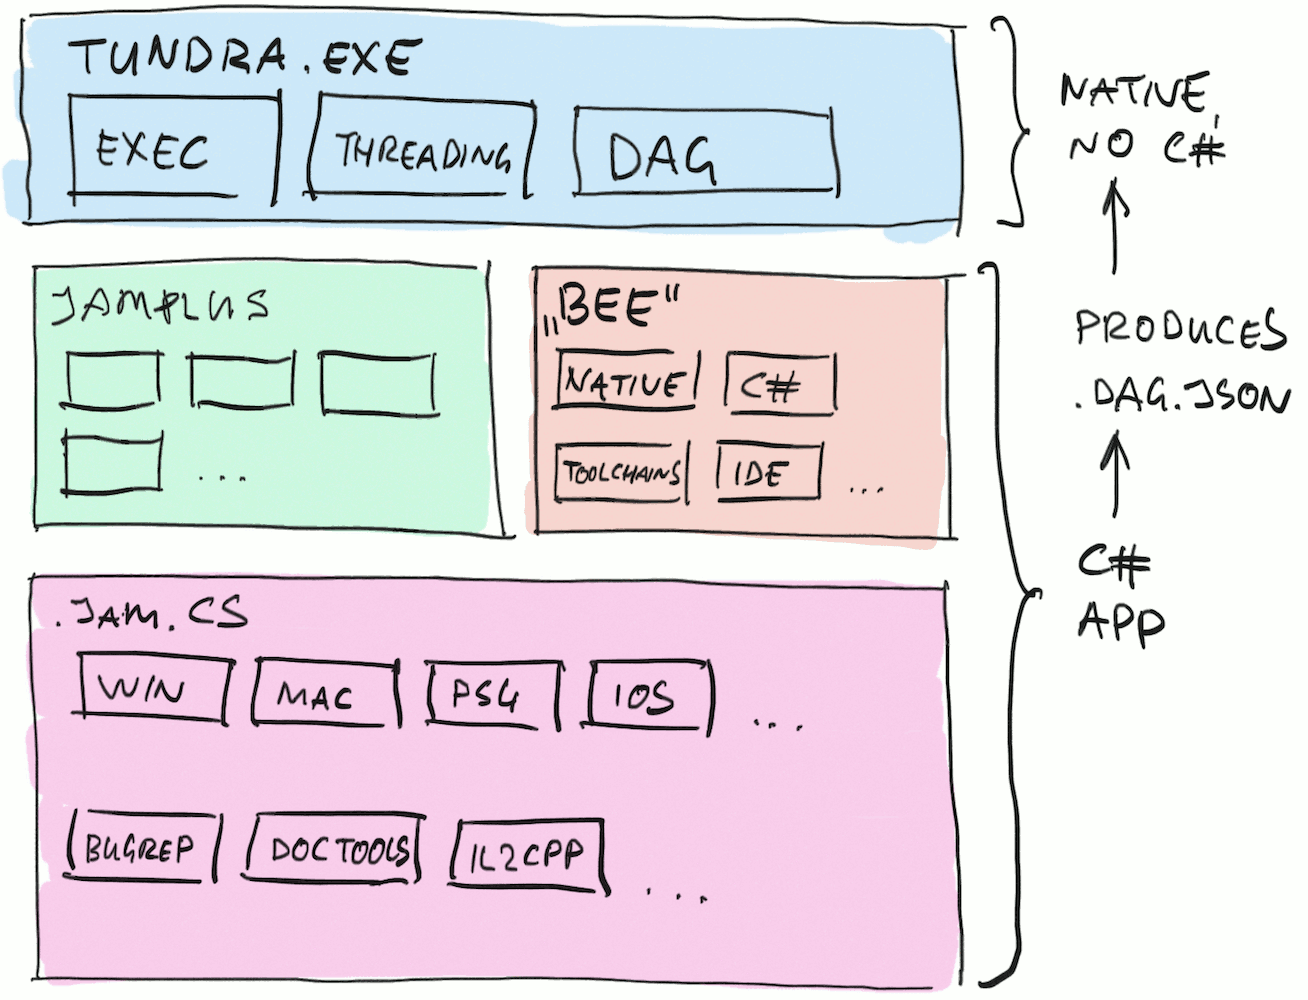
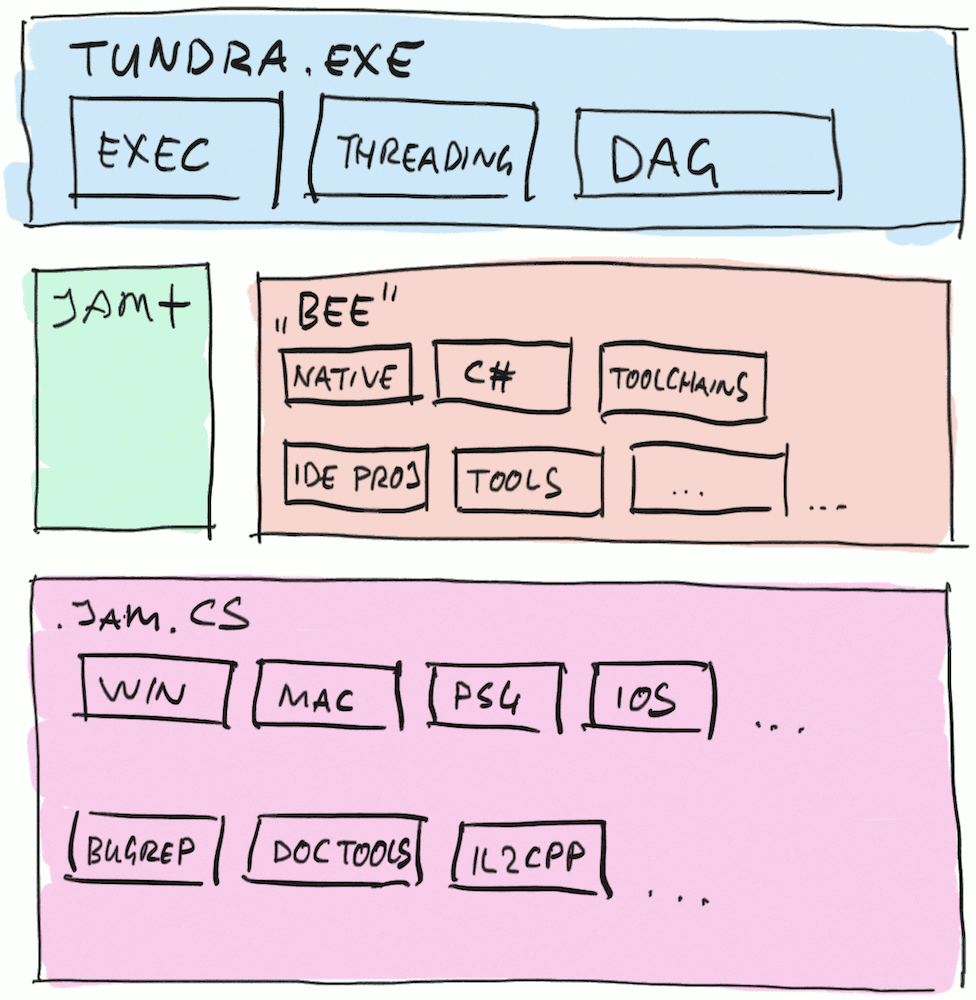
We used a Jam-based build system called JamPlus
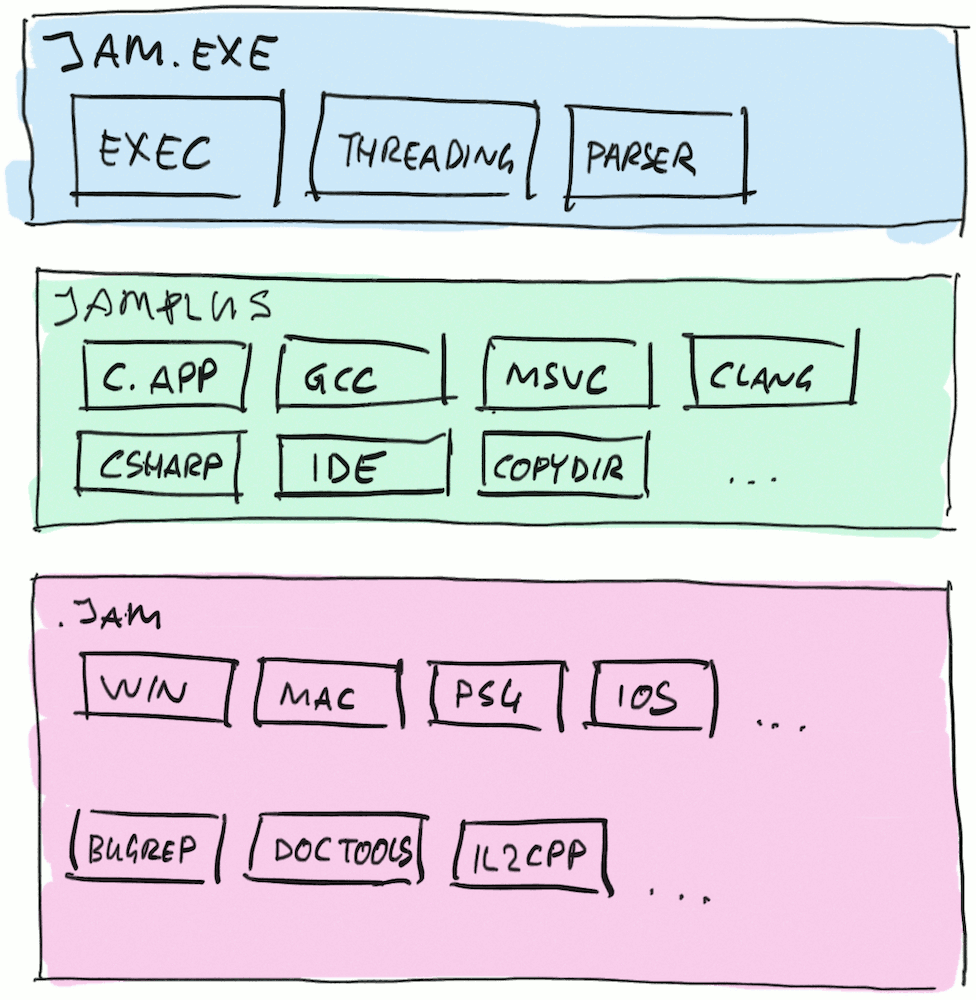
to build everything inside Unity since about 2010. Overall the whole setup looks like this:
There is an actual “build engine”, the jam.exe itself. This piece knows how to parse *.jam files that describe
the build, find which things need to be updated in order to build something, and execute these builds commands
in parallel where possible.
“JamPlus” is a bunch of rules written on top of that, in a combination of Jam and Lua languages. These are helper utilities,
like “finding a C++ compiler” and describing basic structure of a C/C++ program, etc. JamPlus can also generate IDE project
files for Visual Studio, Xcode and so on.
And then we have a bunch of our own *.jam files, that describe pieces and platforms of Unity itself. From simple things like
“this is a list of C++ files to compile, and here are the compiler flags”, to more involved things that are mostly about generating
code at build time.
Jam language syntax is very compact, but also “interesting” – for example, it needs whitespace between all tokens;
and yes that means space before every semicolon, or otherwise a lot of confusing messages you will get. Here’s
a random example I found:
So at this hackweek, what they did was embed C# (via Mono) directly into jam.exe, and make it be able
to run C# code to describe everything there is to build, instead of parsing a Jam language file. They also
wrote a converted from Jam language into C# language. If that sounds a bit crazy, that’s because it is, but
eh, who here has not embedded C# into a piece of software written in 1993?
And so all of *.jam files (our own build code, but also most of JamPlus rules) get turned into C# files, but
functionally nothing else changes. The auto-generated C# of course does not look much better; in fact at this
point it’s more verbose than original Jam code:
However with some cleanups and good IDEs (♥Rider) you can get to more legible
C# fairly quickly eventually:
static void ConvertFile(string cmd, NPath dest, NPath sourceInput, NPath generatedInput)
{
    InvokeJamAction(cmd, dest, JamList(sourceInput, generatedInput));

    // Tell Jam that the generated bison/flex file "includes" the original tempate grammar files,
    // meaning it will include whatever regular C headers these include too, to detect needed rebuilds.
    Includes(dest, sourceInput);

    Depends(dest, JamList(sourceInput, generatedInput));
    Needs(dest, BuildZips.Instance.FlexAndBison.ArtifactVersionFile);
}
2016, actual work starts
Hackweeks are a lot of fun, and one can get very impressive results by doing the most interesting parts of the project.
However, for actual production, “we’ll embed Mono into Jam, and write a language converter that kinda works” is not
nearly enough. It has to actually work, etc. etc.
Anyway, a couple months after hackweek experiment, our previous effort to move from Jam/JamPlus to
Gradle was canceled, and this new “Jam with C#” plan was greenlit.
It took until February of next year when this “Jam build engine, but build code is written in C#” was landed to everyone
developing Unity. How did we test it?
Had a separate branch that tracks mainline, where on the build farm it was doing two builds at once:
First, regular Jam build with the *.jam build code, and dumped whole Jam build graph structure,
Second one, with all the *.jam code automatically converted to C#, and dumped whole Jam build graph structure,
Checking that the two builds graphs were identical for each and every build target/platform that we have.
Had some developers at Unity opt-in to the new “Jam#” build code for a few months, to catch any possible issues.
Especially the ones that are not tested/covered by the build farm, e.g. “are Visual Studio project files still generated
just like before?”.
Before the final roll-out of “all .jam files are gone, .jam.cs files are in”, we also had a tool that would help anyone
who had a long-lived branch that they want to land to mainline. They might have changed build code in Jam language,
but after the C# roll-out their changes would have nowhere to merge! So there was a “give an old .jam file, we’ll get you
the converted C# file back” tooling for that case.
And so in 2017 February we rolled out removal of all the old *.jam files, and the (horrible looking) auto-converted
C# build code landed:
2017, starting to take advantage of this C# thing
Auto-converted-Jam-to-C# is arguably not much better. More verbose, actually kinda harder to read, but there
are some upsides. Statically typed programming language! Great IDEs and debuggers! You have more data types besides
“list of strings”! A lot of people inside Unity know C#, whereas “I know Jam” is not exactly common! And so on.
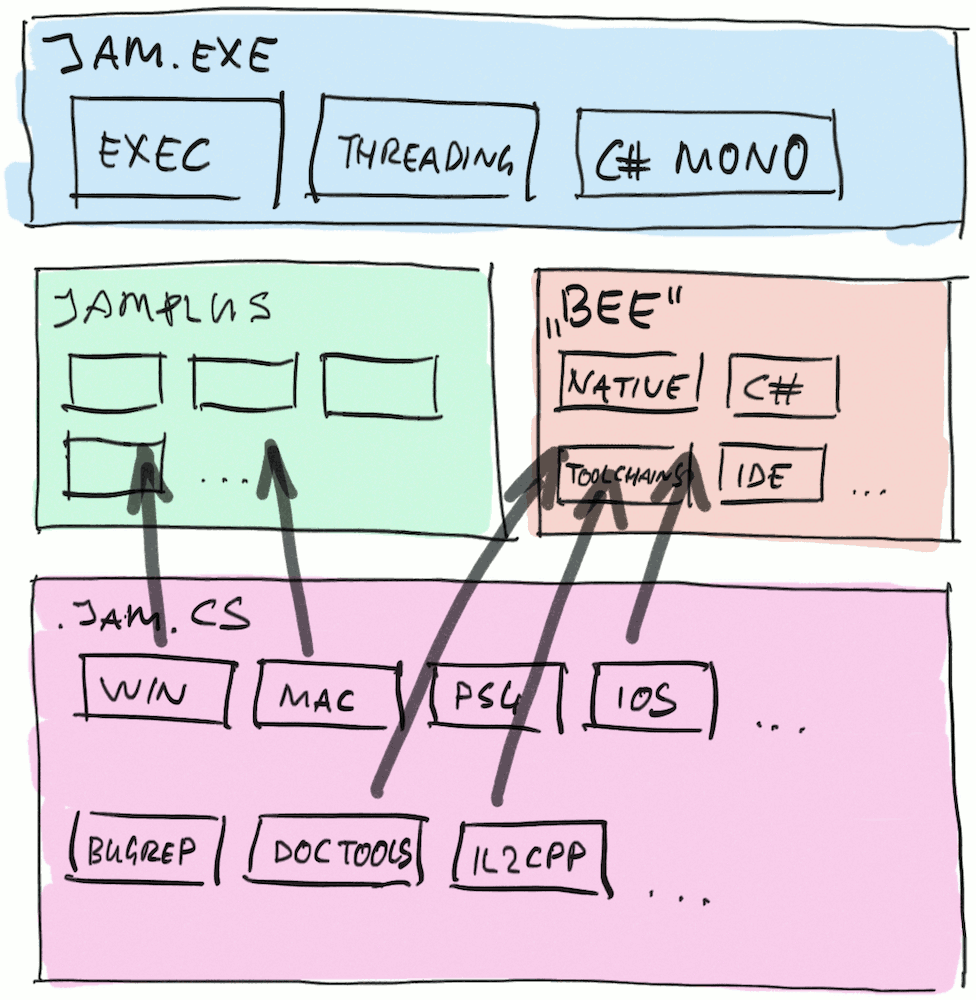
And so we started writing new C#-based APIs to express “how to build a program” rules, which we call “Bee”
(you’d have to ask @lucasmeijer about the name).
We were also rewriting IDE project files generation from the Lua-based one in JamPlus to, well, C#. My blog
posts from 2017 relating to Visual Studio project files (this one
or that one) might have been because I
was doing it at the time :)
Of course at this point all of our own build code still used the old JamPlus-but-now-C# APIs to express how things
need to be built. And we began taking all these pieces and converting them to use the new Bee build APIs:
This took much longer than initially expected, primarily because OMG you would not believe what a platform build
code might be doing. Why is this arcane compiler flag used here? No one remembers! But who knows what might break if you change it.
Why these files are being copied over there, ran through this strange tool, signed in triplicate, sent in, sent back,
queried, lost, found, subjected to public inquiry, lost again, and finally buried in soft peat for three months and
recycled as firelighters? Who knows! So there was a lot of that going on, inside each and every non-trivial build platform
and build target that we had.
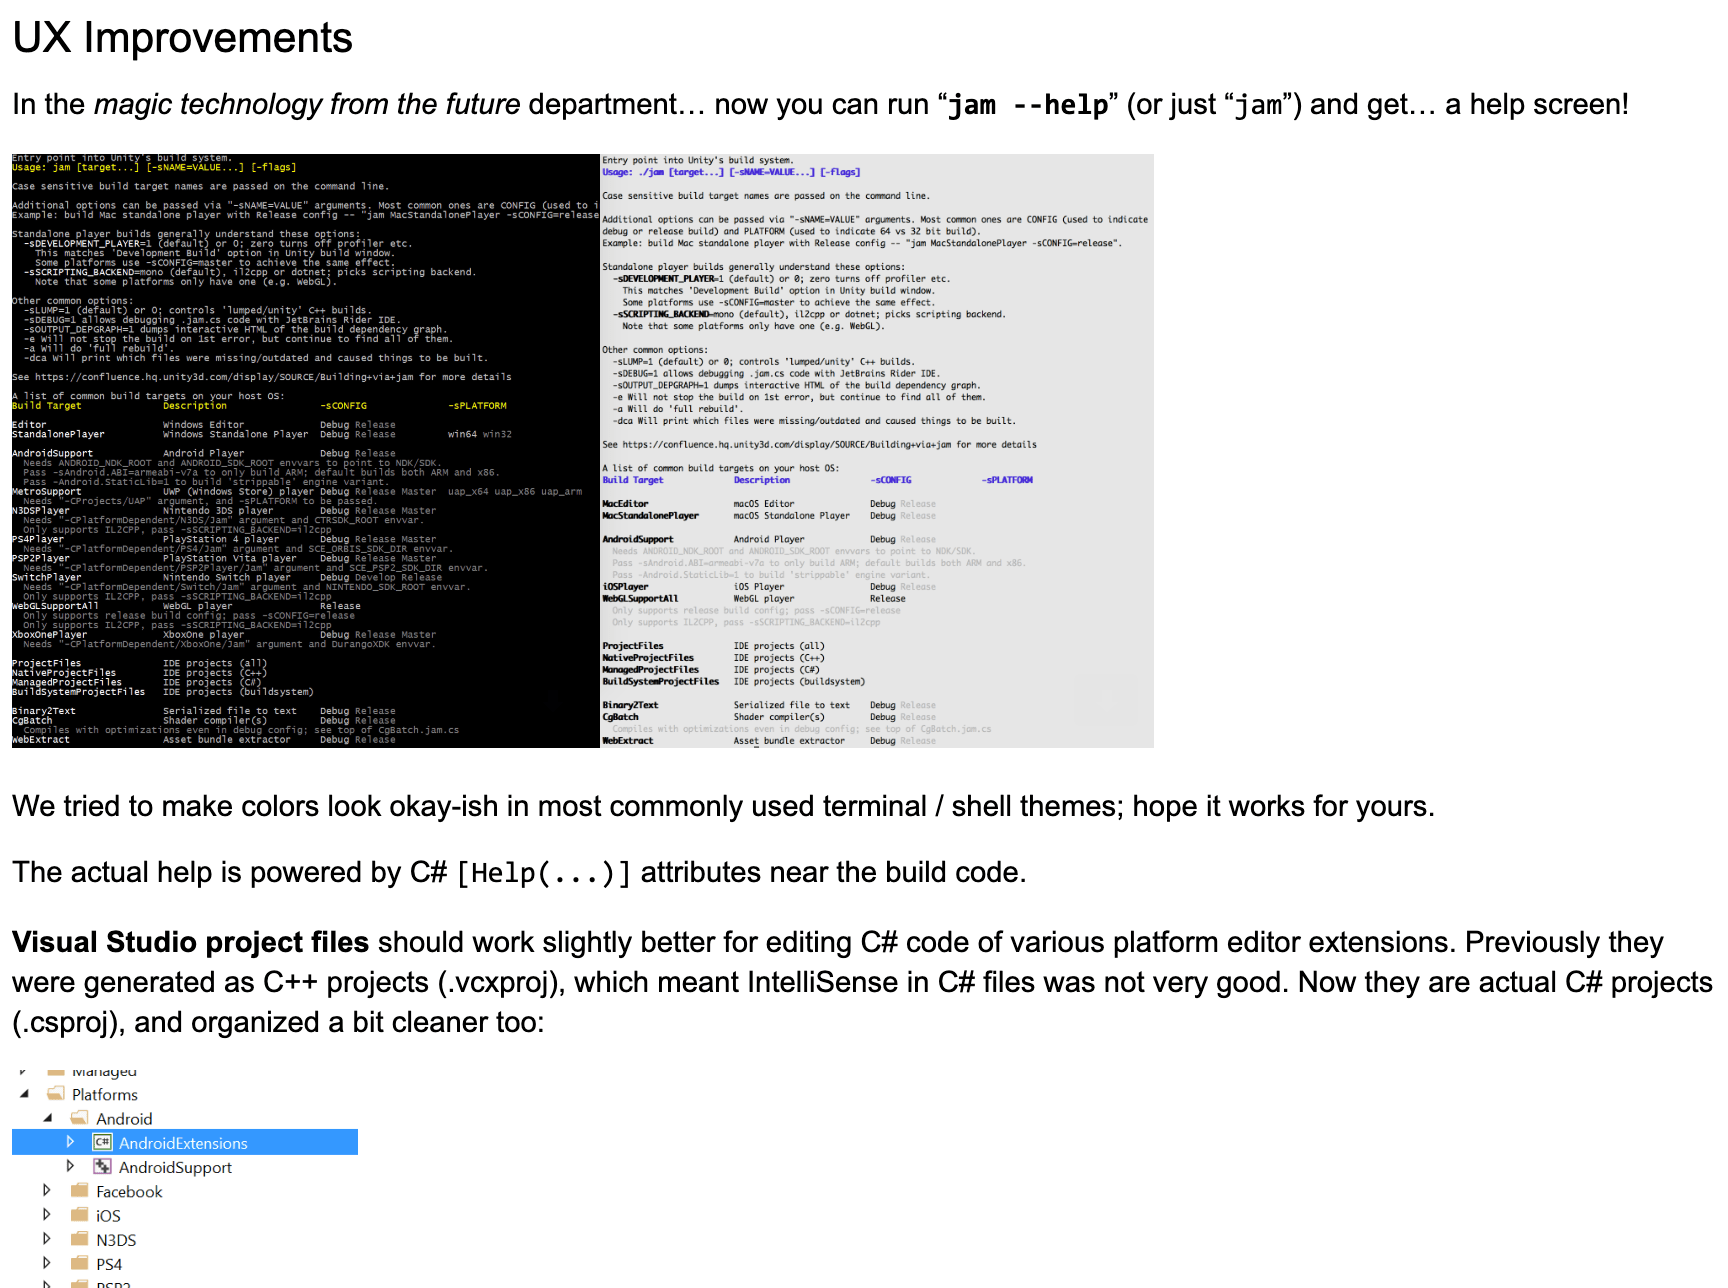
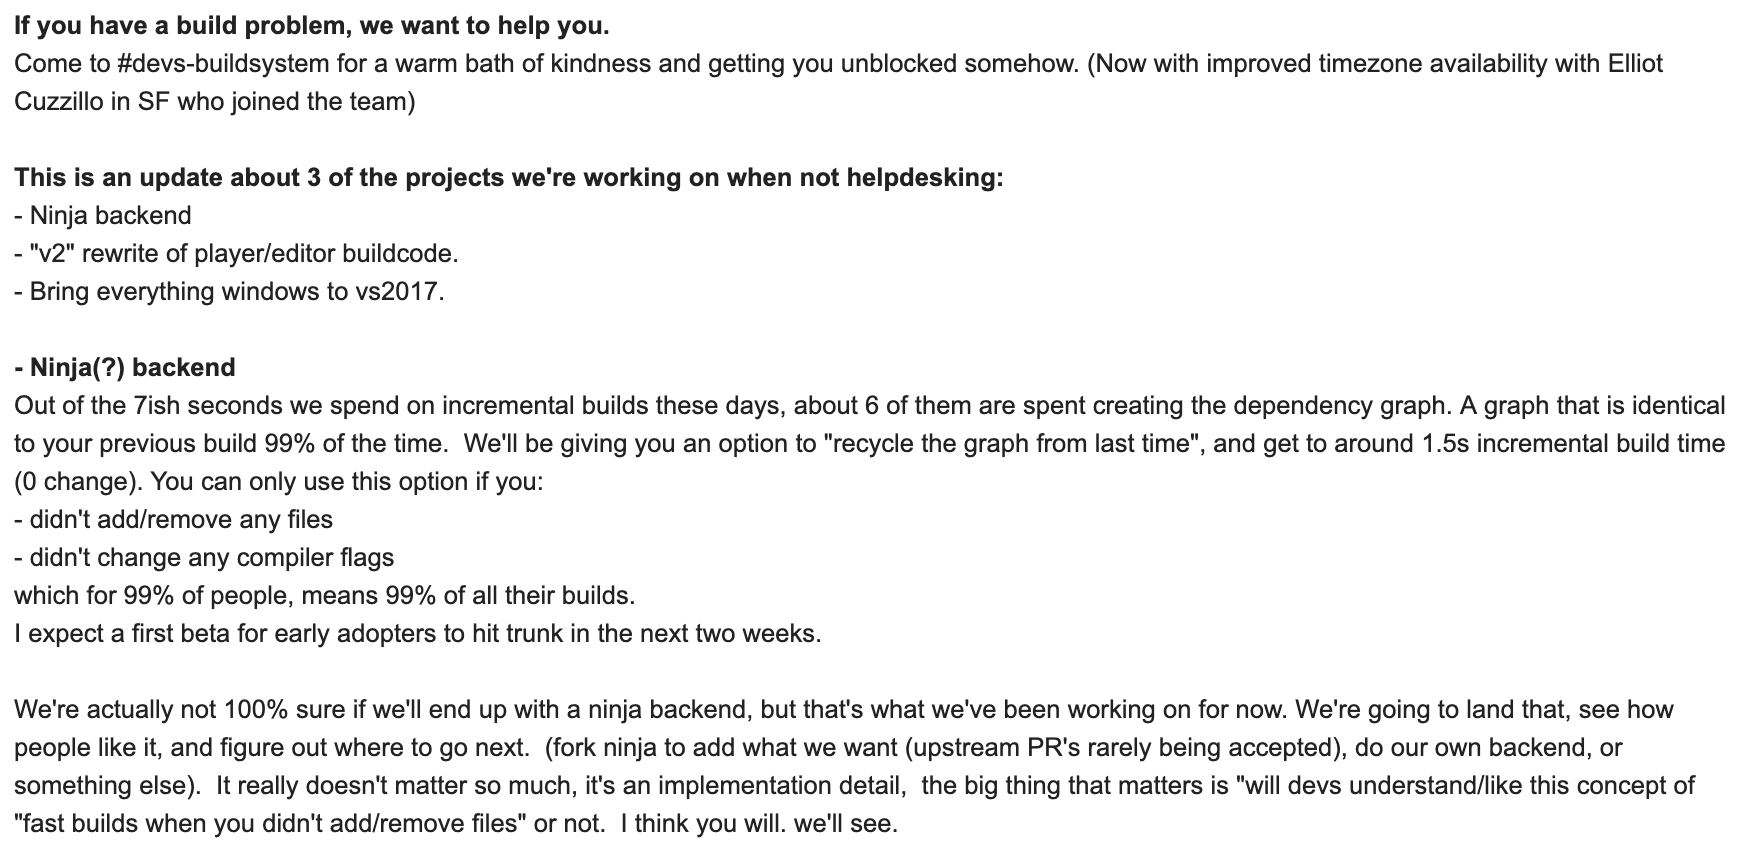
We also did a lot of work in other build areas, be it improving UX (error messages, colors, …), developing a system for downloading
binary artifacts as part of the build, upgrading and packaging up compiler toolchains, experimenting with Ninja build
backend instead of Jam (more on that later), optimizing codebase build times in general, improving project files and so on.
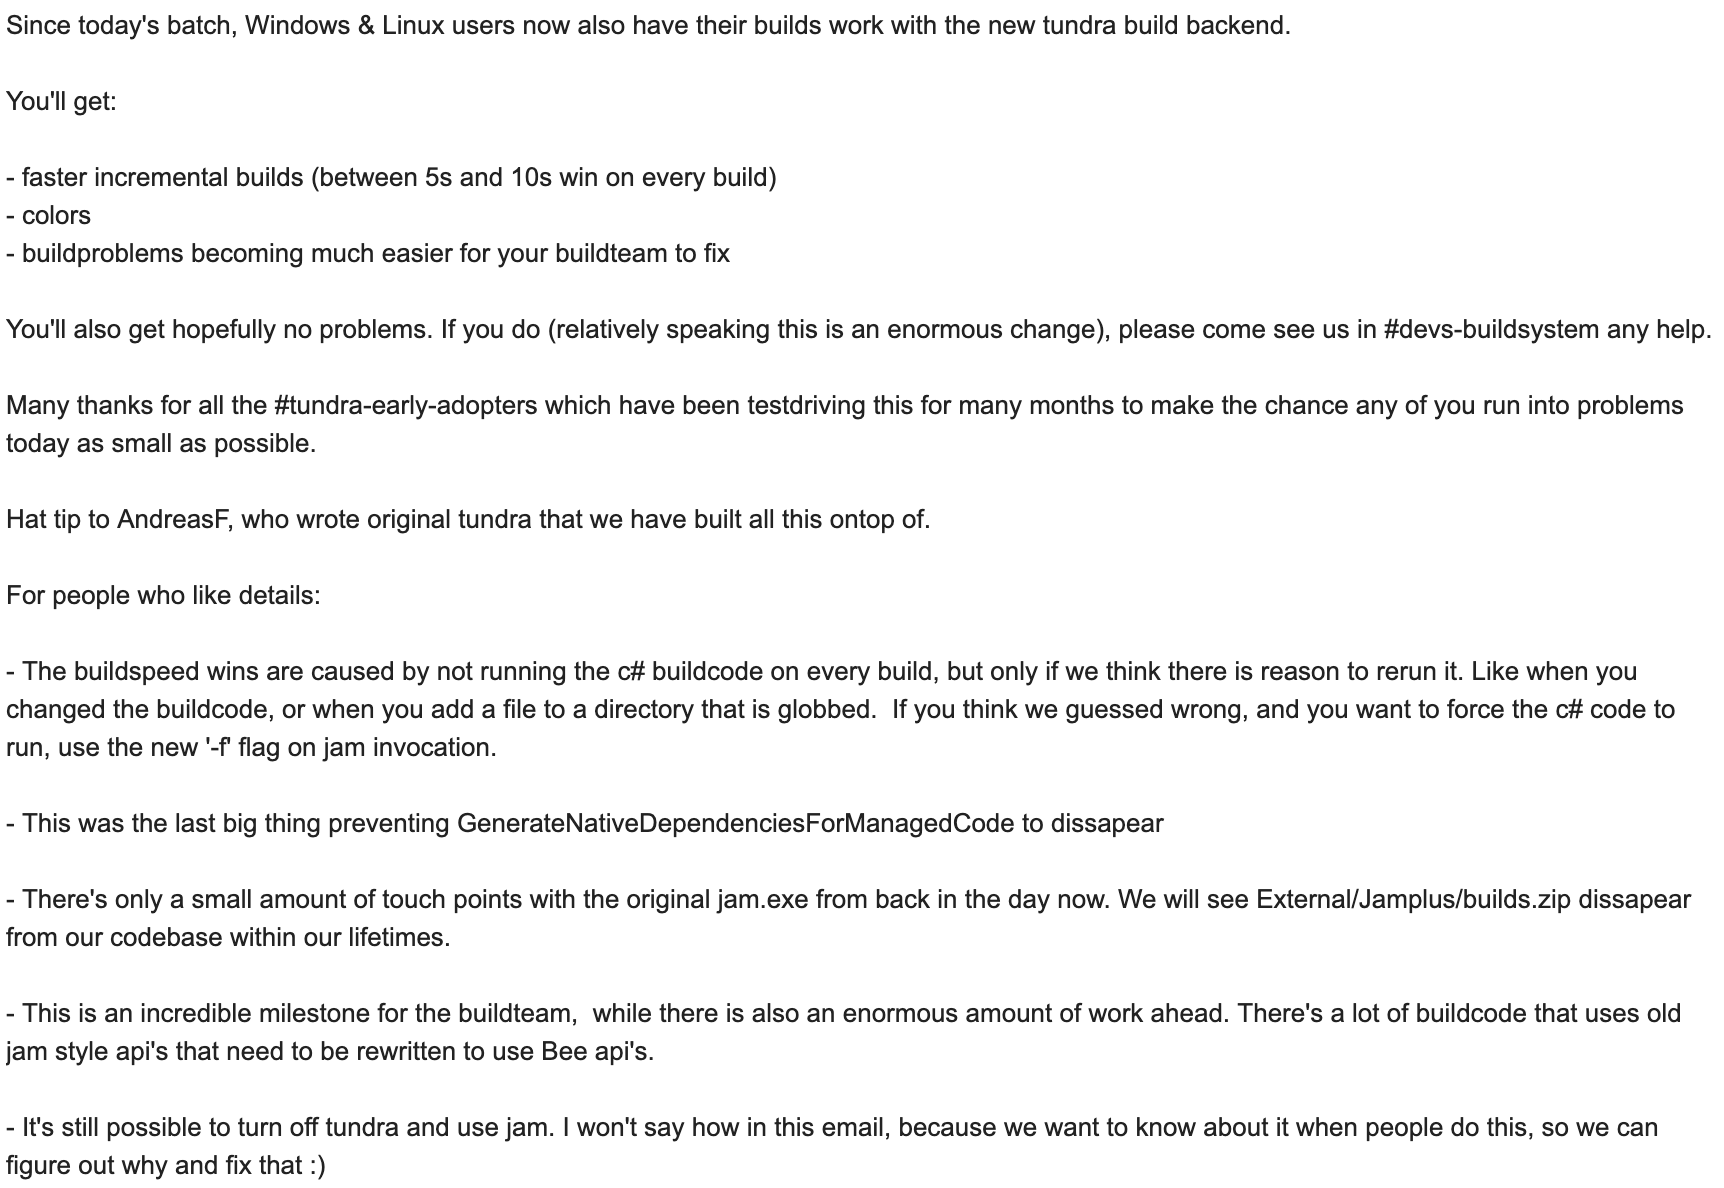
2018, Jam switched to Tundra backend
After some experiments with Ninja backend, we settled upon Tundra
(our own fork) and replaced the Jam build backend with it.
The change was fairly hard to verify that “it works exactly the same as before”, because Tundra does not work exactly the same
as Jam. One might think that all build systems are “have some rules, and a build dependency graph, and they
execute the build actions”, but it’s a bit more complexicated than that. There’s a nice paper from Microsoft Research,
“Build Systems à la Carte”, that categorizes
build systems by type of dependencies they support (static vs dynamic), scheduling approach, early cutoff support, etc.
Specifically, Tundra’s scheduler is different (I think it’s “restarting” one as per that paper, whereas Jam’s is “topological”).
In practice, at least in our codebase this means that Tundra very often rebuilds less things compared to Jam, especially when
things involve files generated during build time. Since the order of build steps and even the amount of them is different
between Tundra and Jam, we could not just build simple validation suite like “build everything with both, compare that
they did exact same steps”.
So what we did was rely on the automated builds/tests that we already had for the product itself, and also on volunteer developers
inside Unity to try out Tundra locally. Since 2018 January people could opt-in to Tundra by adding a tiny local environment change,
and report any & all findings. We started with a handful of people, and over coming months it grew to several dozen. In late May it
got turned on by default (still with ability to opt-out) for everyone on Mac, and next month everyone got Tundra switched on. Some time
later remains of jam.exe got actually removed.
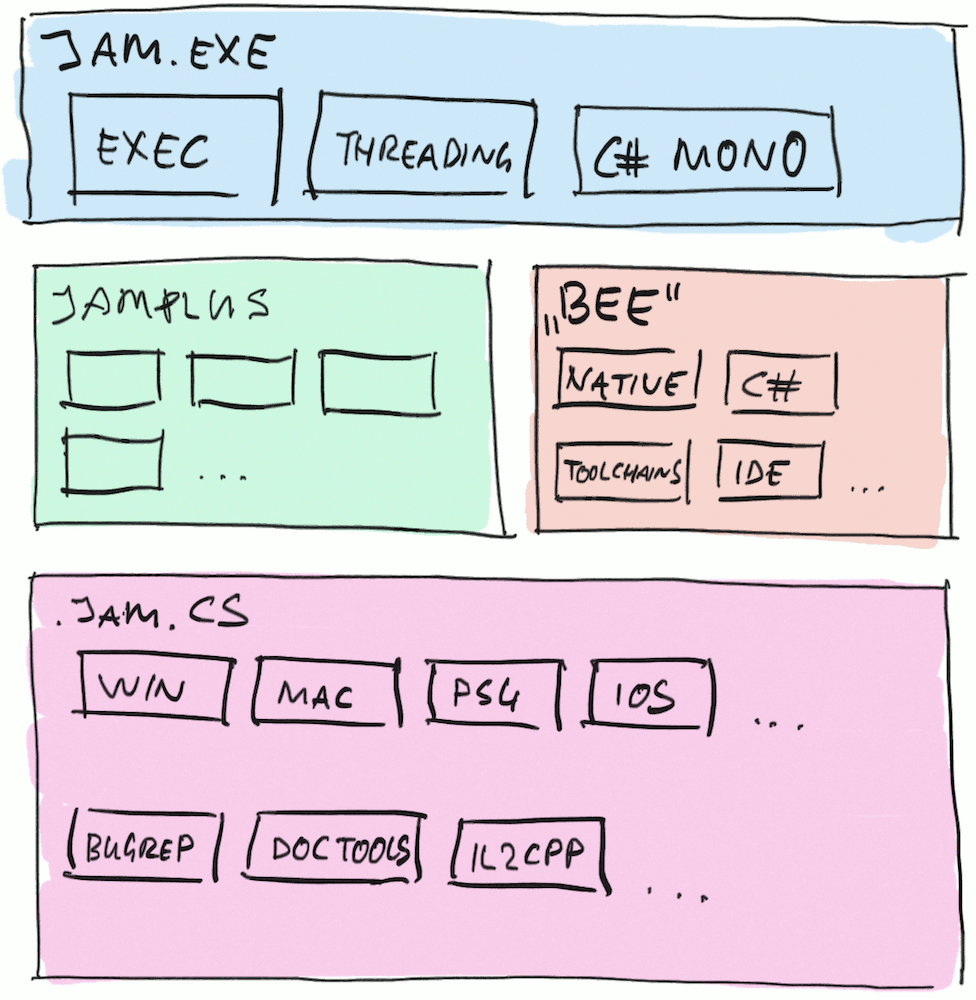
2019, current state
Today in our main code repository, jam.exe is long gone, and almost all of remains of JamPlus-converted C# code are gone.
Compared to the build state three years ago, a lot of nice build related tools were built (some I wrote about in the
previous blog post), and in general I think various aspects of build performance,
reliability, UX, workflow have been improved.
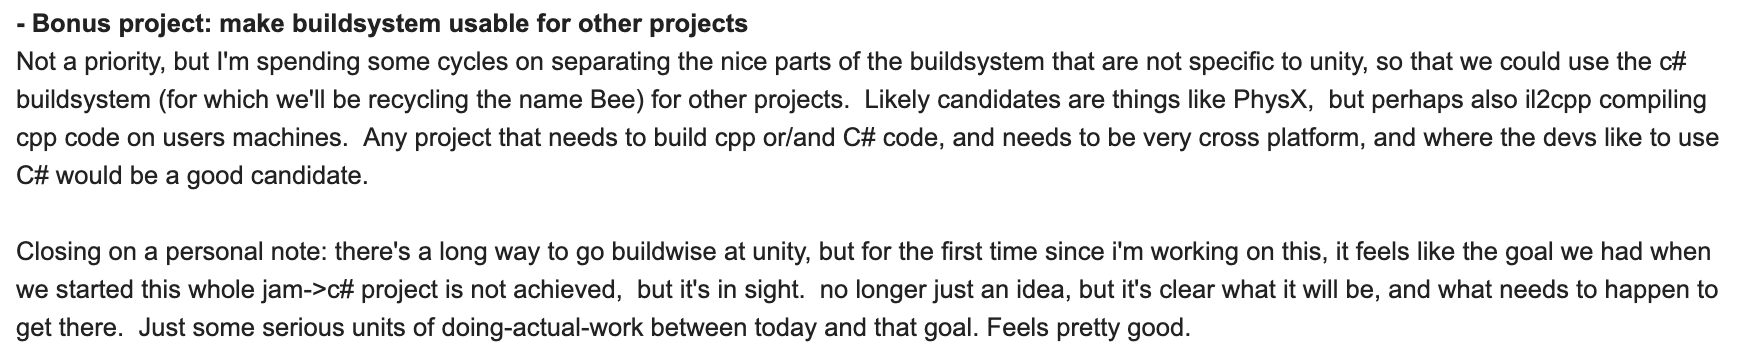
As a side effect, we also have this fairly nice build system (“Bee”) that we can use to build things outside of our
main code repository! So that’s also used to build various external libraries that we use, in various plugins/packages,
and I think even things like Project Tiny
use it for building actual final game code.
So all that’s nice! But oh geez, that also took a lot of time. Hence the blog post title.
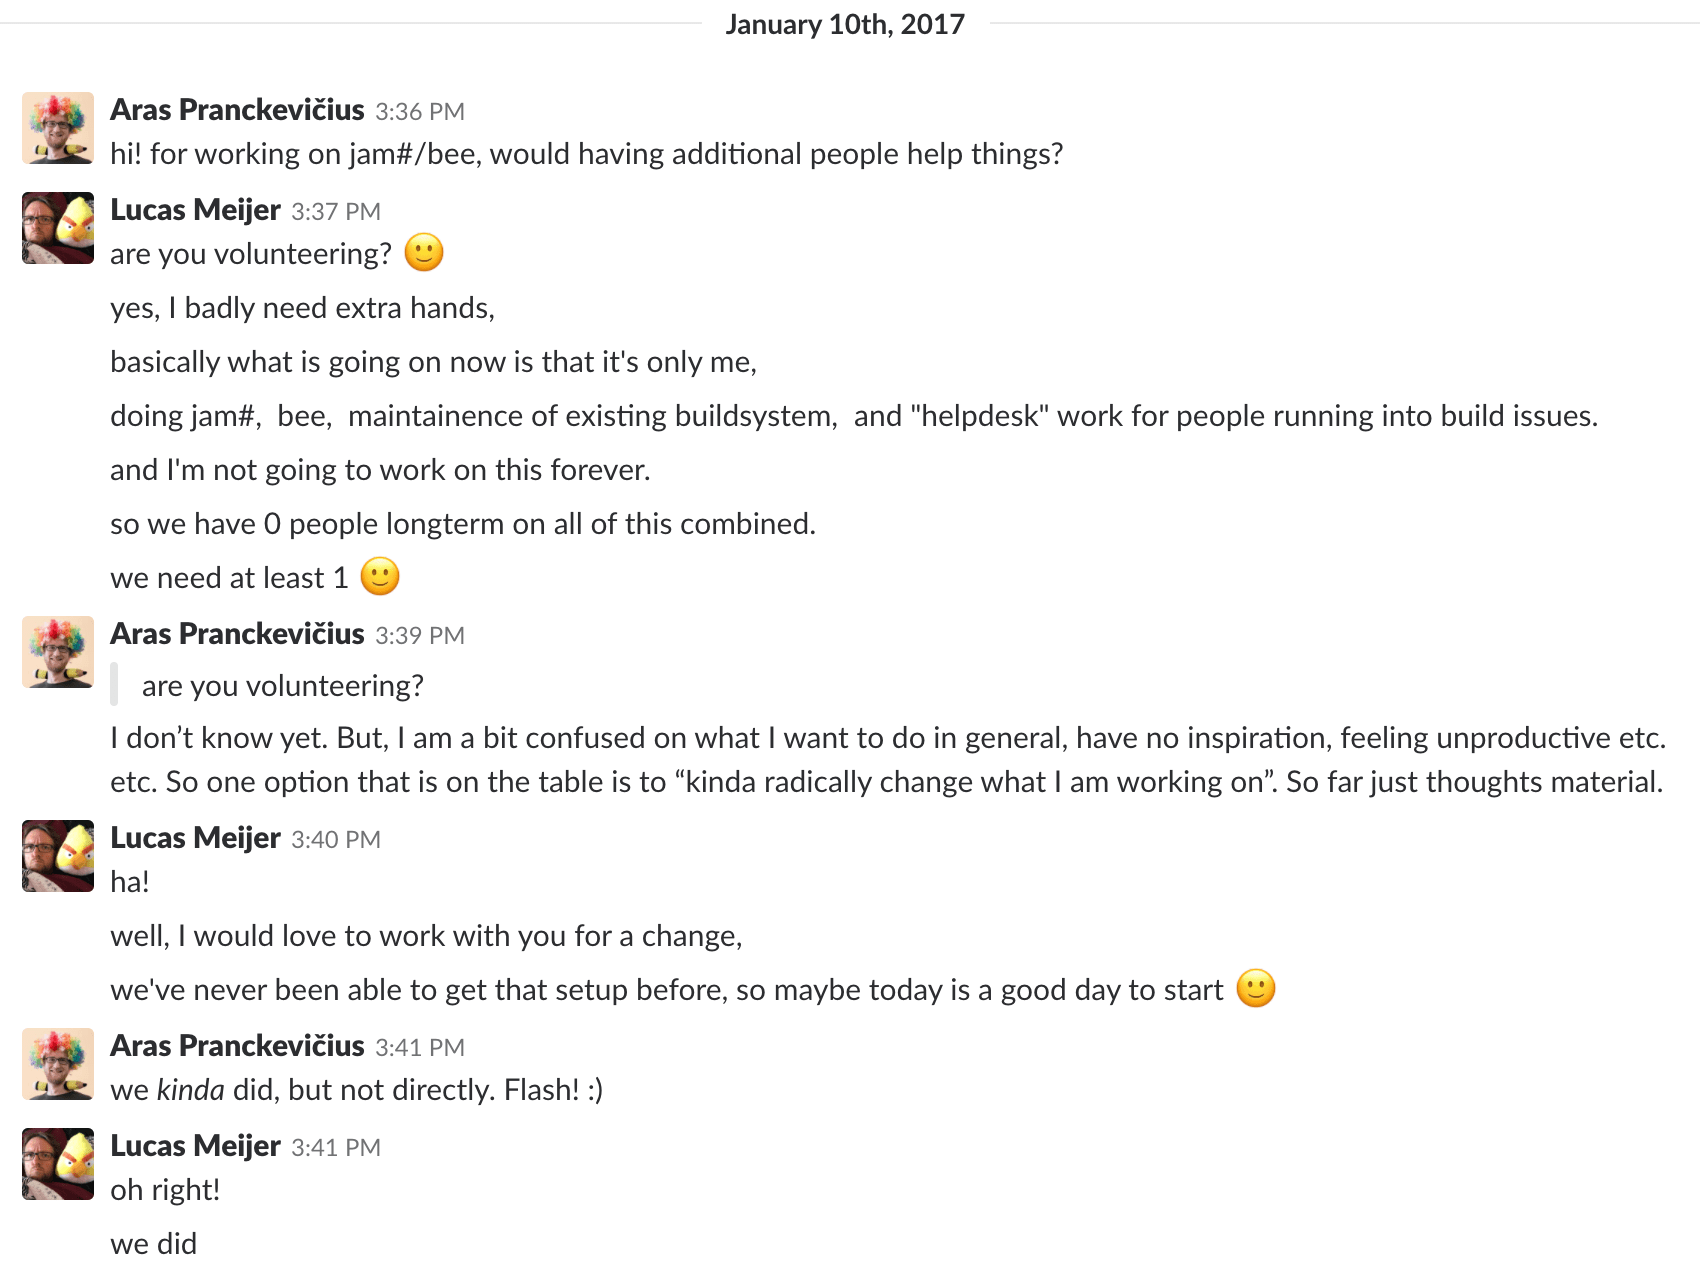
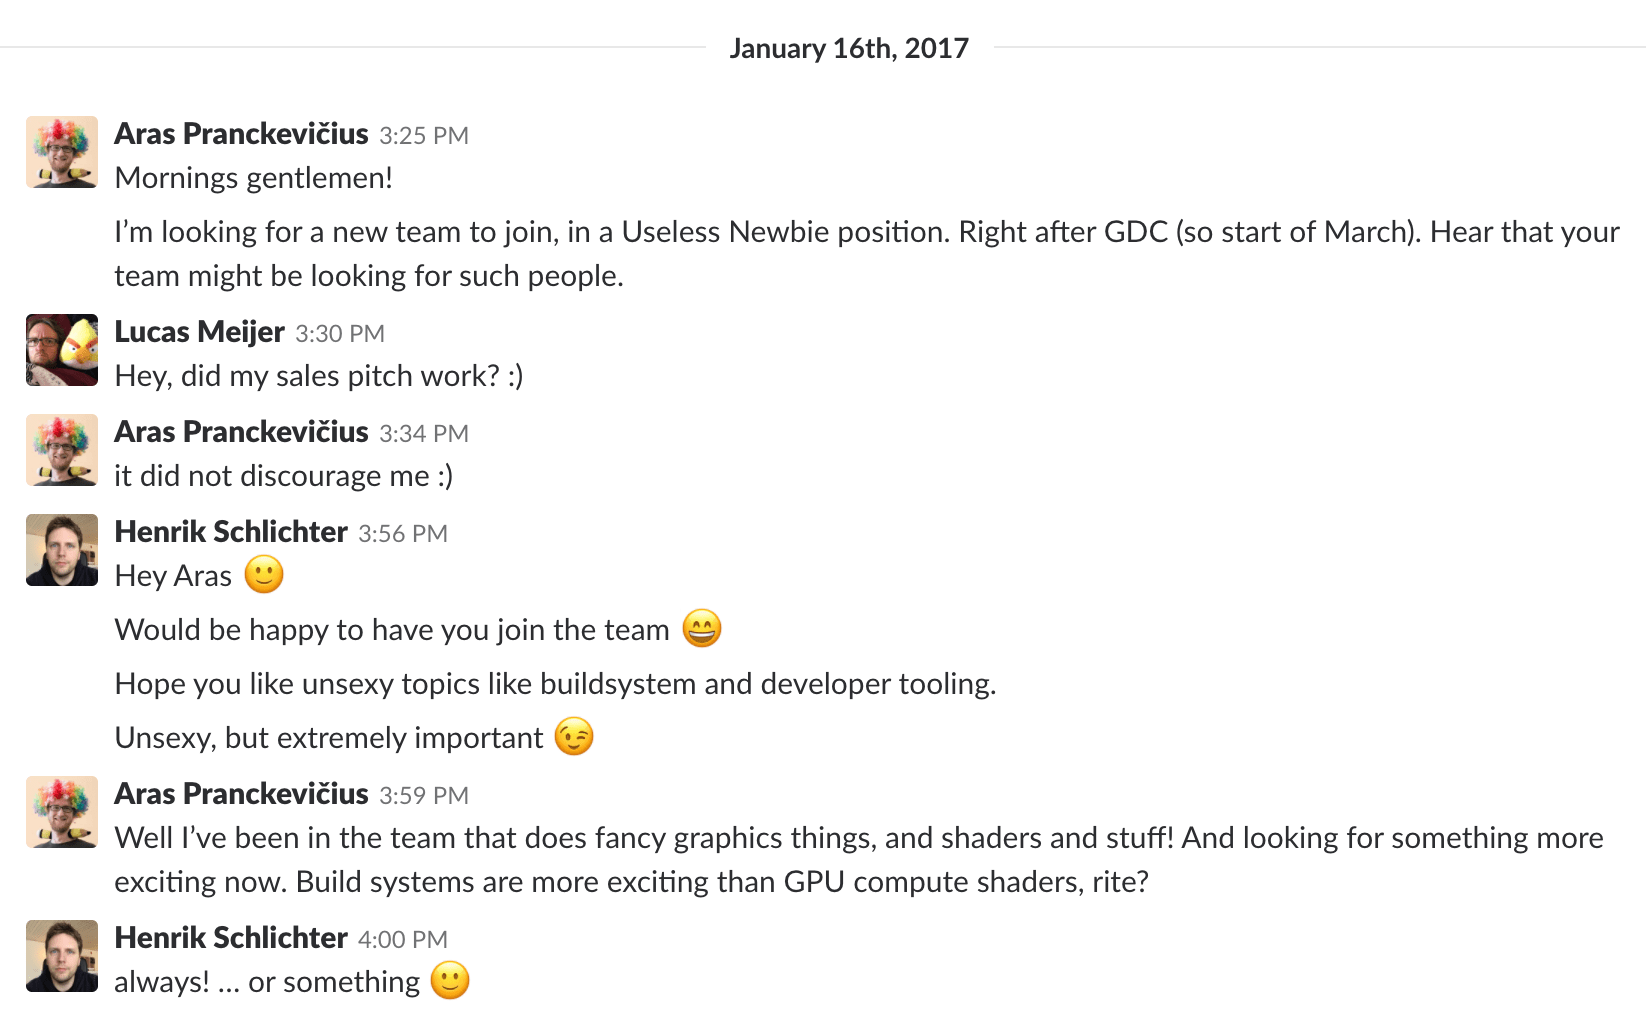
I switched to the “build system” team by having two extremely short chats:
…and then a lot more chats with graphics people and some others of course; but the above “hey could I join? yes!”
was kinda the whole of my “job interview” to the team.
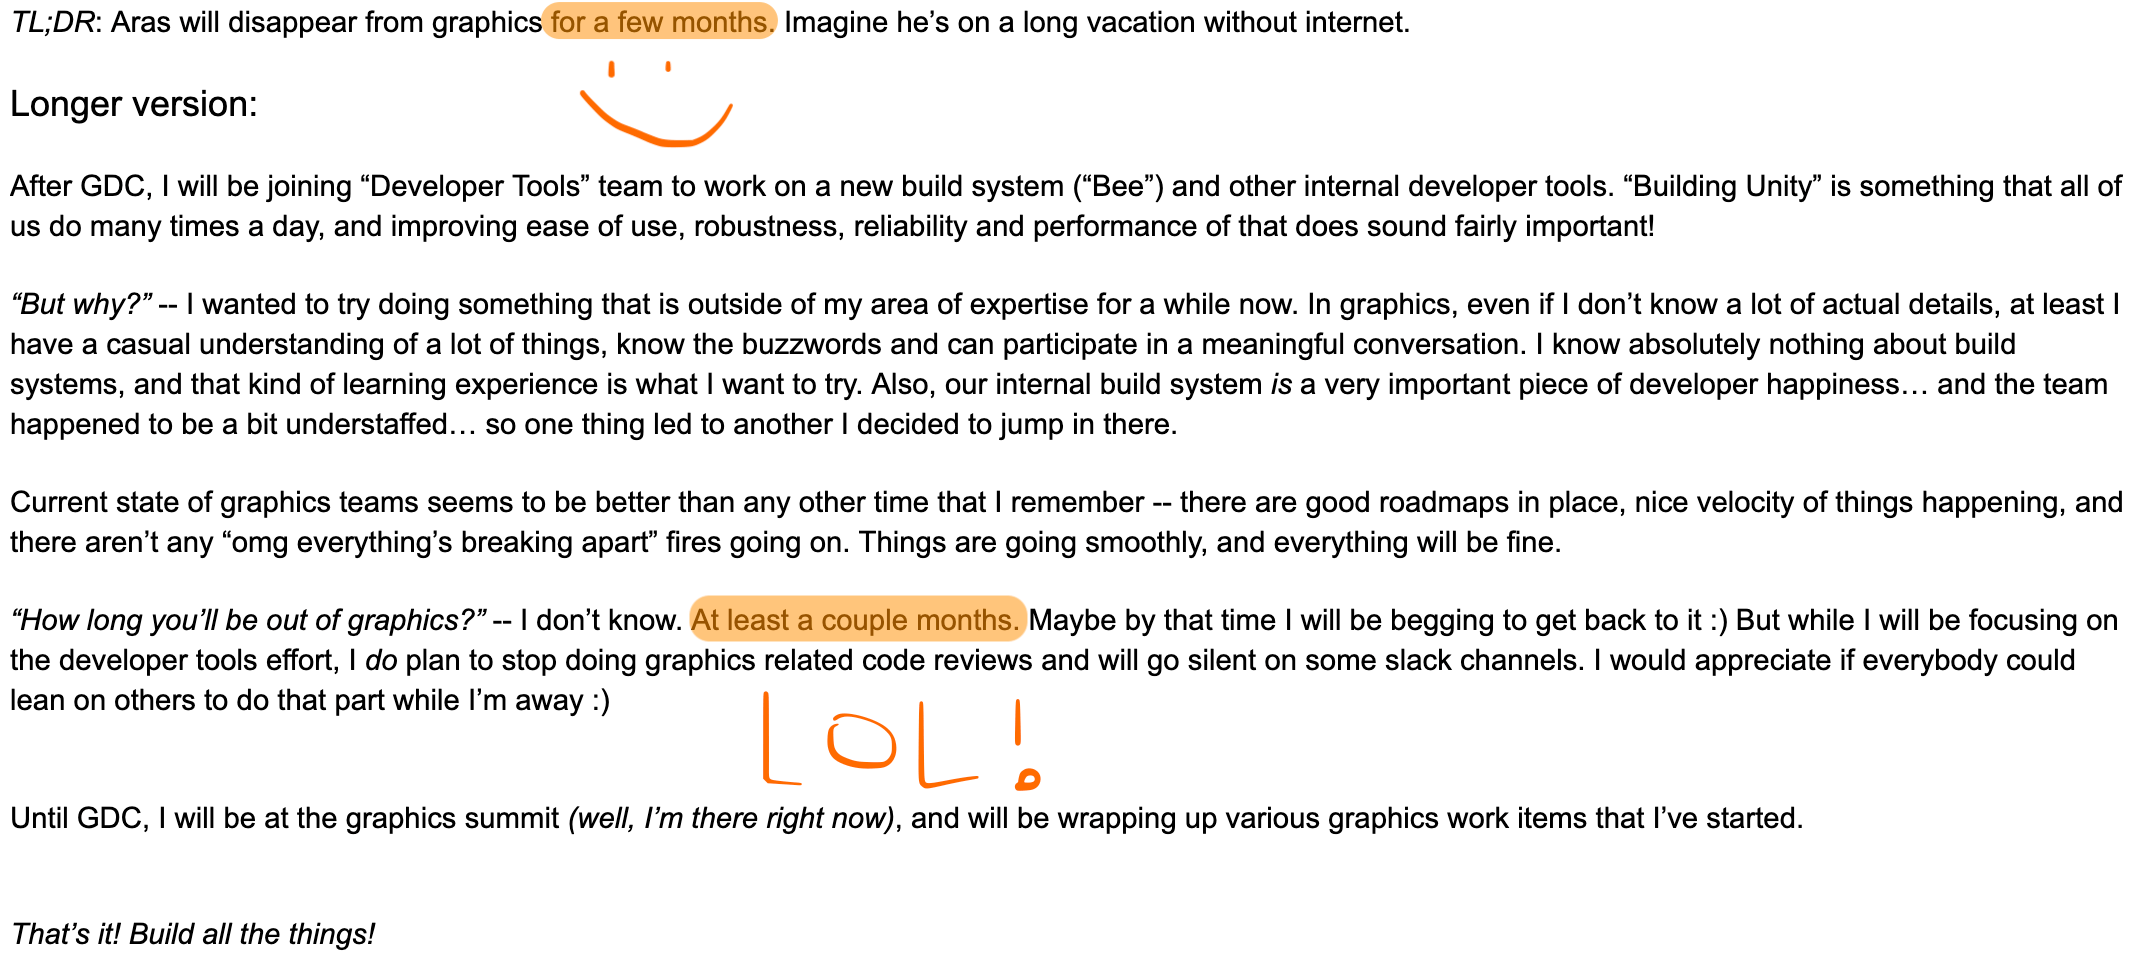
And then I sent out a “goodbye graphics” email:
I actually had no idea for how long I’m leaving, so I wrote “a couple months”. Well look, it’s been two years already!
A bunch of people have asked me either “ok so what is it that you actually do?”, or alternatively “surely the build work
must be done by now?”. To which I don’t have an excellent answer. My own work is a combination of:
Switching from “old build” (JamPlus) to “new build”
(Bee/Tundra) while not disrupting
the work of everyone around us.
Speeding up builds by cleaning up dependencies, includes, removing code.
Upgrading various platforms to more recent compiler versions; usually this is not hard but e.g. VS2010 -> VS2015
was pretty painful due to needed rebuilds of all 3rd party static libraries.
Improving UX of various aspects of build process: cleaner logs, better diagnostic messages, more intuitive build command
line arguments.
Support for people who have any build issues.
Fixing out various build issues that are accidentally introduced due to one reason or another. In a live codebase, it’s not
like you can fix all issues and be done with it :)
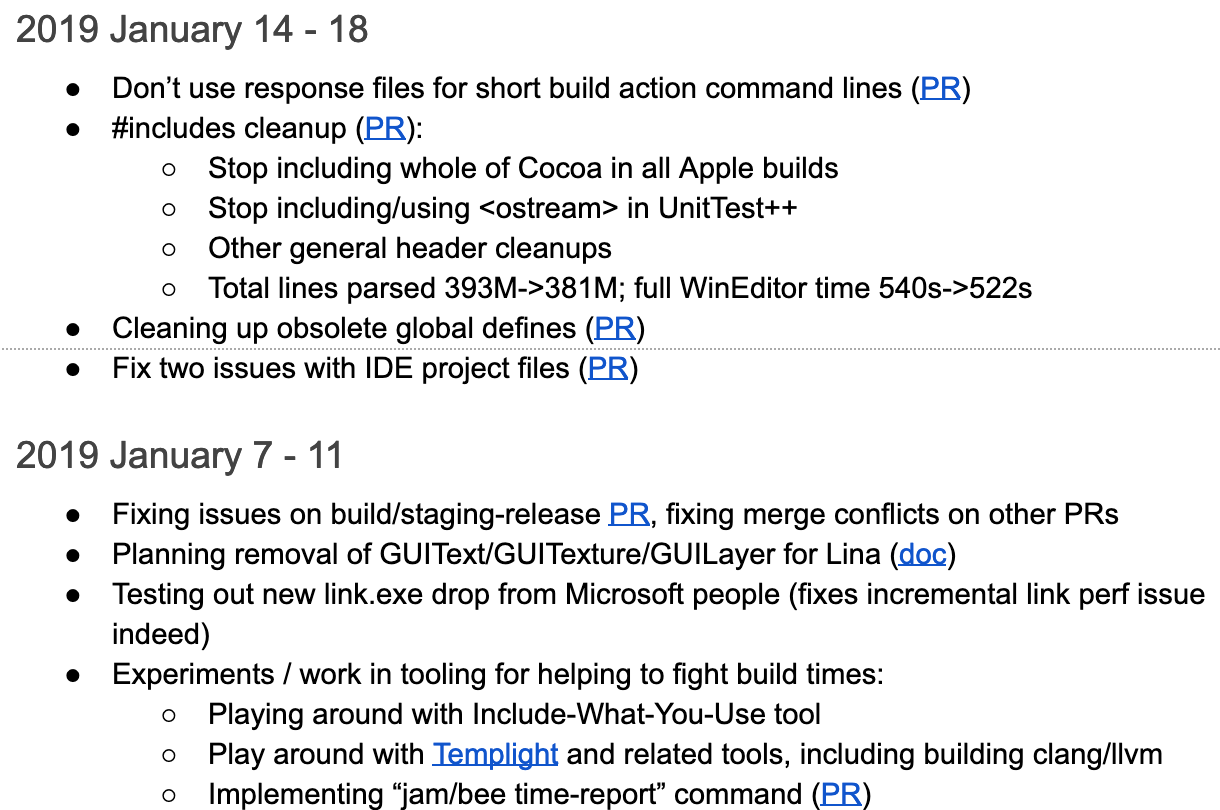
Typical work weeks might look like this – this is from my own “week logs” doc, took a screenshot of two recent ones:
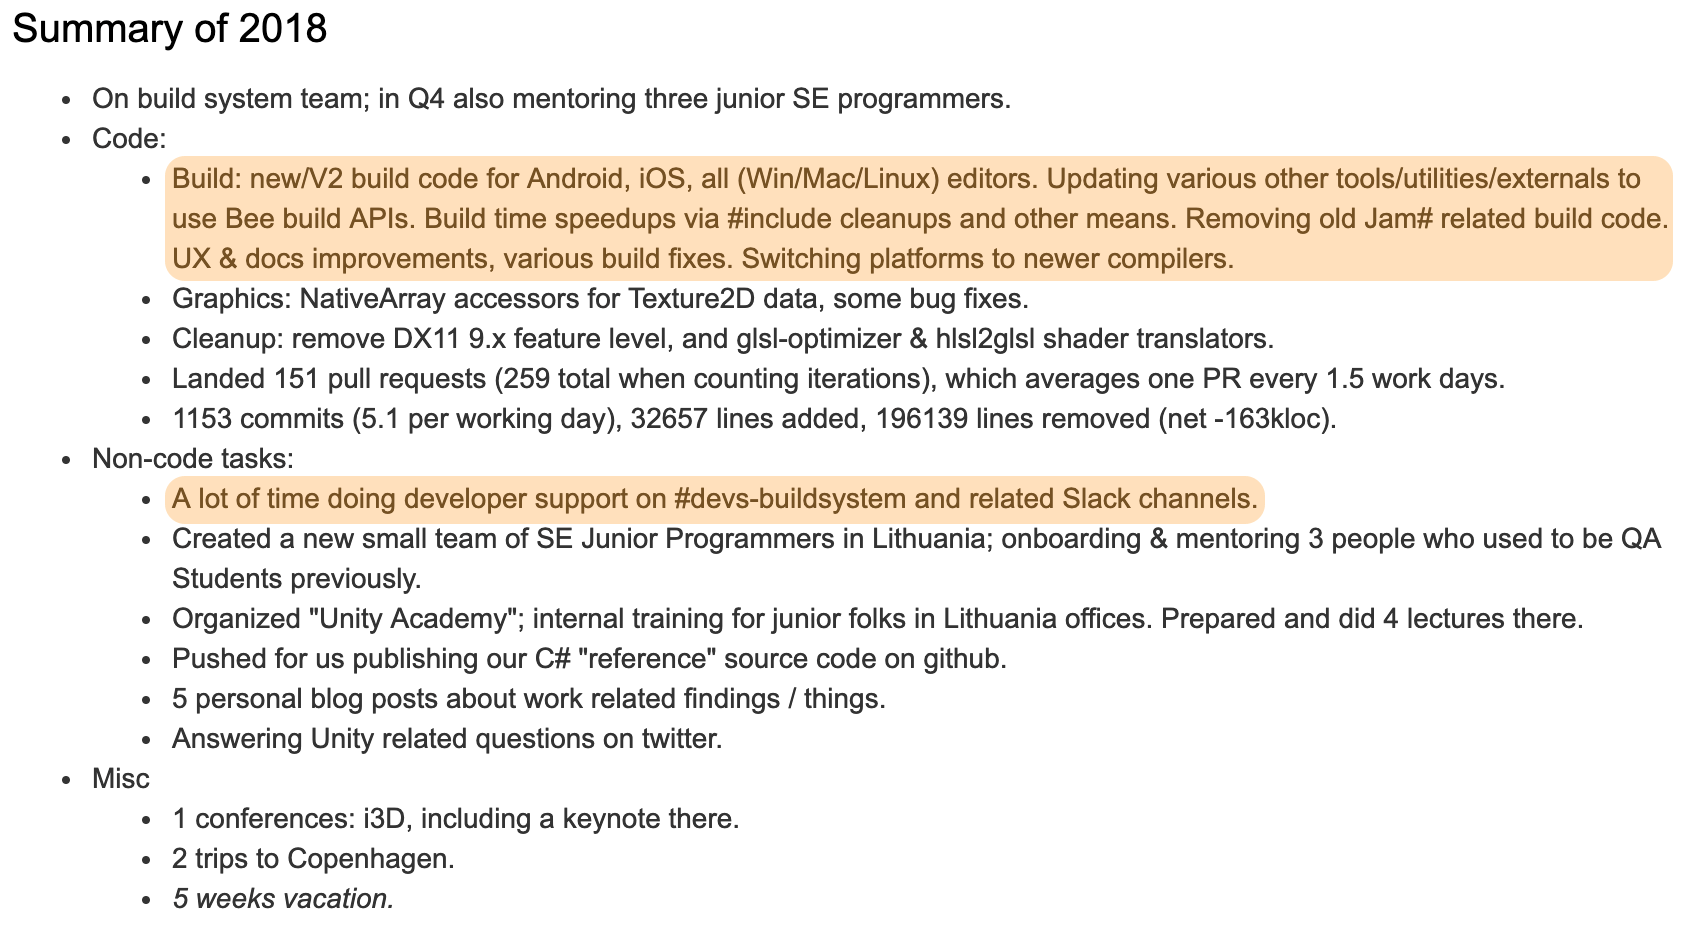
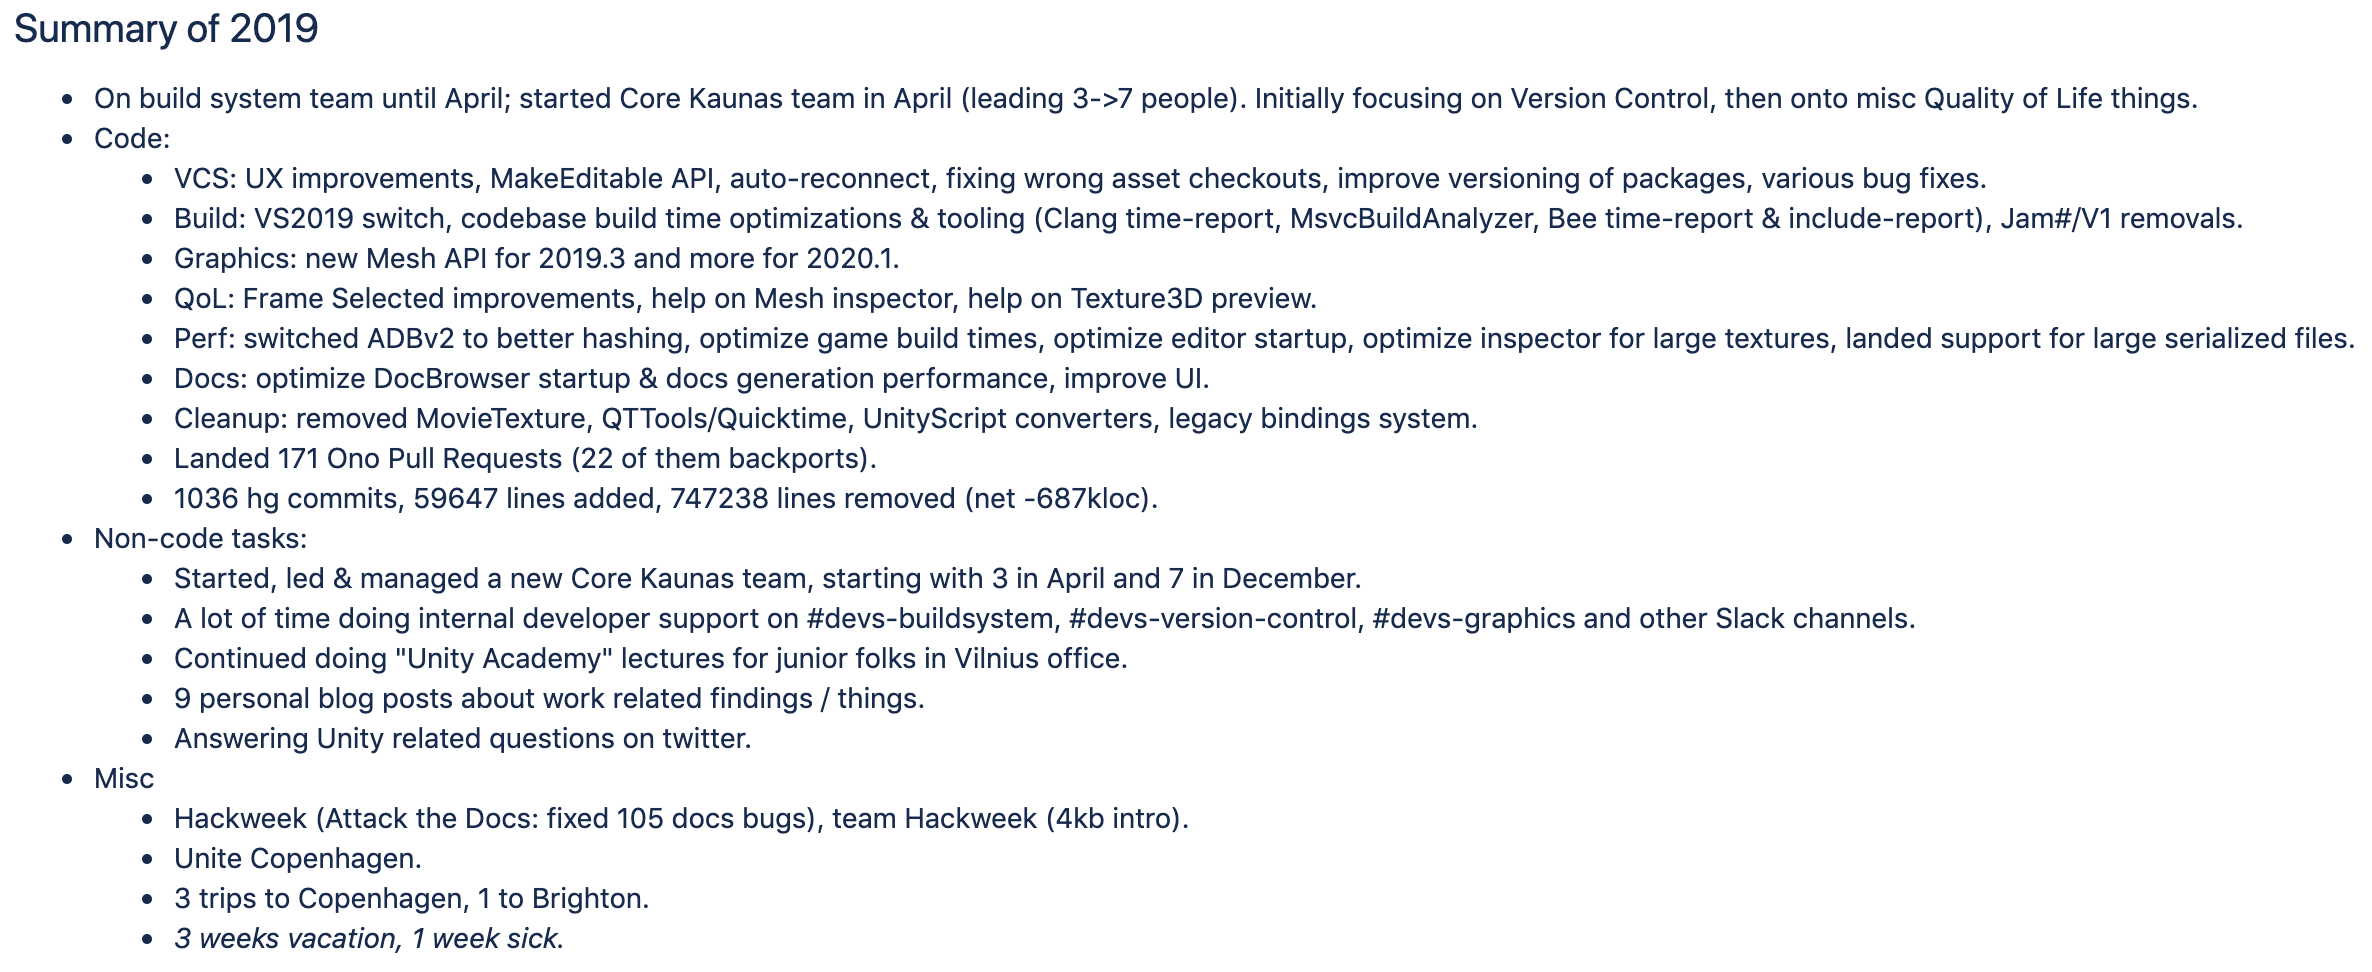
And “what I did during last year” summary looks like this. I’ve highlighted buildsystem-related work in there; the rest is
“everything else”:
It doesn’t feel like “I got a lot done”, but doesn’t feel terrible either.
Anyway! Most of build stuff is fairly typical, but during last year our team has build some pretty neat tools
that I wanted to write about. So here they are!
Neat Build Tools
In our main code repository the build entry point script is called jam (it does not use Jam anymore, but backwards compat
with what people are used to type…). In some of our new code repositories (for DOTS/ECS and
some packages) the build entry point would
be called bee; both have the same tools, the examples below will be using jam entry point.
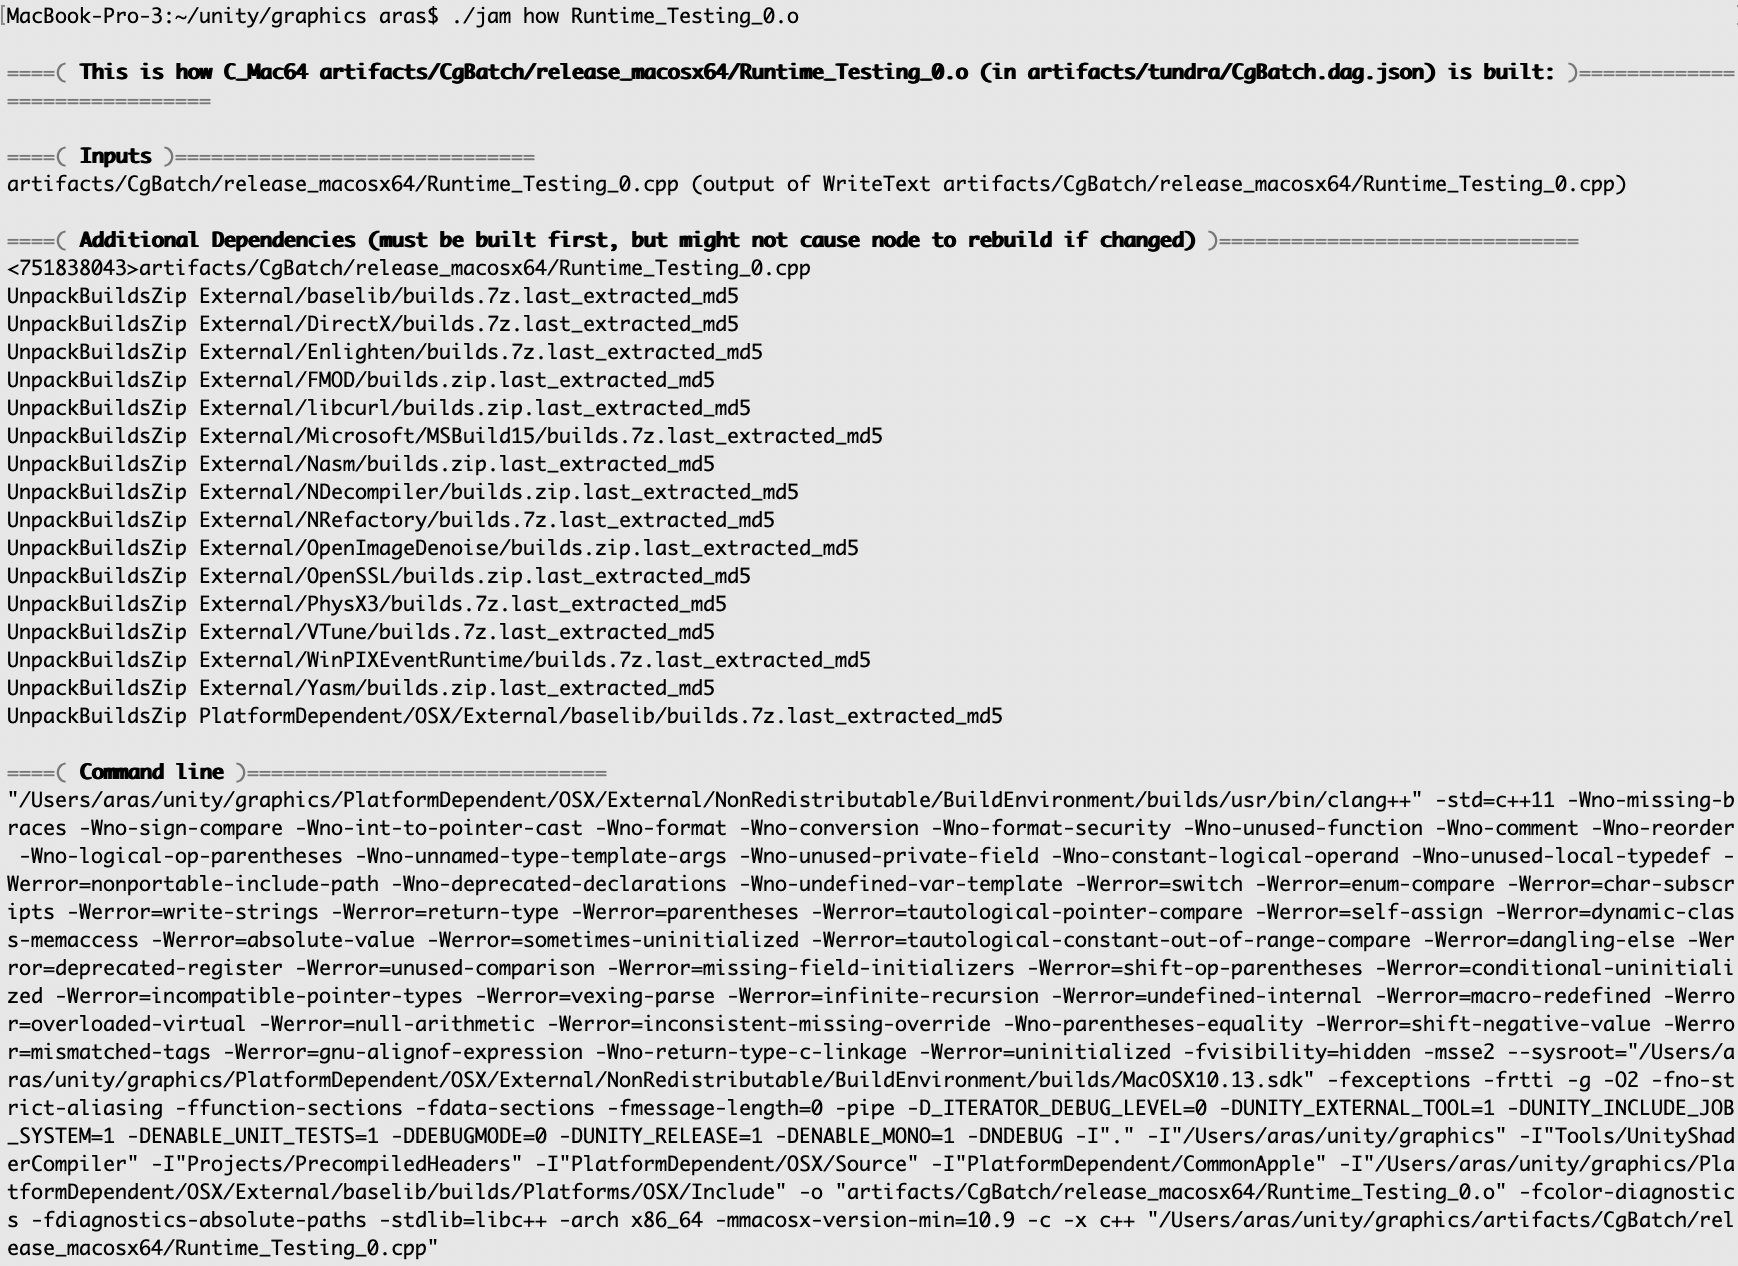
How exactly X is built?
jam how substring-of-something finds the most relevant build step (e.g. object file compile, executable link, file copy, whatever)
and tells exactly how it is built. This is mostly useful to figure out exact compiler command line flags, and dependencies.
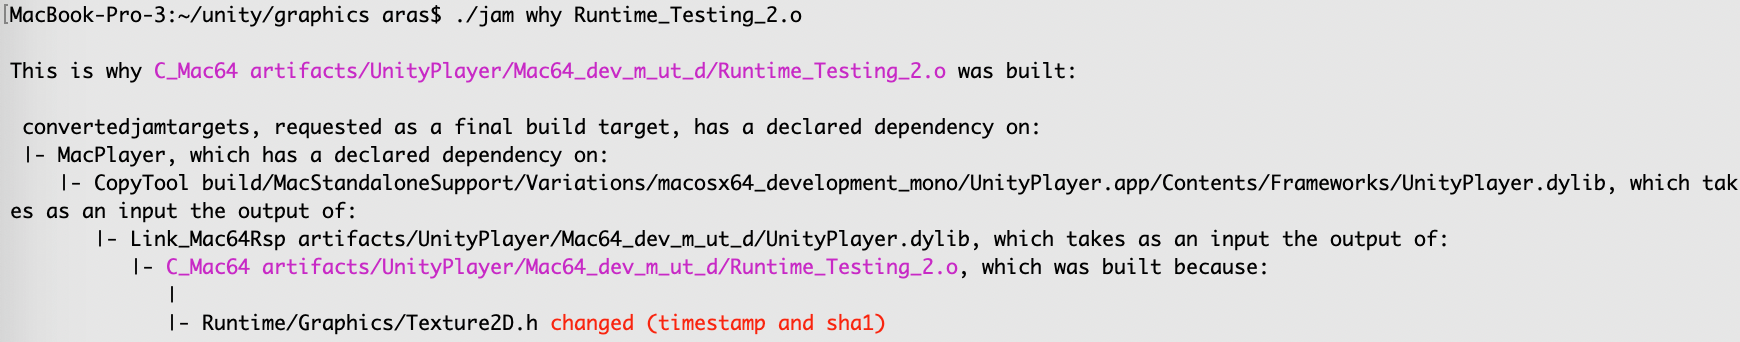
Why X got rebuilt?
If one is wondering why something gets rebuilt (recompiled, re-copied, relinked, etc.), jam why substring-of-something tells that:
Every build produces a “log of what got done and why” file, and the why tool looks at that to do the report.
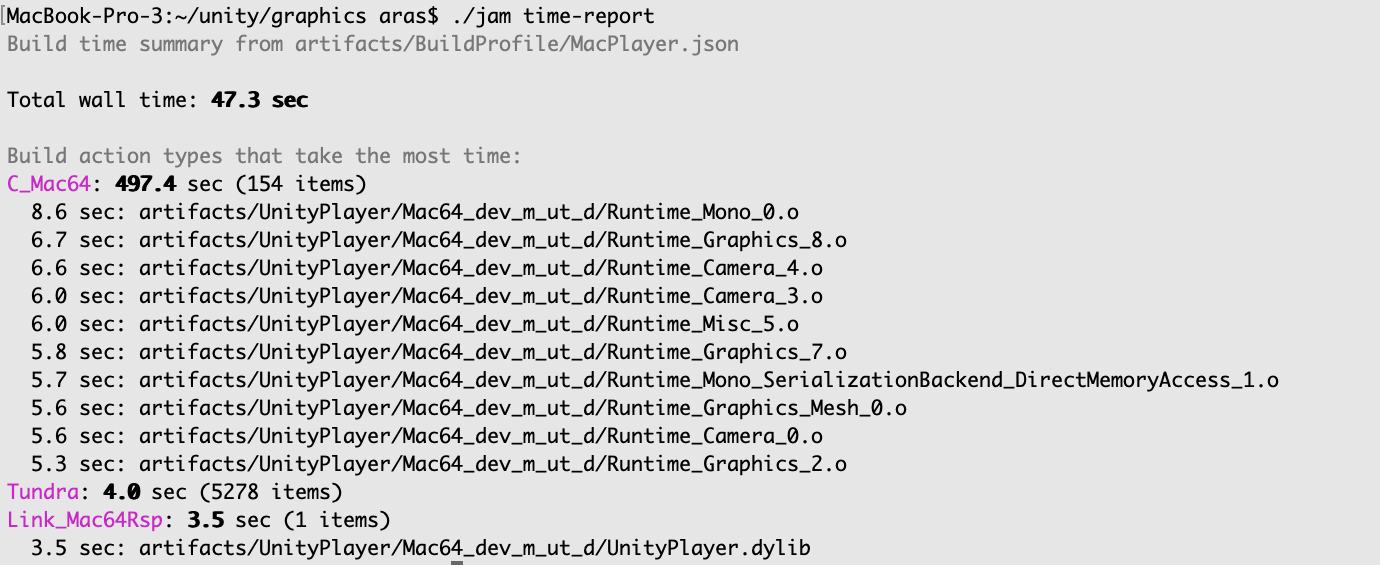
Where time was spent during the build?
I added Chrome Tracing profiler output support to both JamPlus and Tundra (see previous blog post),
and while that is all good and nice, sometimes what you want is just a “very quick summary”. Enter jam time-report. It shows
top slowest action “types”, and top 10 items within each type:
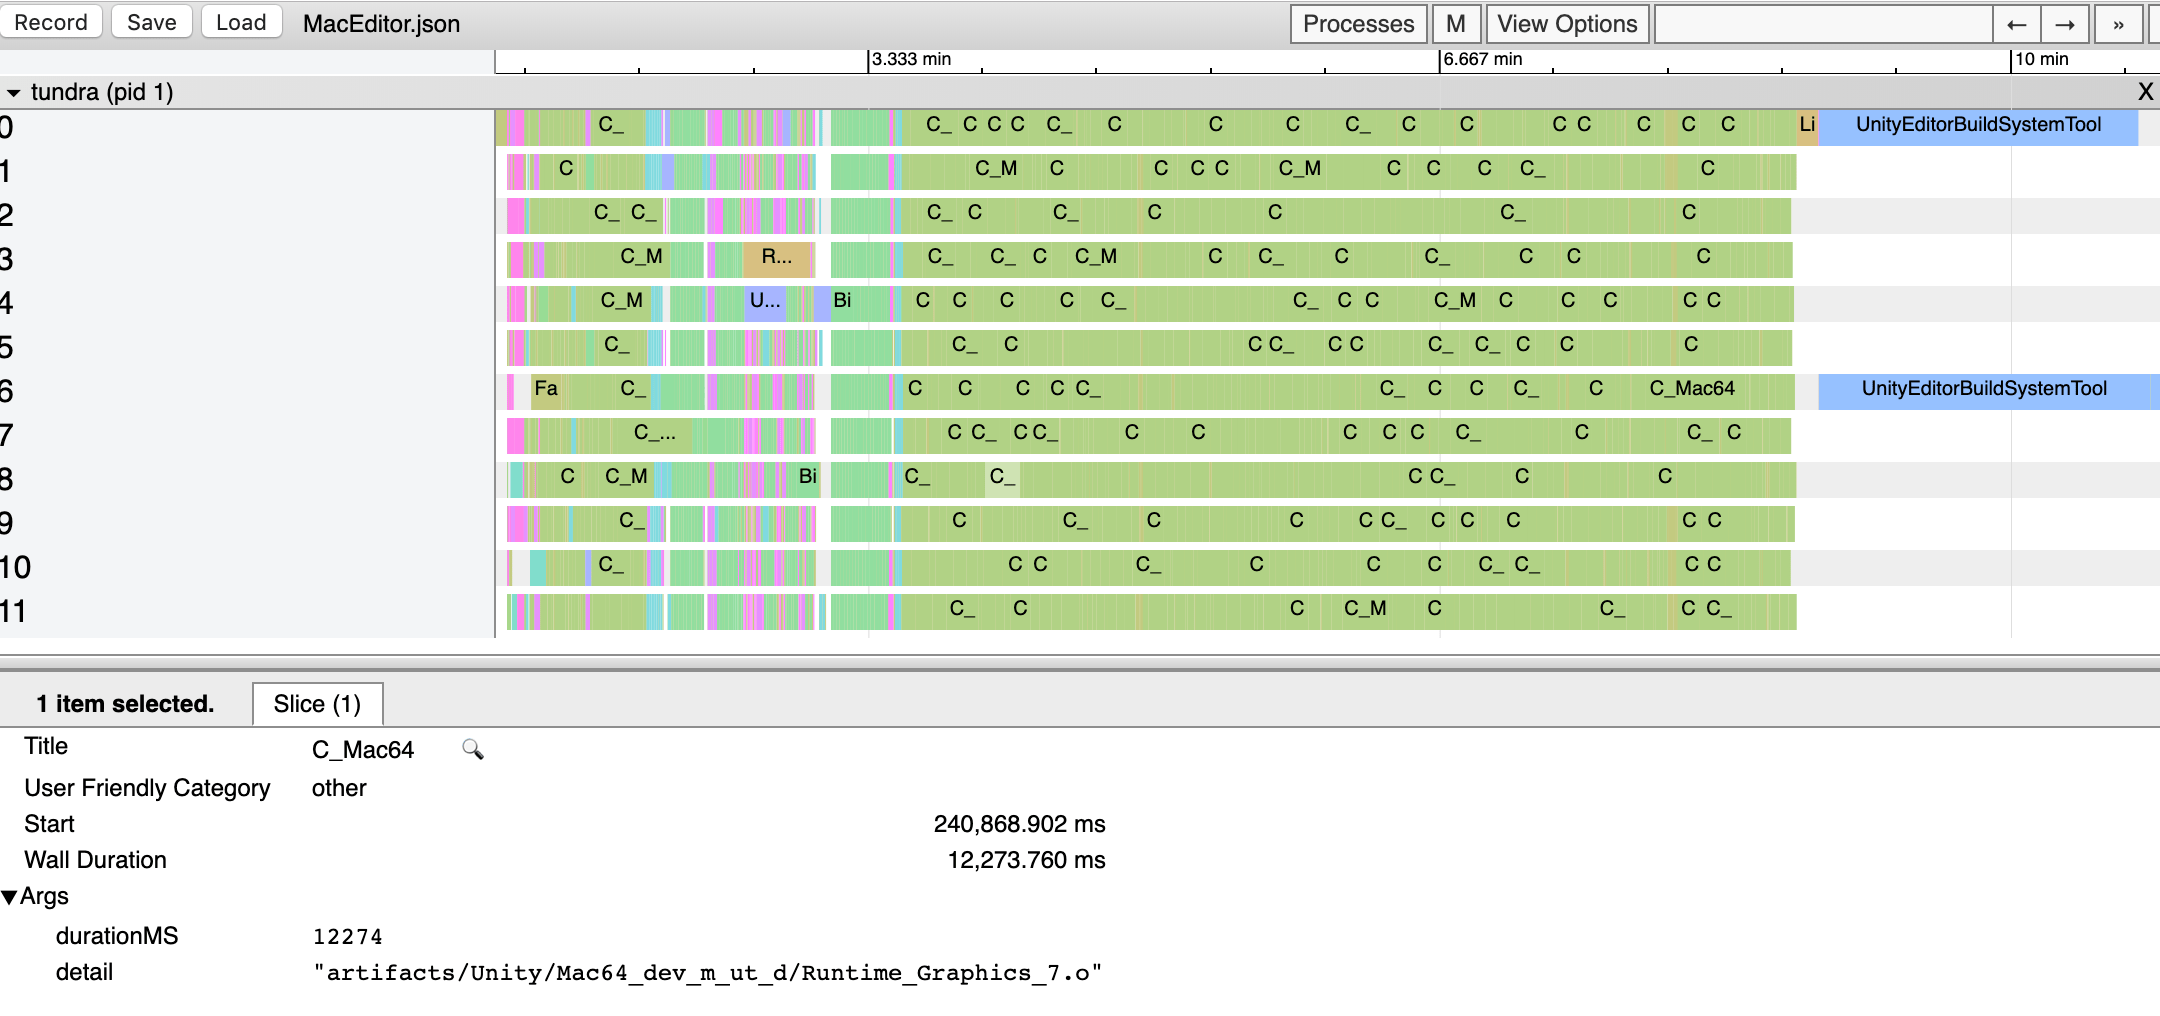
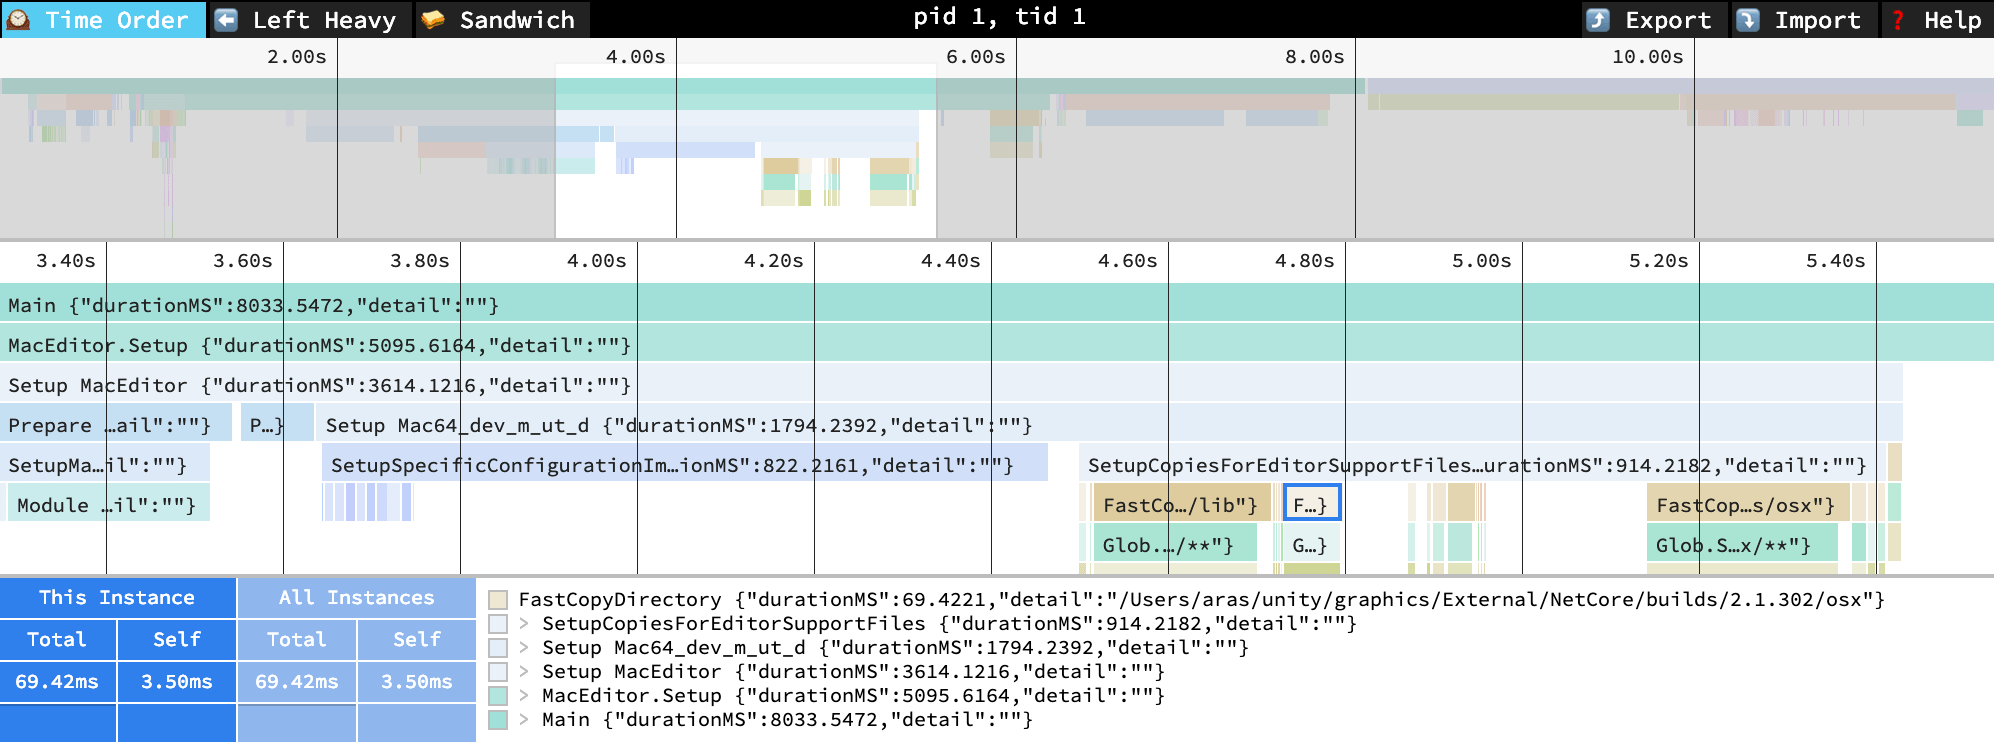
Of course if you want more detail, you can drag the profiler output file into chrome://tracing or speedscope.app
and browse it all:
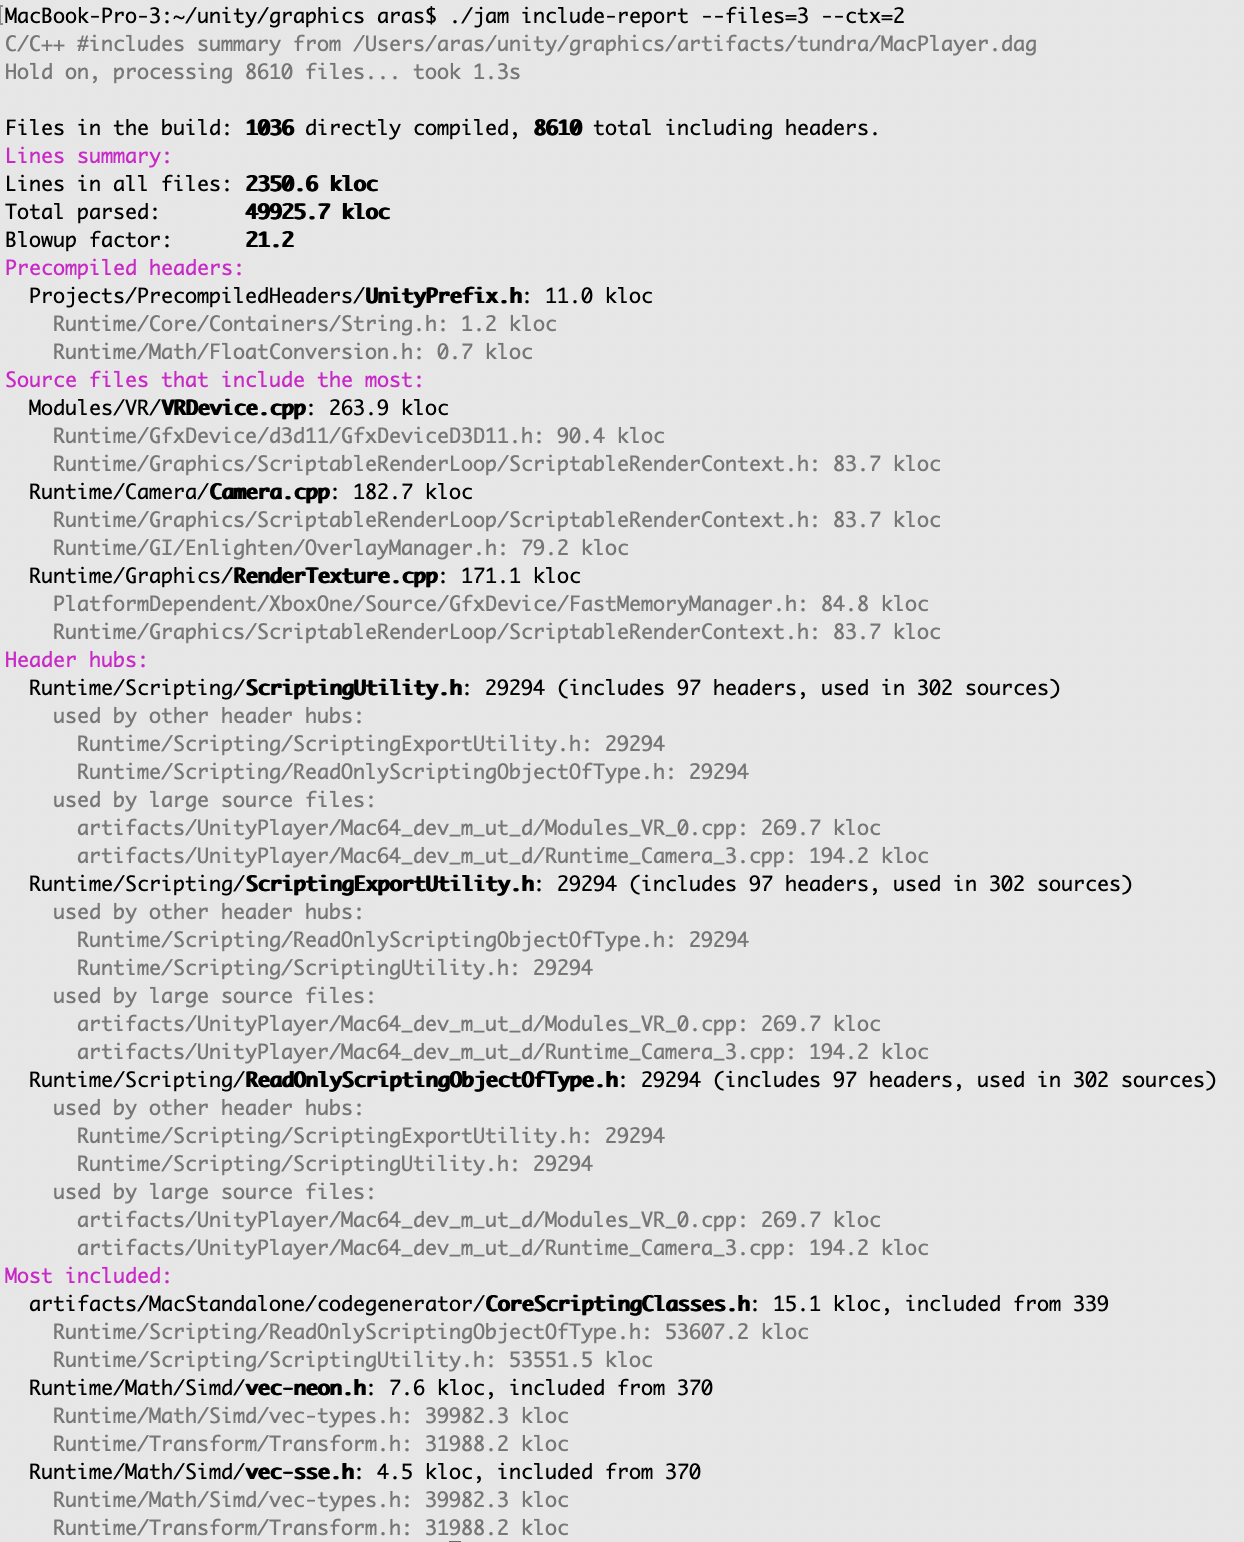
What are the worst C/C++ header includes?
Since during the build Tundra scans source files for #include dependencies, we can use that to do some analysis / summary! jam include-report
shows various summaries of what might be worth untangling:
It is very similar to Header Hero that I used before for include optimization.
But I wanted something that would see actual includes instead of the approximation that Header Hero does, and
something that works on a Mac, and something that would be built-in in all our builds. So there!
This is all! I’ll get back to reviewing some pull requests now.
 Happy to report that I managed to delete 747 thousand lines of code last year! That is a bit cheating though,
since half a million of that was versioned Quicktime headers, and turns out they are huge. Most of other deletions
were things like “remove the old C#<->C++ bindings system”, which is no longer used. Anyway, I like deleting code, and this year was good.
Happy to report that I managed to delete 747 thousand lines of code last year! That is a bit cheating though,
since half a million of that was versioned Quicktime headers, and turns out they are huge. Most of other deletions
were things like “remove the old C#<->C++ bindings system”, which is no longer used. Anyway, I like deleting code, and this year was good.