A case of slow Visual Studio project open times
I was working on some new code to generate Visual Studio solution/project files, and that means regenerating the files and checking them in VS a lot of times. And each time, it felt like VS takes ages to reopen them! This is with Visual Studio 2017, which presumably is super-turbo optimized in project open performance, compared to previous versions.
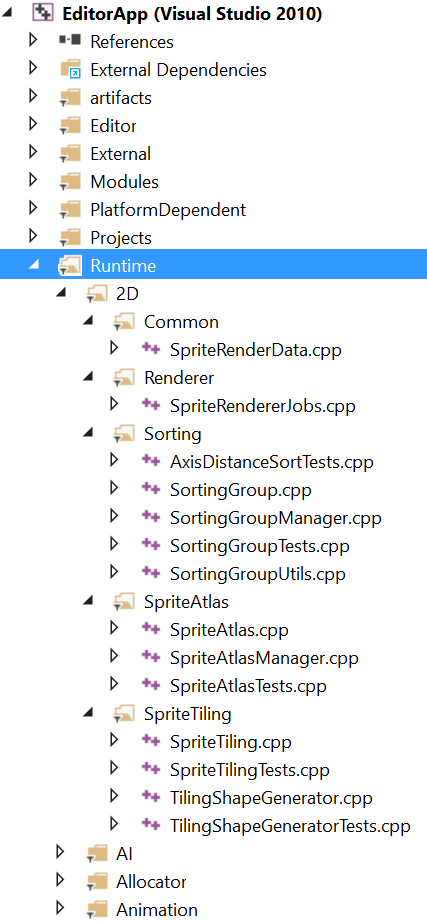
The VS solution I’m working on has three projects, with about 5000 source files in each, grouped into 500 folders (“filters” as VS calls them) to reflect hierarchy on disk. Typical stuff.
On my Core i7-5820K 3.3GHz machine VS2017 takes 45 seconds to open that solution first time after rebuilding it, and about 20 seconds each time I open it later.
That’s not fast at all! What is going on?!
Time for some profiling
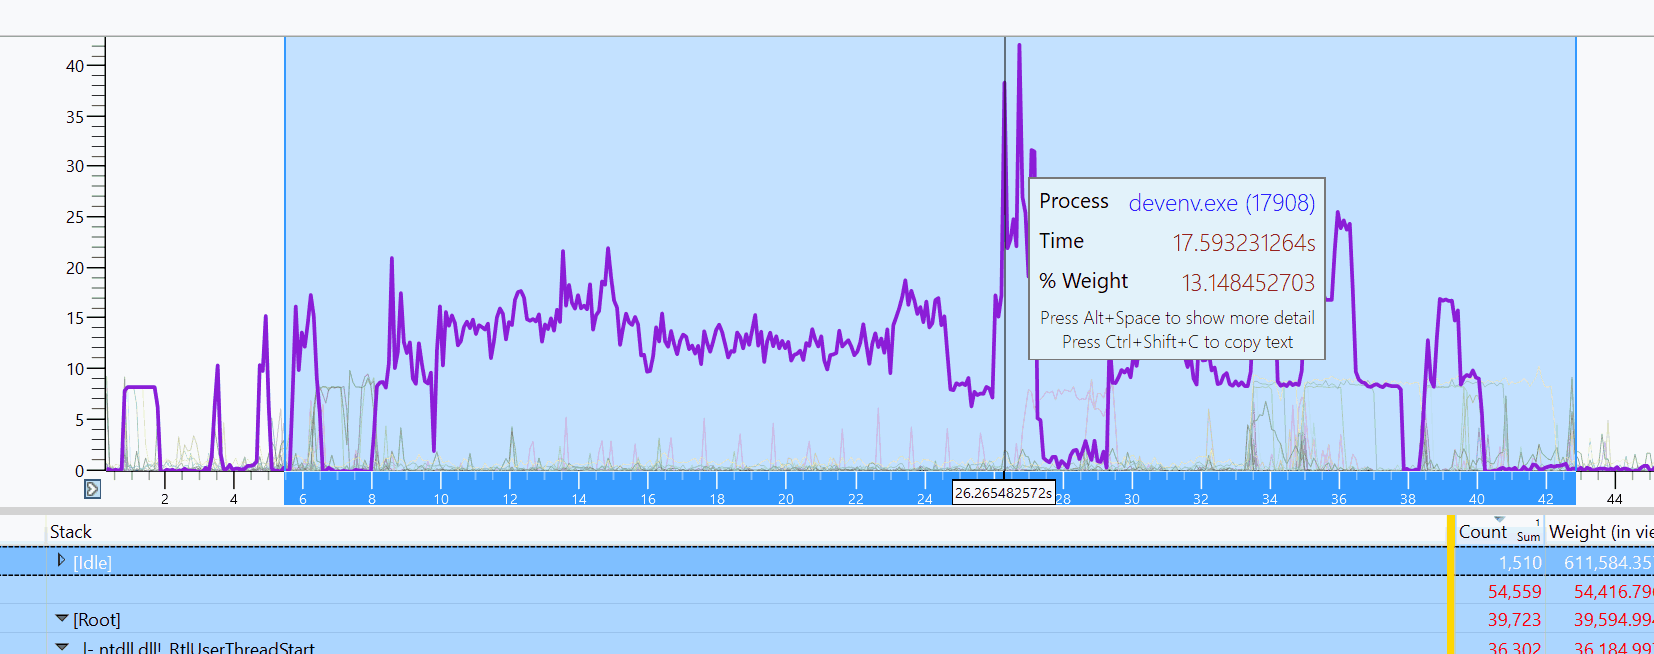
Very much like in the “slow texture importing” blog post, I fired up windows performance recorder, and recorded everything interesting that’s going on while VS was busy opening up the solution file.
Predictably enough, VS (devenv.exe) is busy during most of the time of solution load:
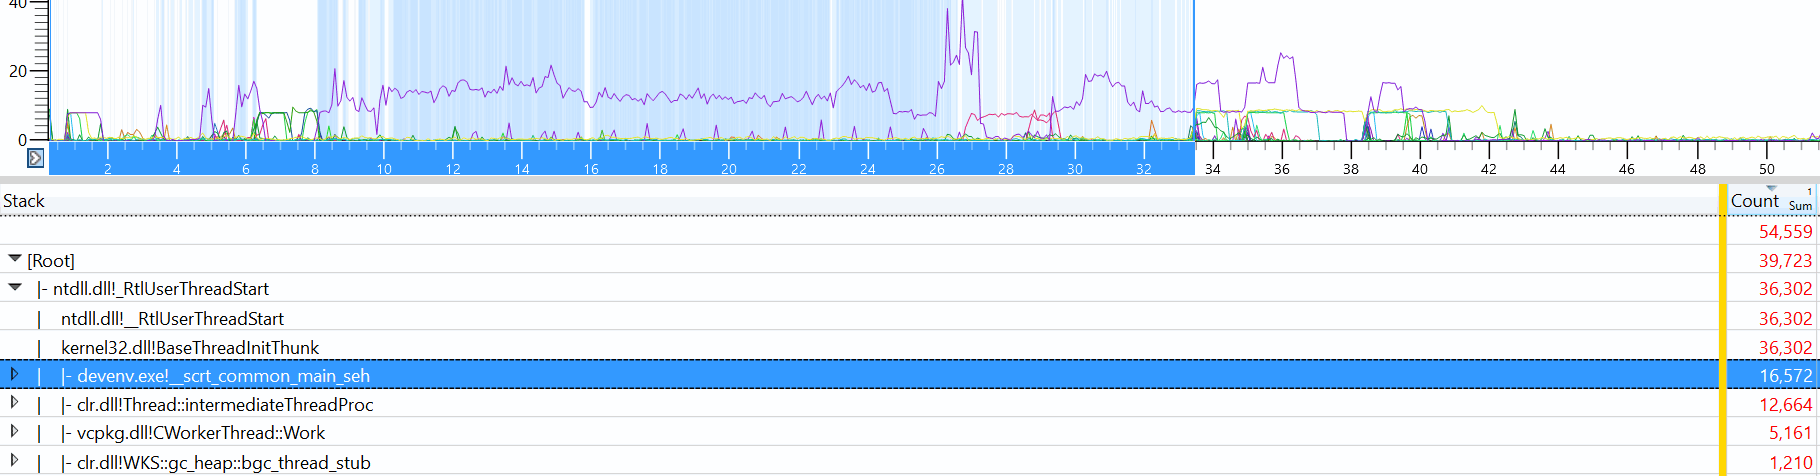
Let’s dig into the heaviest call stacks during this busy period. Where will this puppy with 16k samples lead to?
First it leads us through the layers of calls, which is fairly common in software. It’s like an onion; with a lot of layers. And you cry as you peel them off :)
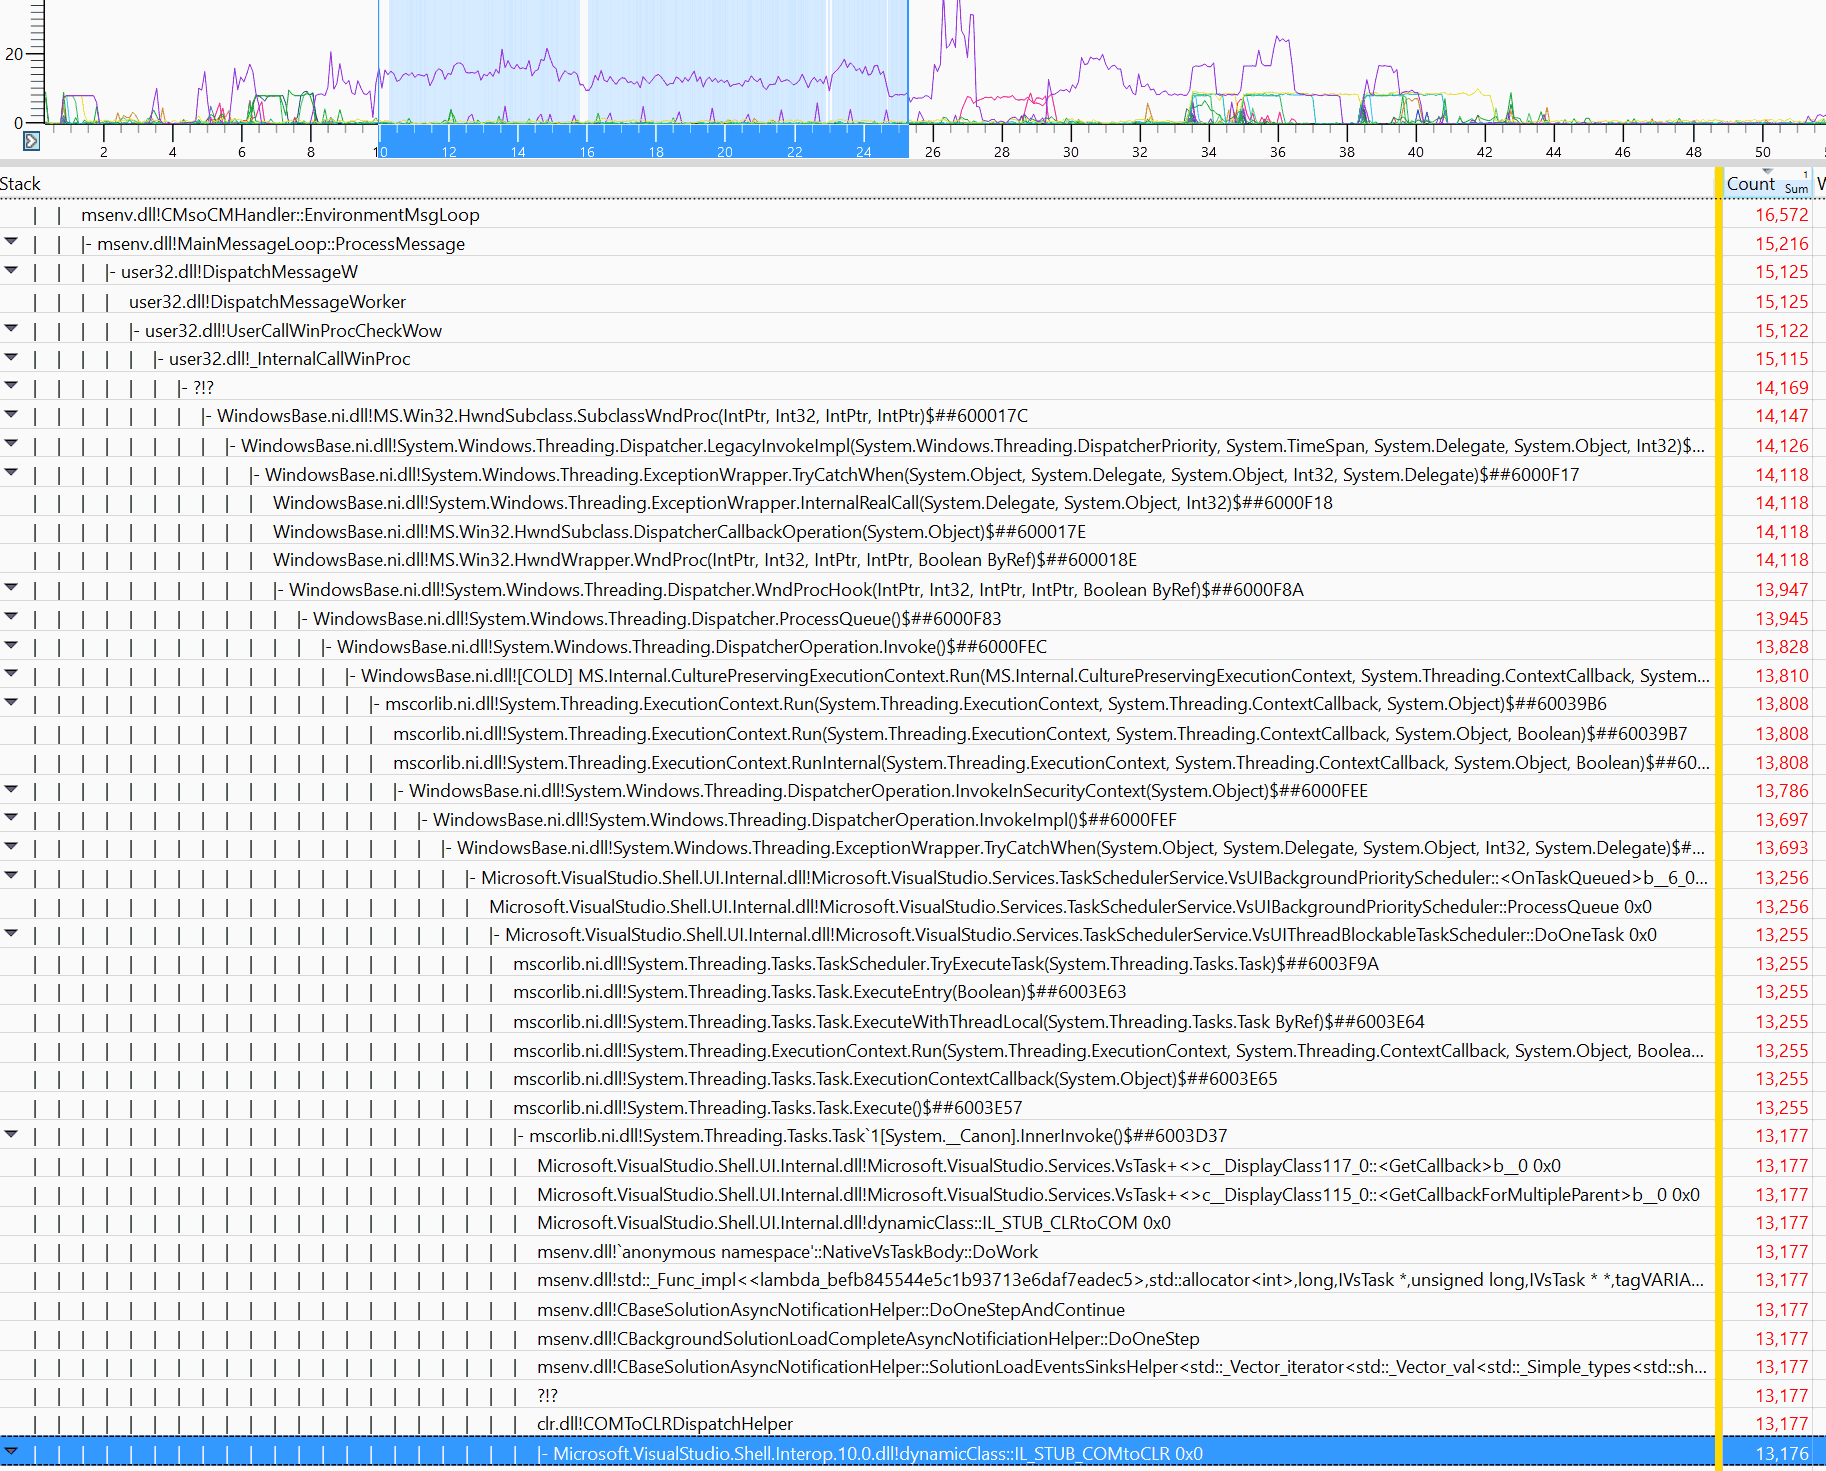
So that is Visual Studio, seemingly processing windows messages, into some thread dispatcher, getting into some UI background task scheduler, and into some async notifications helper. We are 20 stack frames in, and did not get anywhere so far, besides losing some profiling samples along the way. Where to next?
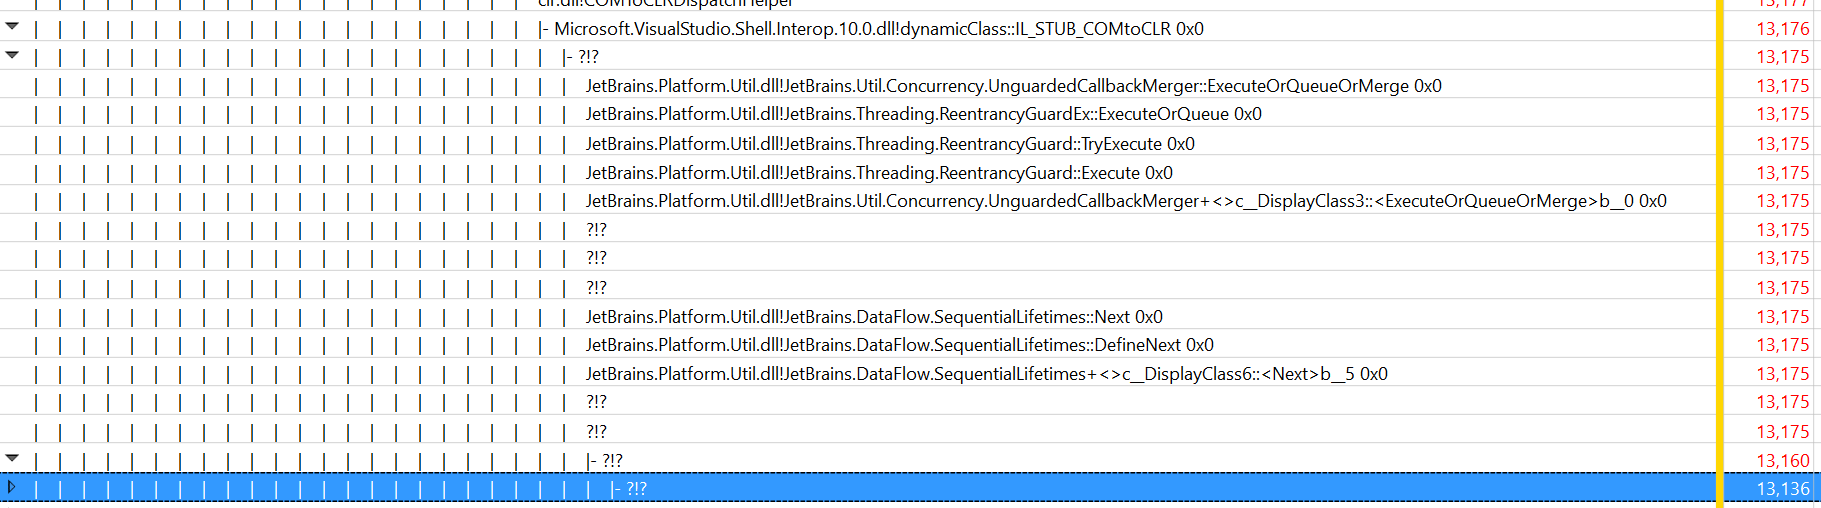
A-ha! Further down, it is something from JetBrains. I do have ReSharper (2016.3.2) installed in my VS… Could it be that R# being present causes the slow project load times (at least in VS2017 with R# 2016.3)? Let’s keep on digging for a bit!
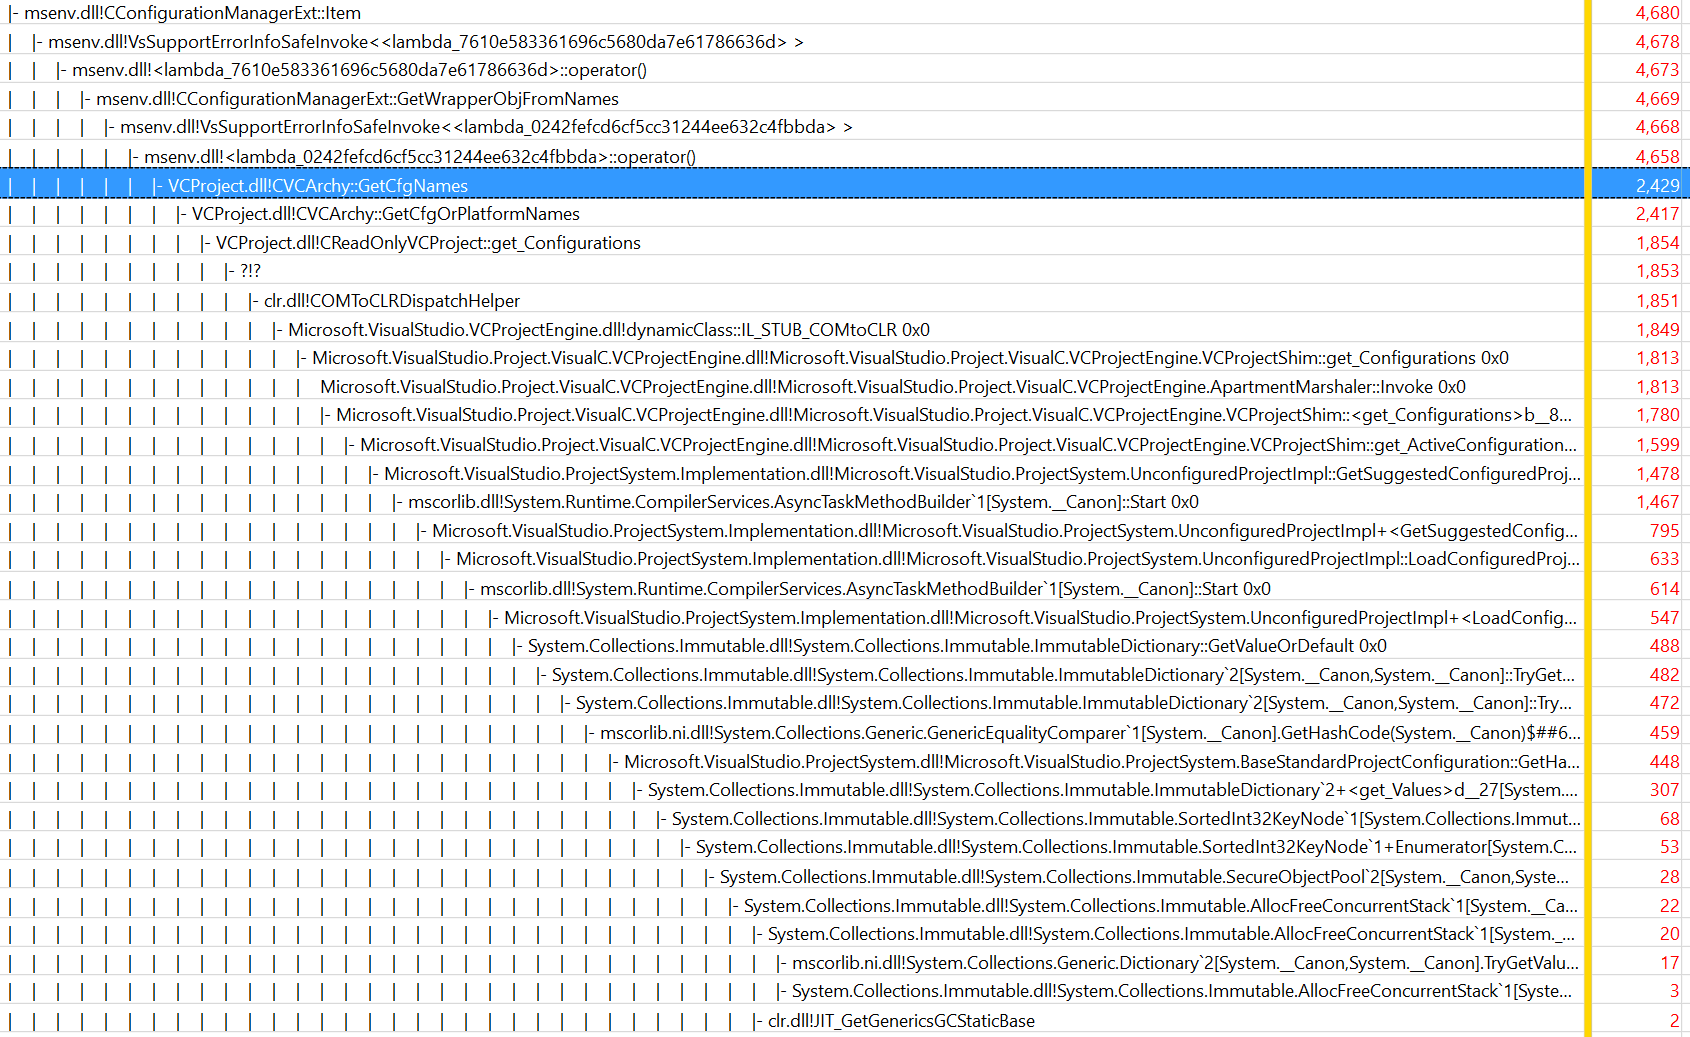
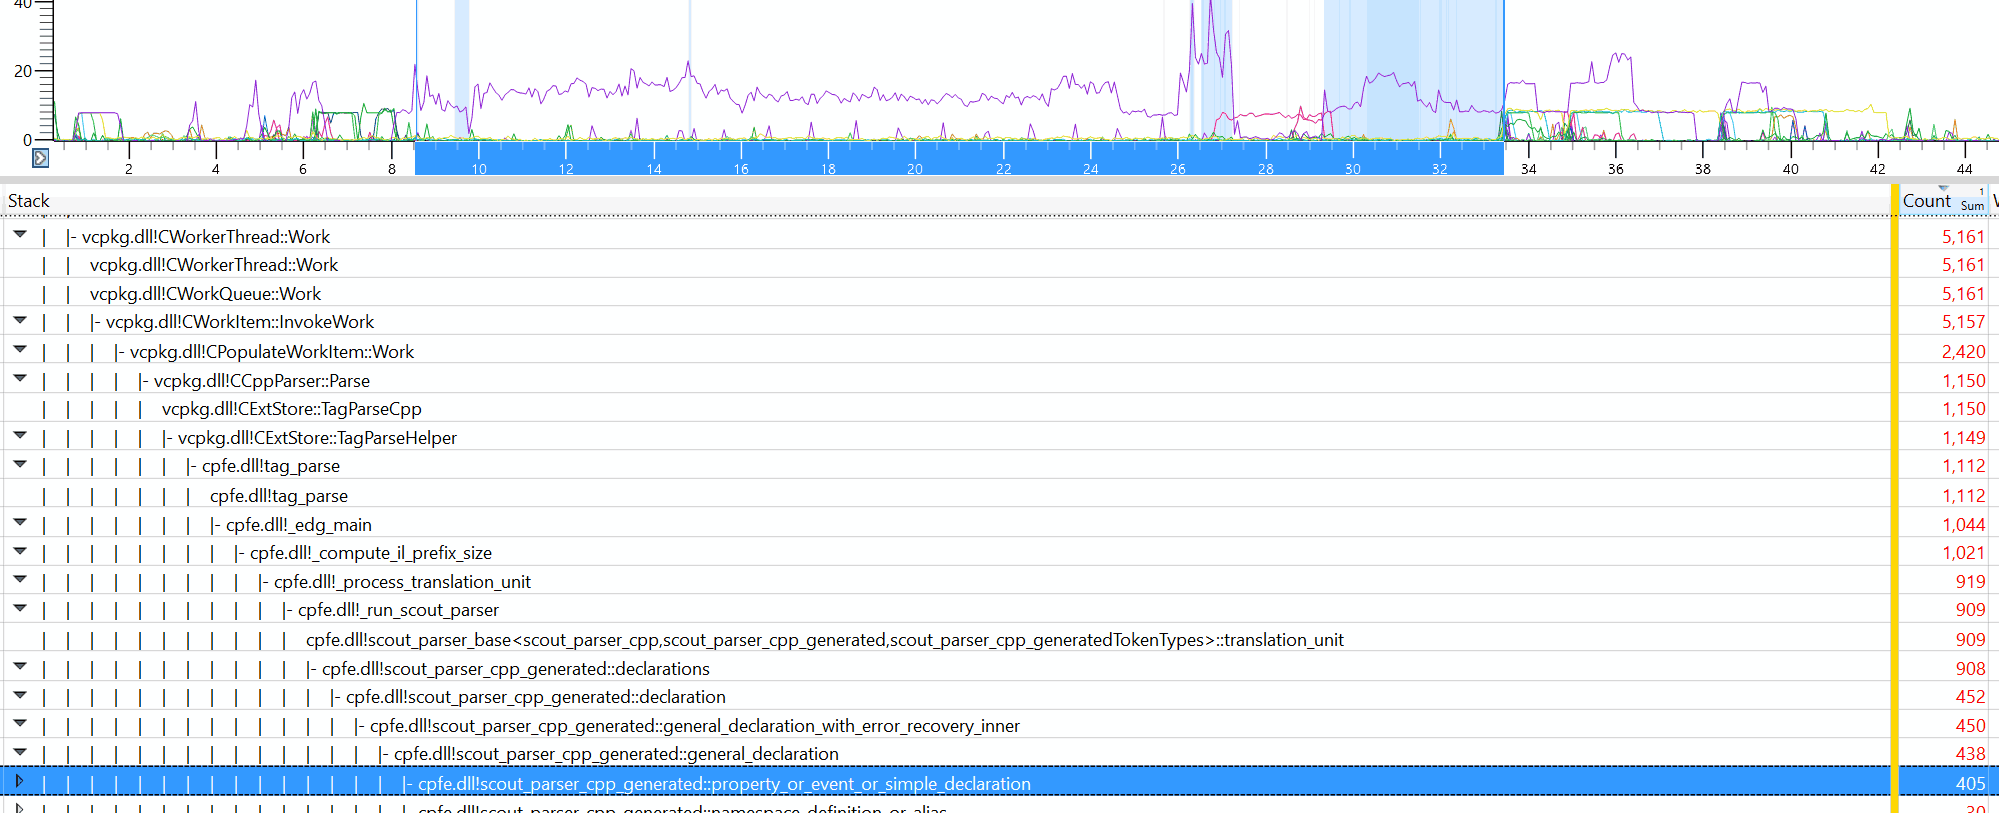
One branch of heavy things under that stack frame leads into something called CVCArchy::GetCfgNames,
which, I guess, is getting the build configurations available in the project or solution. Internally
it’s another onion, getting into marshaling and into some immutable dictionaries and concurrent stacks.
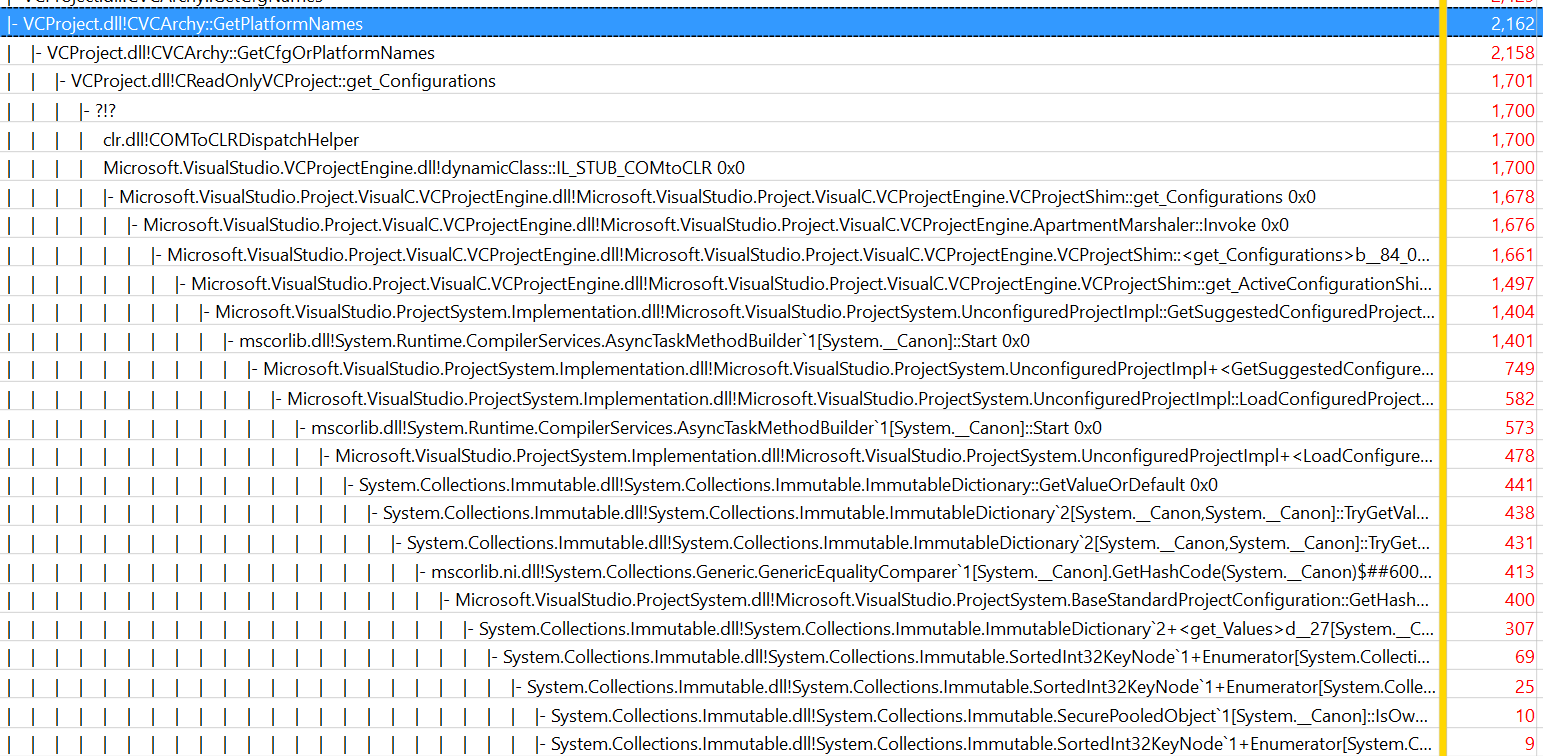
And another call branch goes into CVCArchy::GetPlatformNames, which seemingly goes into exactly the
same implementation again. ¯\_(ツ)_/¯
So it would seem that two things are going on: 1) possibly R# is querying project configurations/platforms a lot of times (once for each file?), and 2) querying that from VS is actually a fairly costly operation.
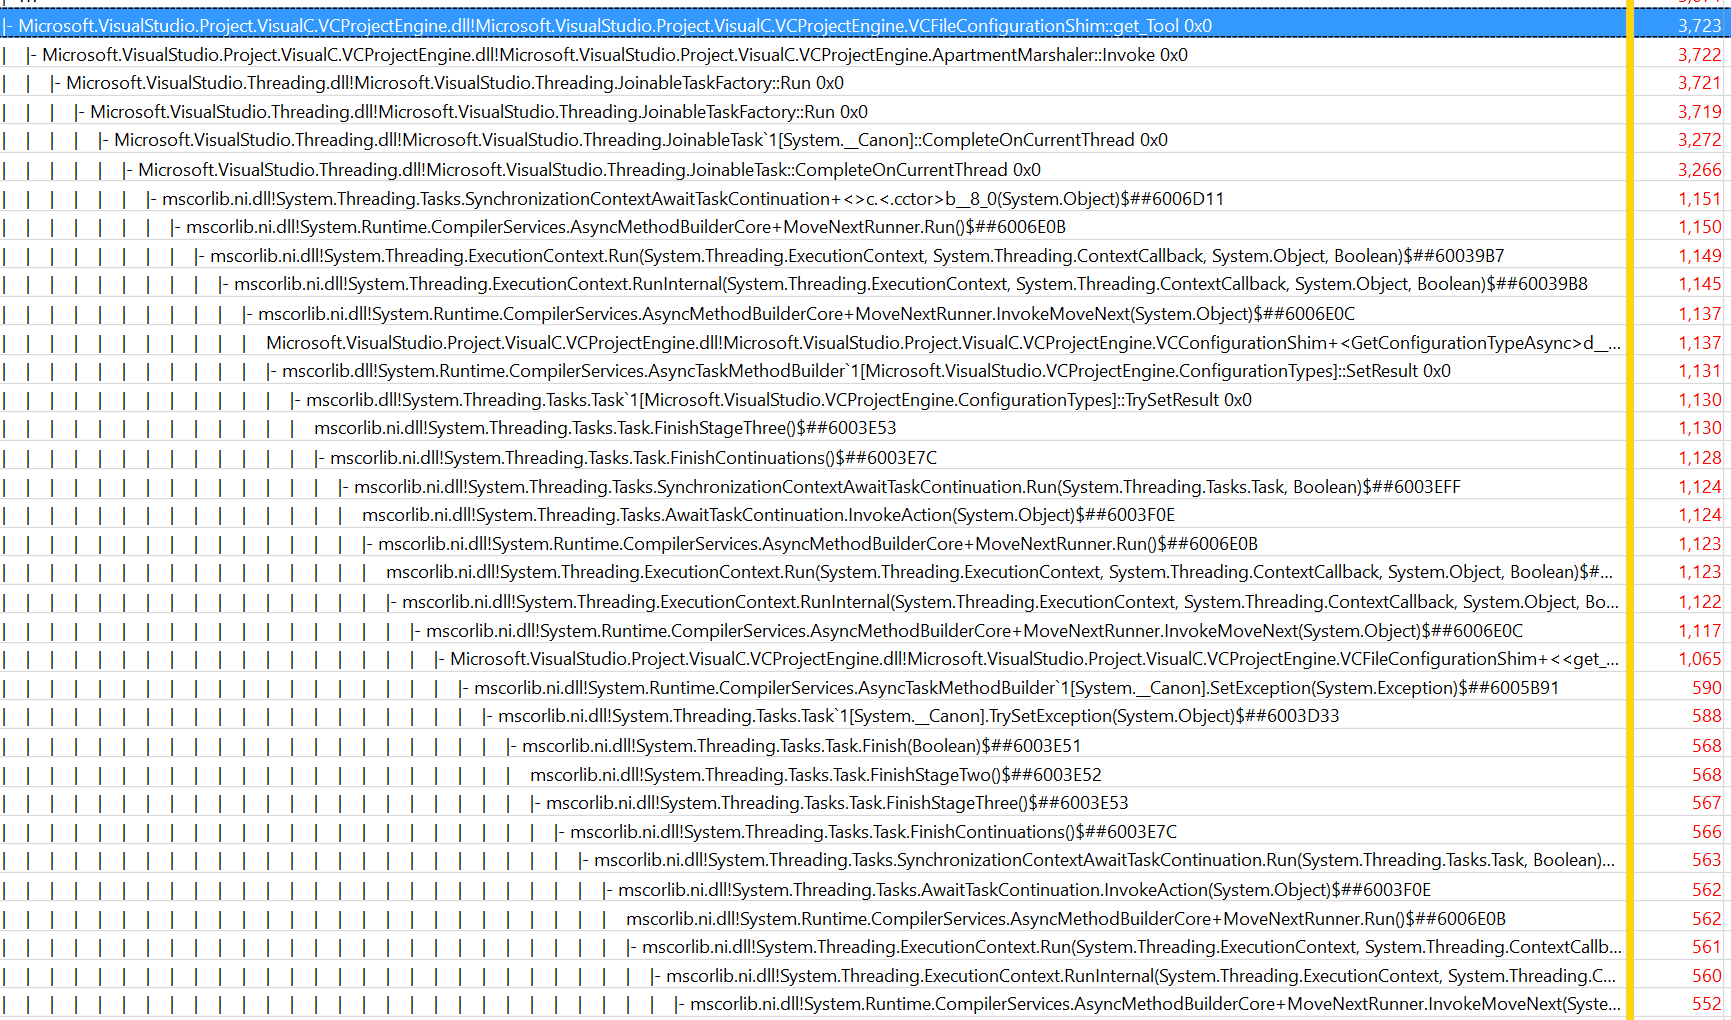
VS seemingly tries to fulfill these “what configurations do you have, matey?” queries in an asynchronous fashion, since that also causes quite some activity on other VS threads. Hey at least it’s trying to help :)
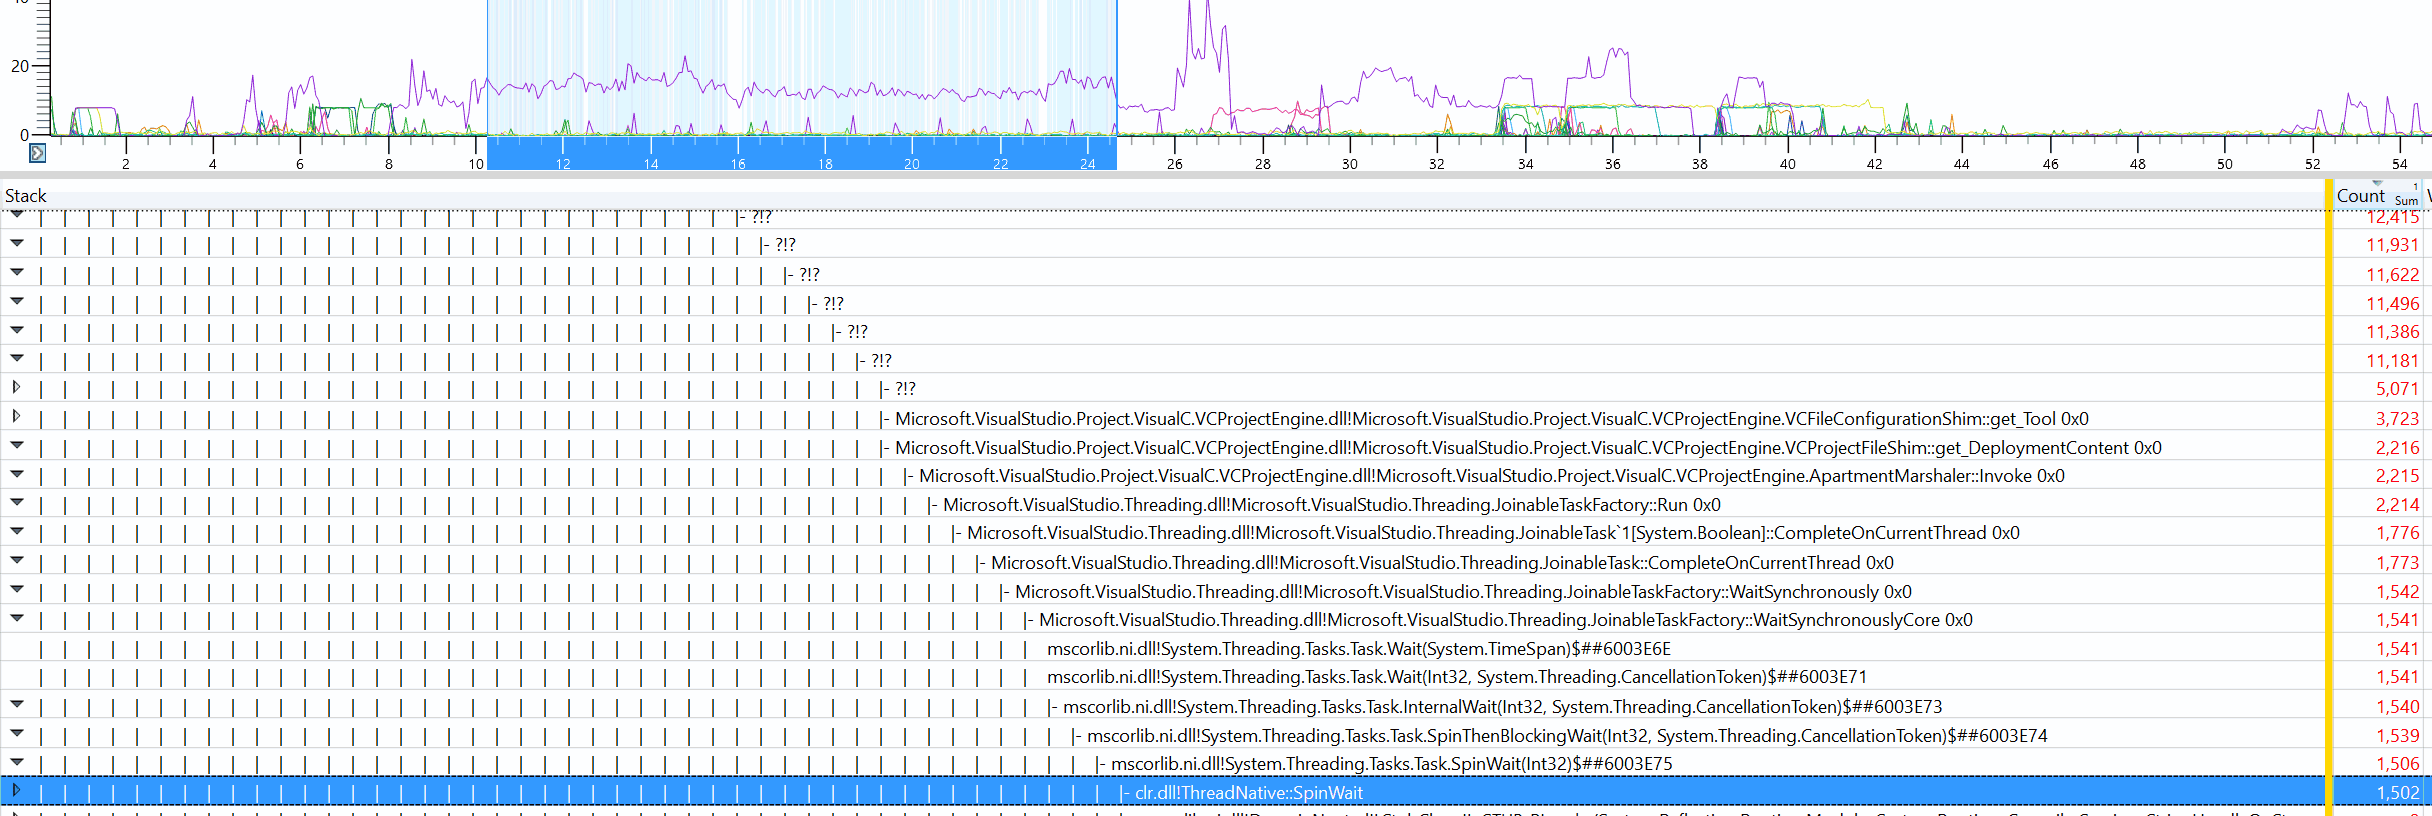
Some of which causes not much actual work being done, e.g. this thread spends 1.5k samples doing spin waits. Likely an artifact of some generic thread work system not being quite used as it was intended to, or something.
There’s another background thread activity that kicks in towards end of the “I was busy opening the project” period. That one is probably some older code, since the call stack is not deep at all, and it fairly quickly gets to actual work that it tries to do :)
Let’s try with R# disabled
Disabling R# in VS 2017 makes it open the same solution in 8 seconds (first time) and 4 seconds (subsequent opens). So that is pretty much five times faster.
Does this sound like something that should be fixed in R#, somehow? That’s my guess too, so here’s a bug report I filed. Fingers crossed it will be fixed soon! They already responded on the bug report, so things are looking good.
(Edit: looks like this will be fixed in R# 2017.1, nice!)
Visual Studio 2015 does not seem to be affected; opening the same solution with R# enabled is about 8 seconds as well. So this could be Microsoft’s bug too, or an unintended consequence of some implementation change (e.g. “we made config queries async now”).
Complex software is complex, yo.
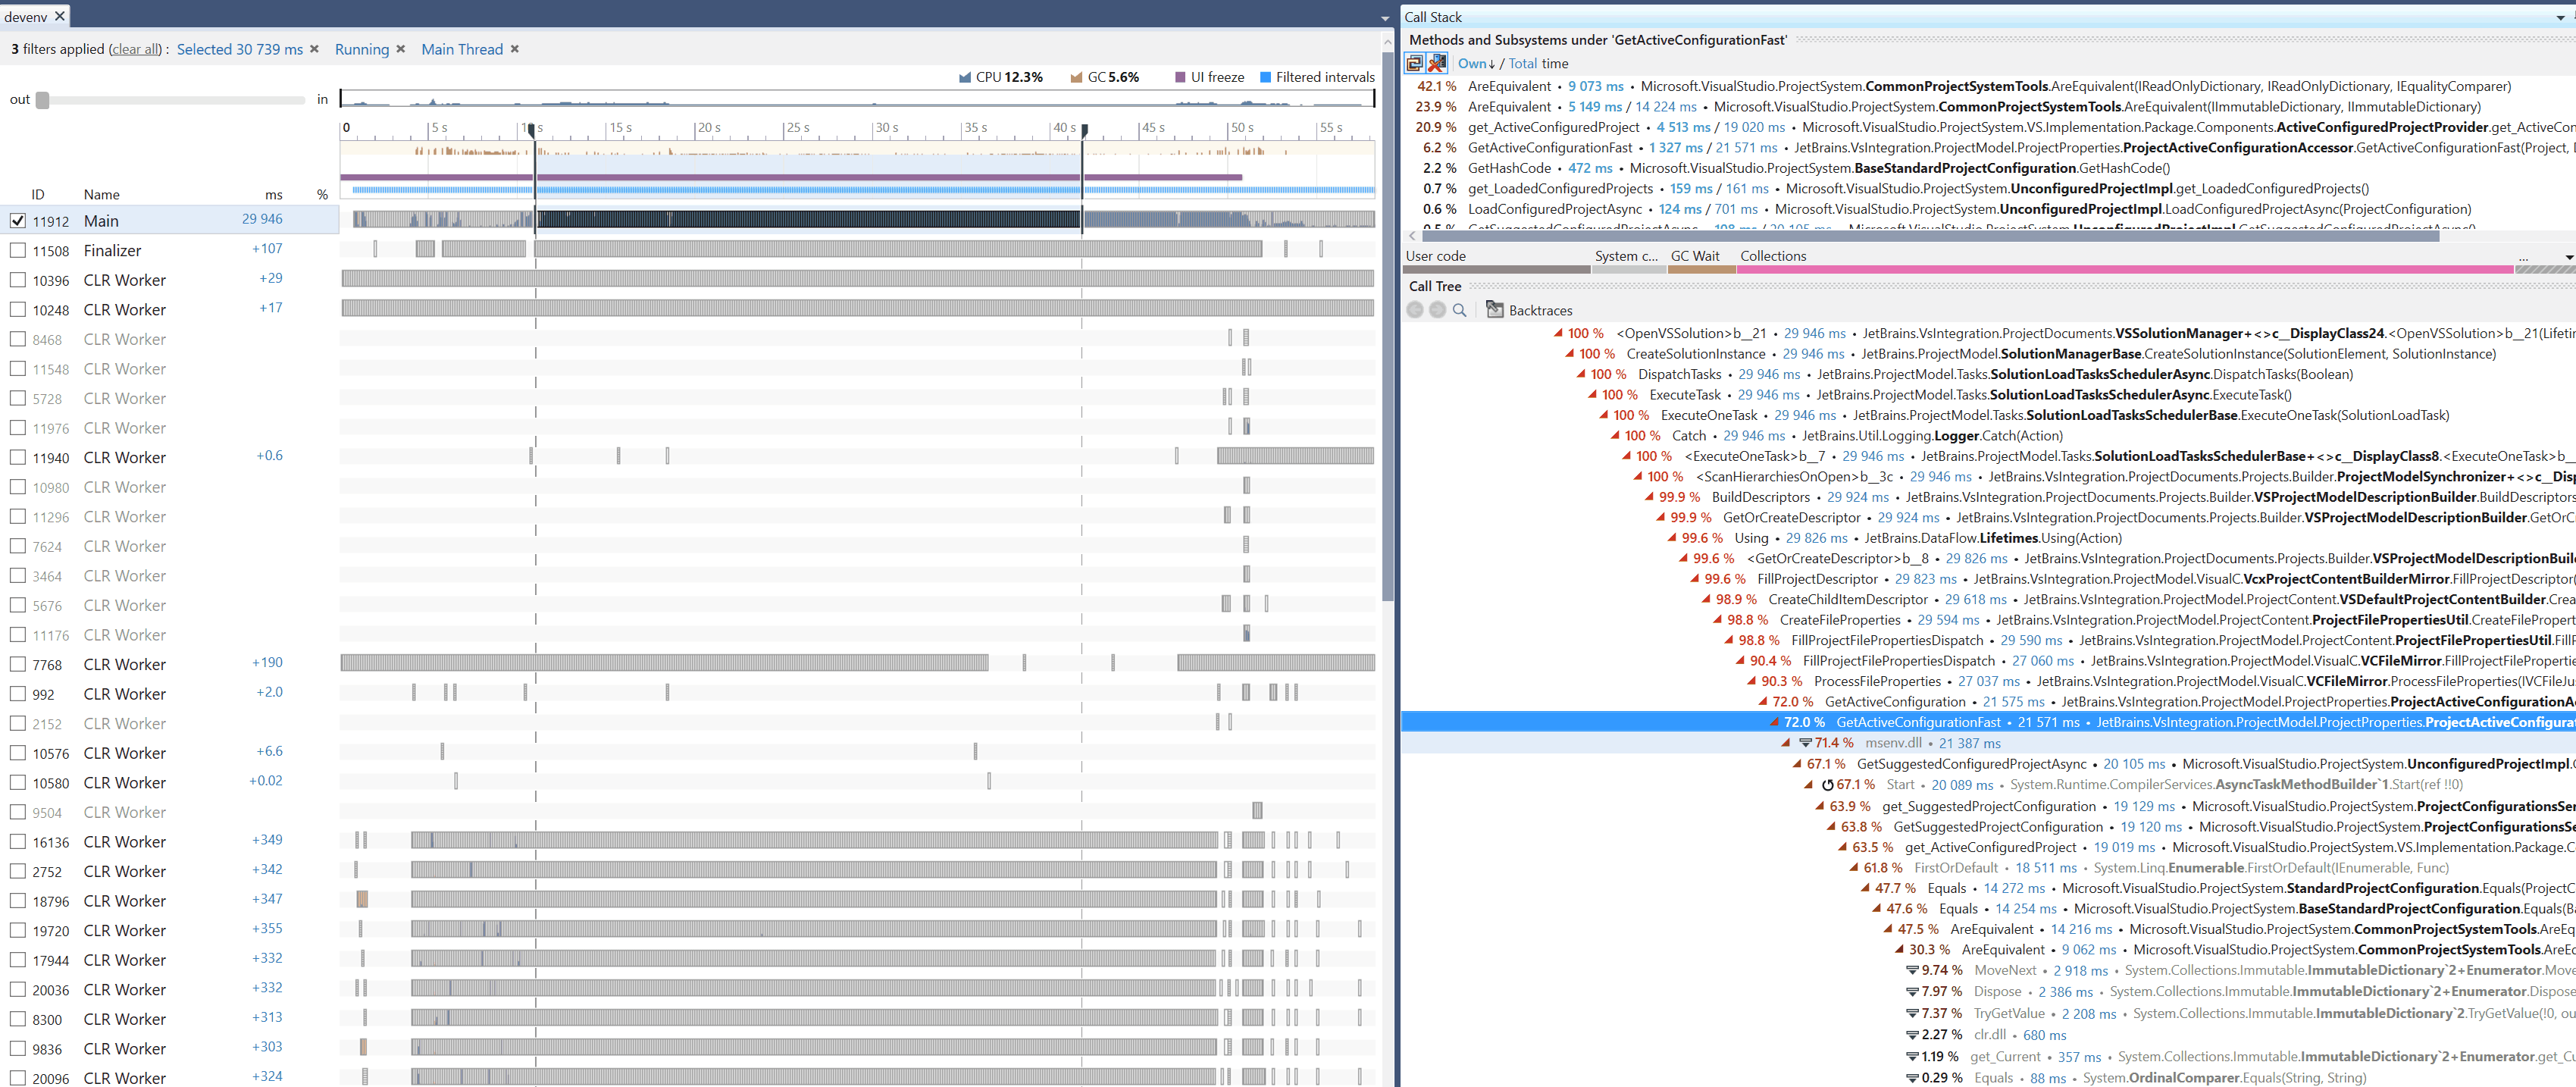
While at it: dotTrace profiler
Upon suggestion from JetBrains folks, I did a dotTrace capture of VS activity while it’s opening the solution. Turns out, it’s a pretty sweet C# profiler! It also pointed out to basically the same things, but has C# symbols in the callstacks, and a nice thread view and so on. Sweet!
So there. Profiling stuff is useful, and can answer questions like “why is this slow?”. Other news at eleven!