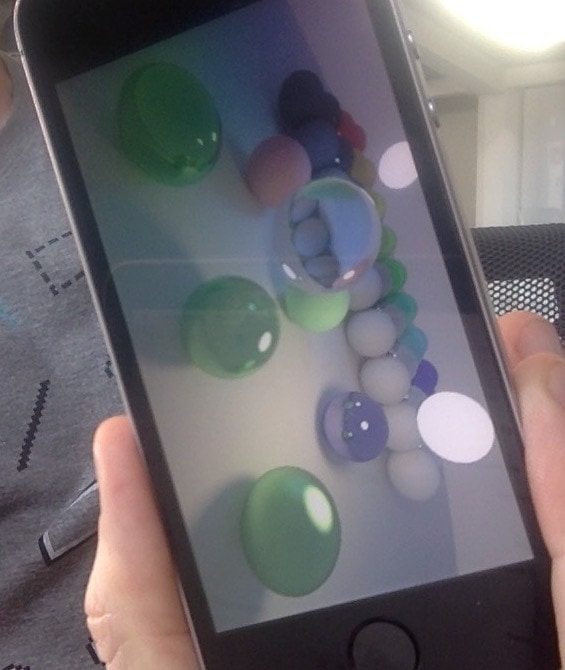
Pathtracer 14: iOS
Introduction and index of this series is here.
I wanted to check out how’s the performance on a mobile device. So, let’s take what we ended up with in the previous post, and make it run on iOS.
Initial port
Code for the Mac app is a super simple Cocoa application that either updates a Metal texture from the CPU and draws it to screen, or produces the texture with a Metal compute shader. I know almost nothing about Mac or Cocoa programming, so I just created a new project in Xcode, picked a “Metal game” template, removed things I don’t need and added the things I do need.
“Porting” that to iOS basically involved these steps (again, I don’t know how it’s supposed to be done; I’m just doing a random walk):
- Created two projects in Xcode, using the “Metal game” template; one for Mac (which matches my current code setup), and another one for “Cross Platform” case.
- Looked at the differences in file layout & project settings between them,
- Applied the differences to my app. The changes in detail were:
- Some folder renaming and moving files around in Xcode project structure.
- Added iOS specific files produced by Xcode project template.
- Some tweaks to existing app code
to make it compile on iOS – mostly temporarily disabling all the SSE SIMD code paths
(iOS uses ARM CPUs, SSE does not exist there). Other changes were mostly differences in Metal functionality between
macOS and iOS (
MTLResourceStorageModeManagedbuffer mode anddidModifyRangebuffer method only exist on macOS). - Added iOS build target to Xcode project.
And then it Just Worked; both the CPU & GPU code paths! Which was a bit surprising, actually :)
Performance of this “just make it run” port on iPhone SE: CPU 5.7 Mray/s, GPU 19.8 Mray/s.
Xcode tools for iOS GPU performance
I wanted to look at what sort of tooling Xcode has for investigating iOS GPU performance these days. Last time I did it was a couple years ago, and was also not related to compute shader workloads. So here’s a quick look into what I found!
Update: this post was about Xcode 9 on an A9 hardware. At WWDC 2018 Apple has announced big improvements to Metal profiling tools in Xcode 10, especially when running on A11 or later hardware. I haven’t tried them myself, but you might want to check out the WWDC session and “Optimizing Performance” doc.
TL;DR: it’s not bad. Too bad it’s not as good as PS4 tooling, but then again, who is?
Most of Xcode GPU analysis is under the “Debug Navigator” thingy, where with an app running you can select the “FPS” section
and it displays basic gauges of CPU & GPU performance. When using Metal, there is a “Capture GPU Frame” button near the bottom
which leads to actual frame debugging & performance tools.

The default view is more useful for debugging rendering issues; you want to switch to “View Frame By Performance” instead:
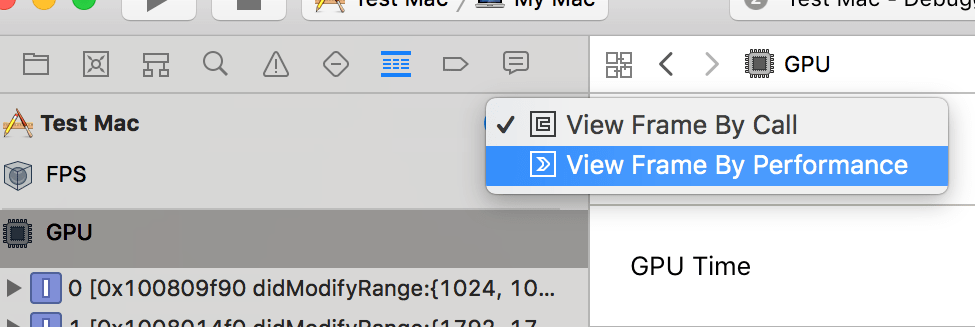
The left sidebar then lists various things grouped by pipeline (compute or graphics), and by shader. It does not list them by objects rendered, which is different from how GPU profiling on desktop usually works. In my case obviously the single compute shader dispatch takes up almost all the time.
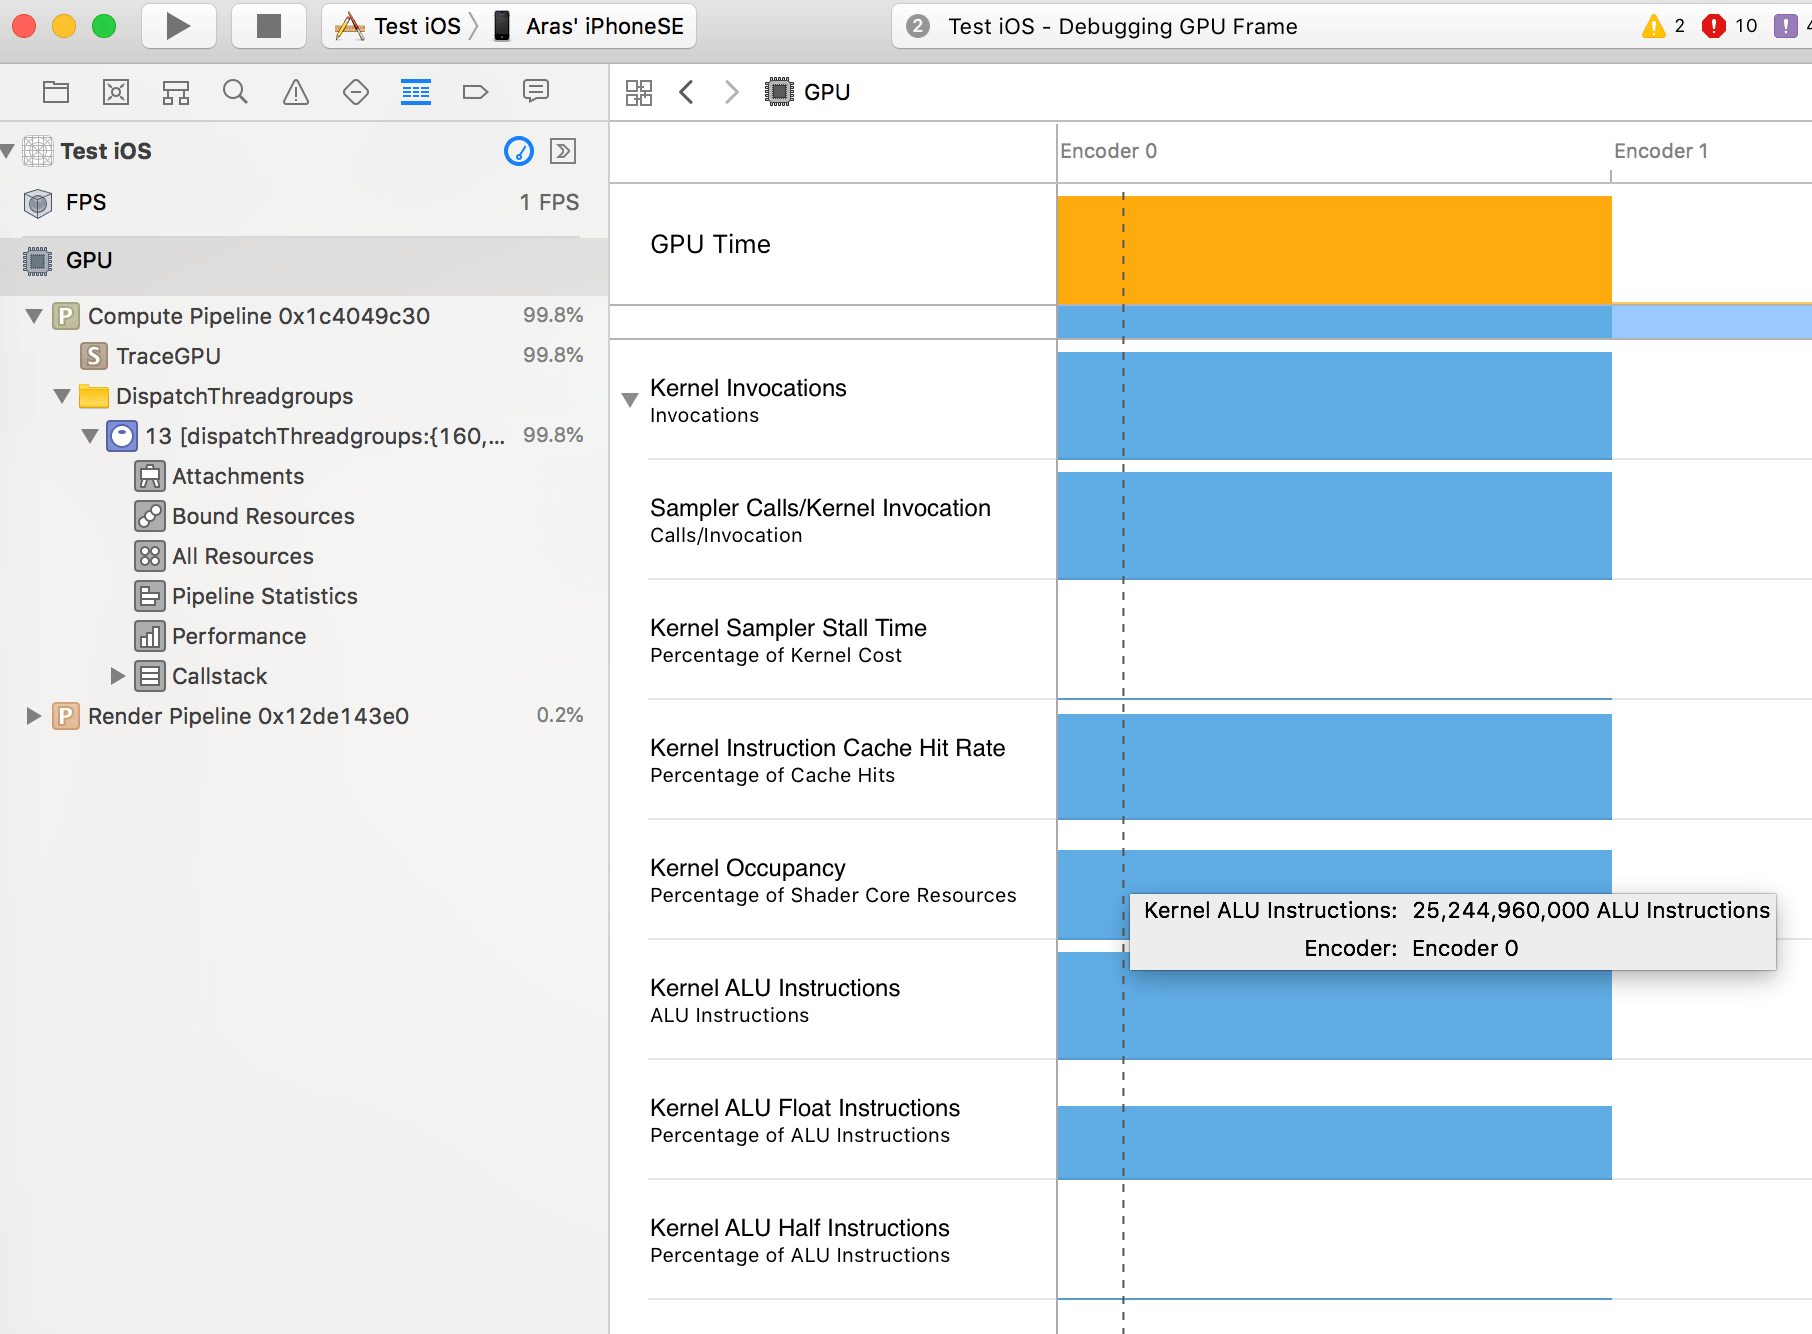
The information presented seems to be a bunch of GPU counters (number of shader invocations, instructions executed, and so on). Some of those are more useful than others, and what kind of information is being shown probably also depends on the device & GPU model. Here are screenshots of what I saw displayed about my compute shader on an iPhone SE:
Whole frame overview has various counters per encoder. From here: occupancy is not too bad, and hey look my shader is not using any
half-precision instructions:
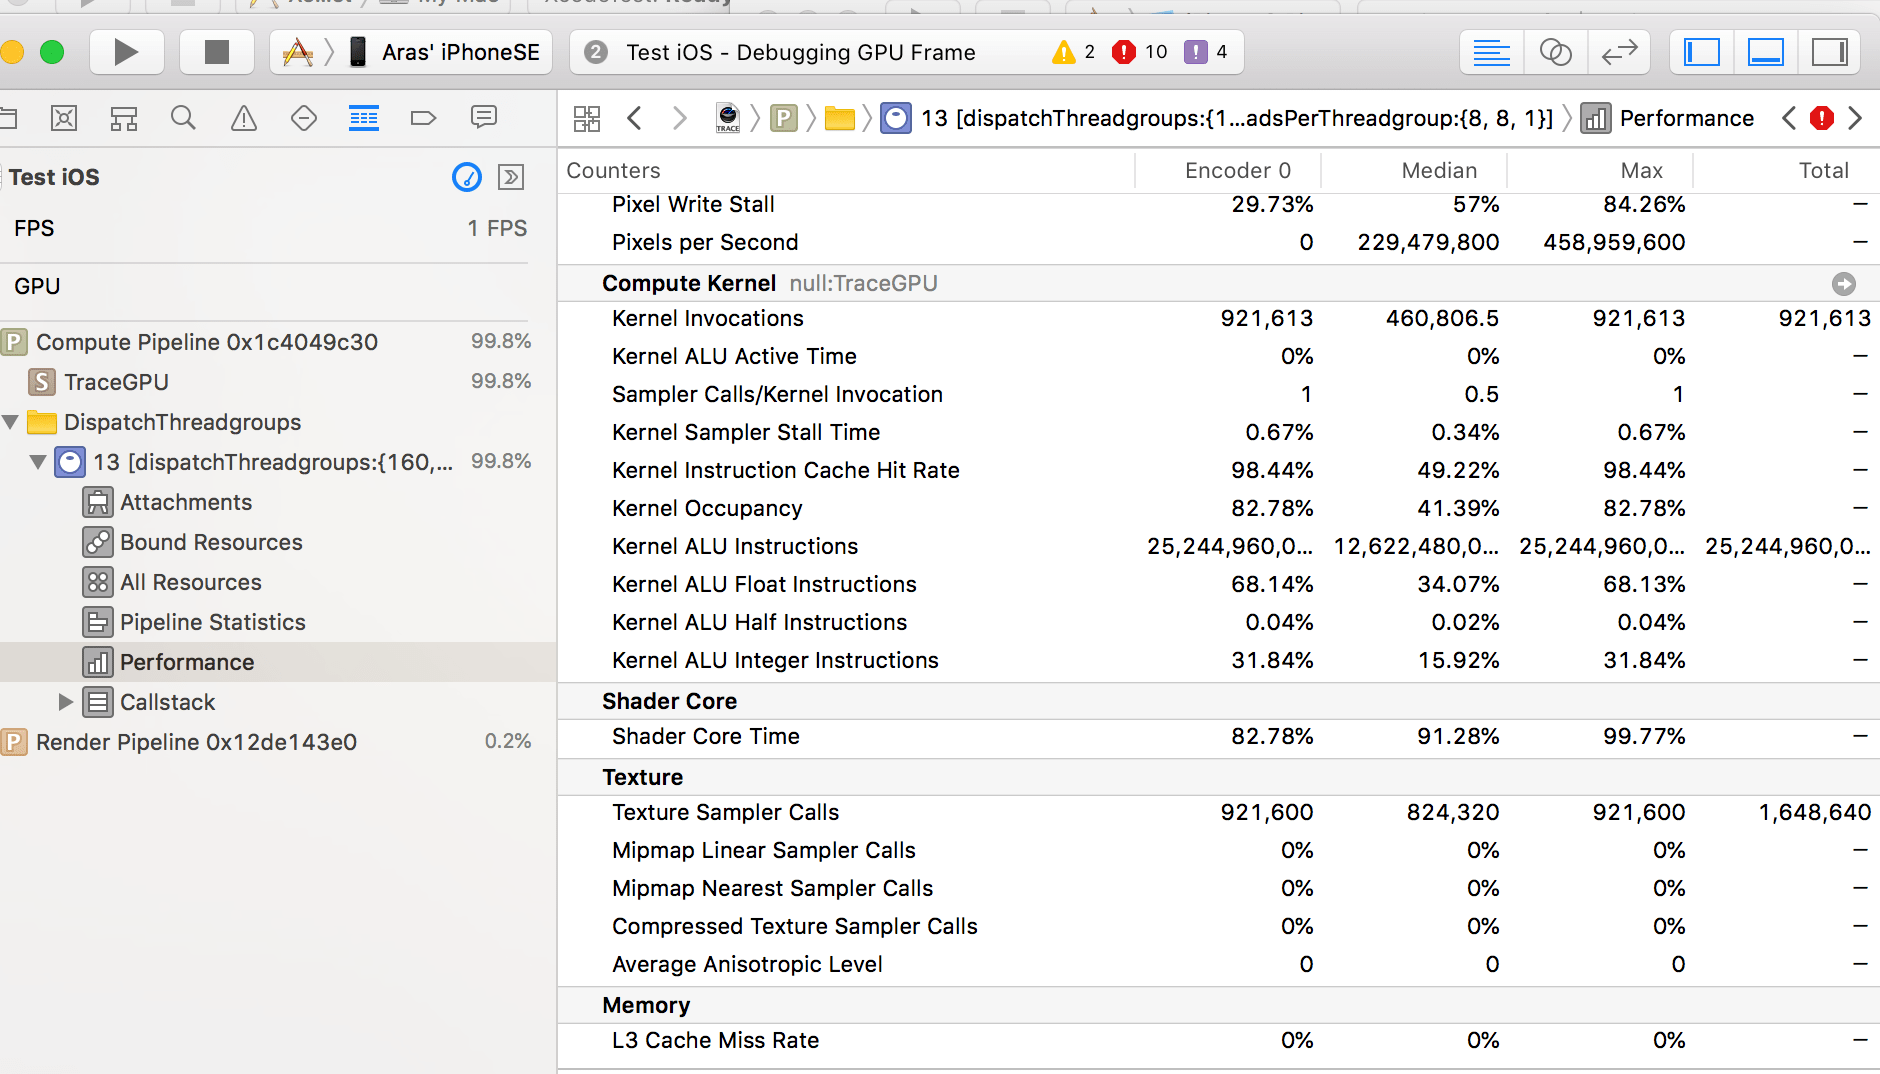
“Performance” section has more stats in number form:
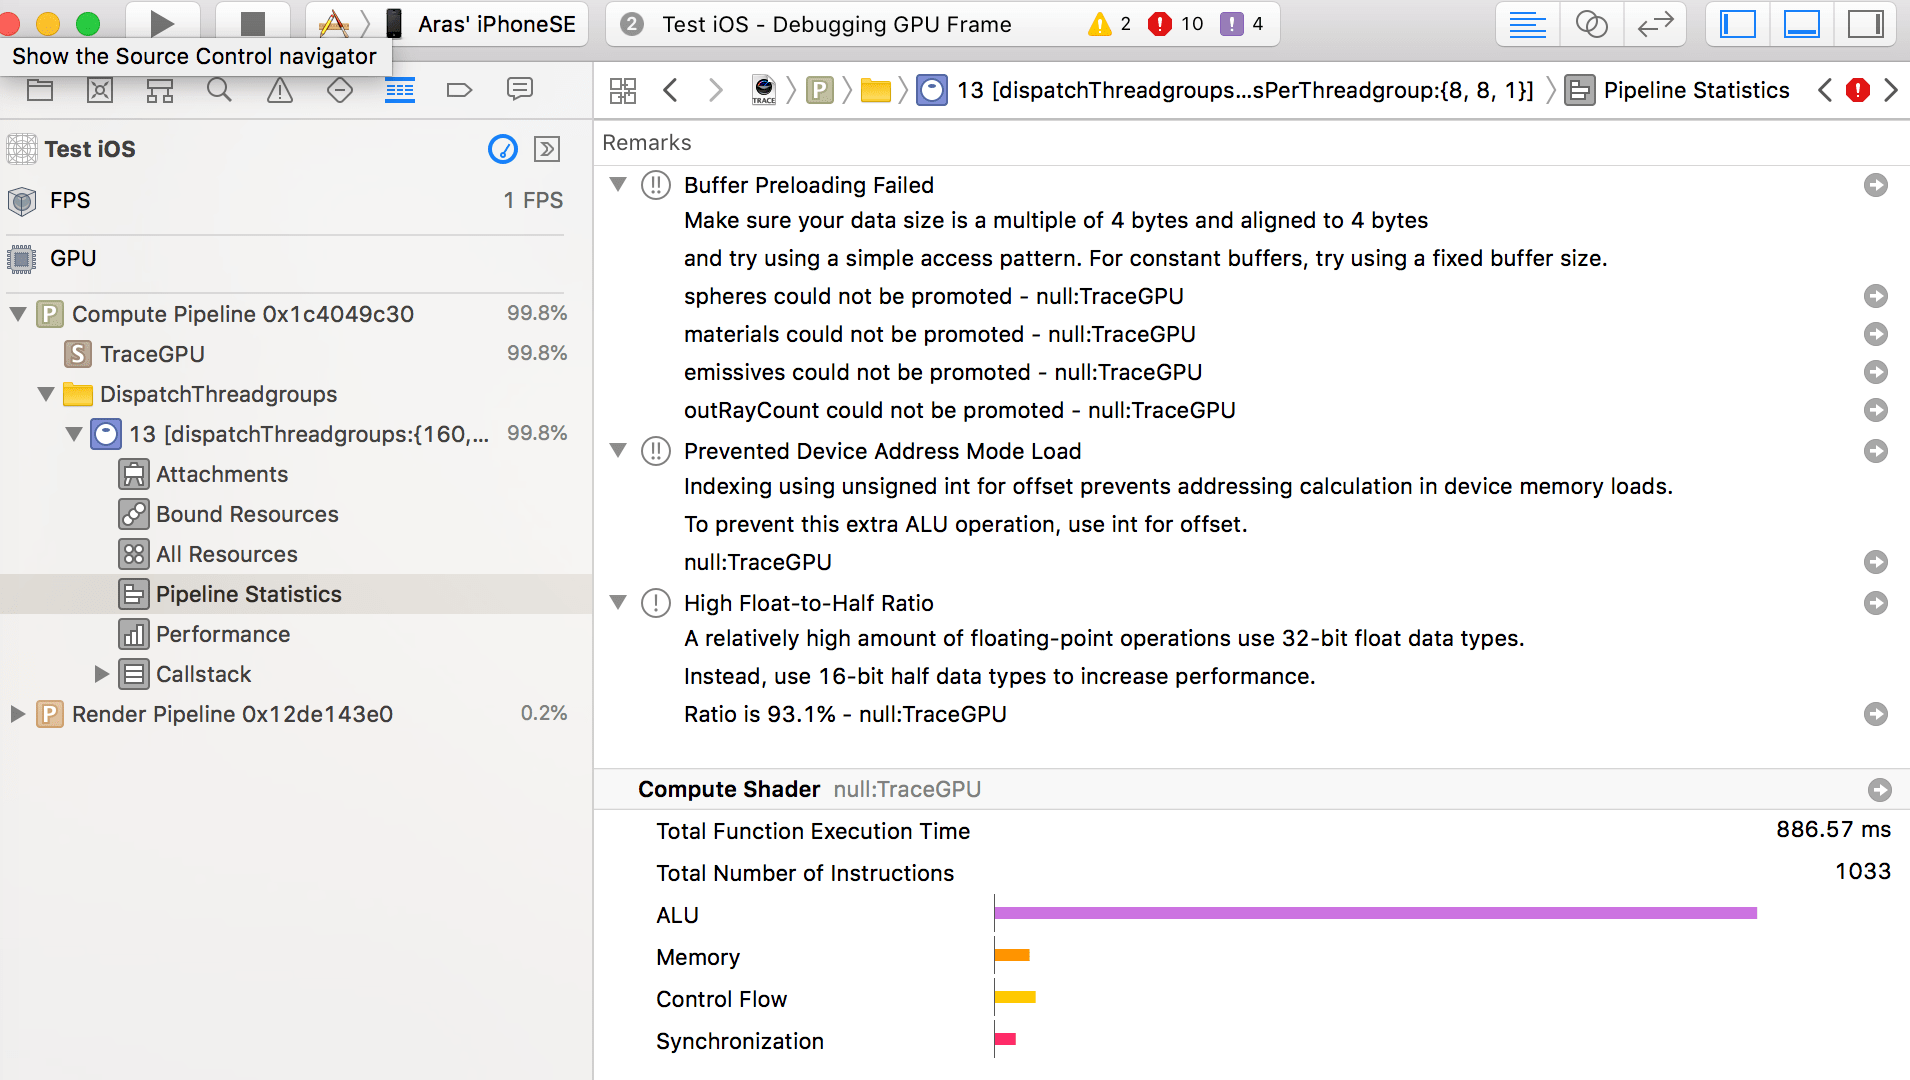
“Pipeline Statistics” section has some useful performance hints and overview graphs of, uhm, something. This is probably telling me I’m ALU
bound, but what are the units of each bar, and whether they are all even the same scale? I don’t know :)
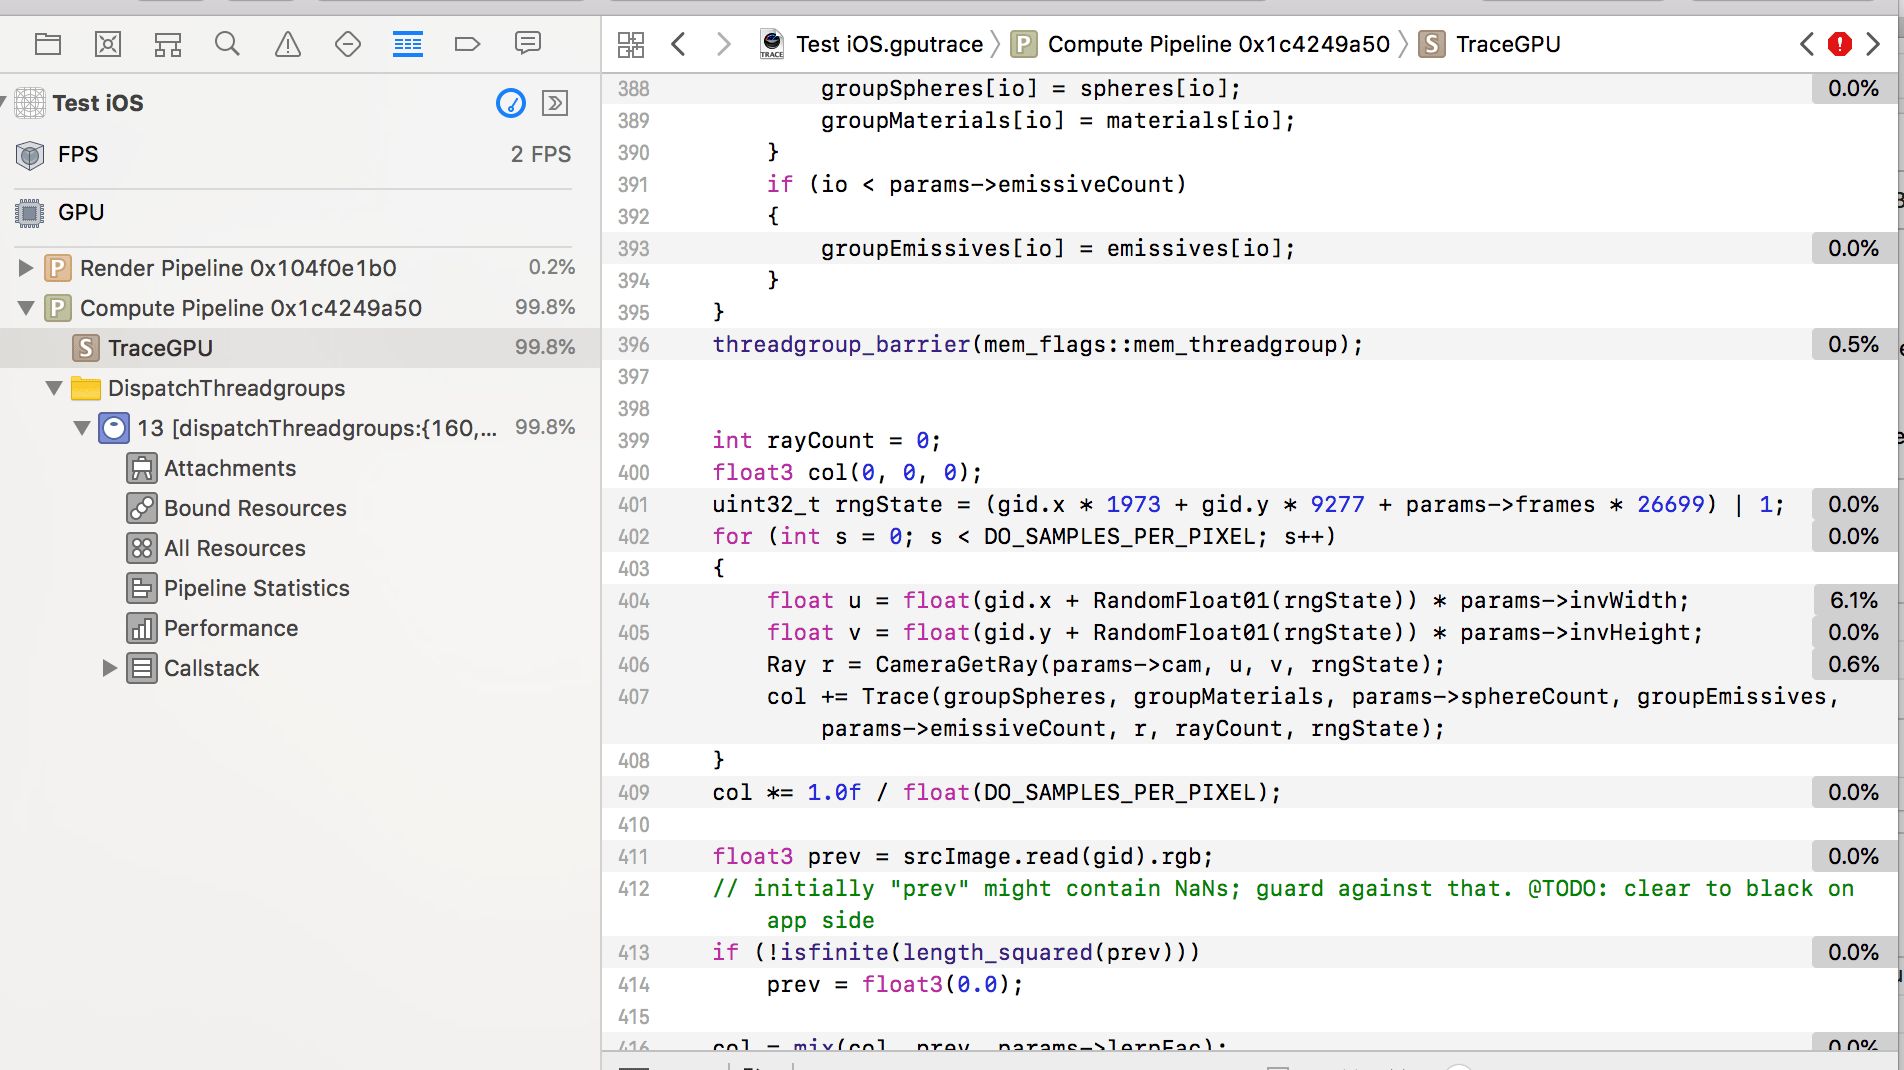
If the shader was compiled with debugging information on, then it can also show which places of the shader actually took time. As far
as I can tell, it just lies – for my shader, it basically says “yeah, all these lines took zero time, and there’s one line that took 6%”.
Where are the other 94%?!
Xcode tools for Mac GPU performance
In the previous post I ranted how Mac has no GPU performance tools at all, and while that is somewhat true (i.e. there’s no tool that would have told me “hey Aras, use by-value local variables insteaad of by-reference! twice as fast!”)… some of that “Capture GPU Frame” functionality exists for Mac Metal applications as well.
Here’s what information is displayed by “Performance” section on my MBP (Intel Iris Pro):
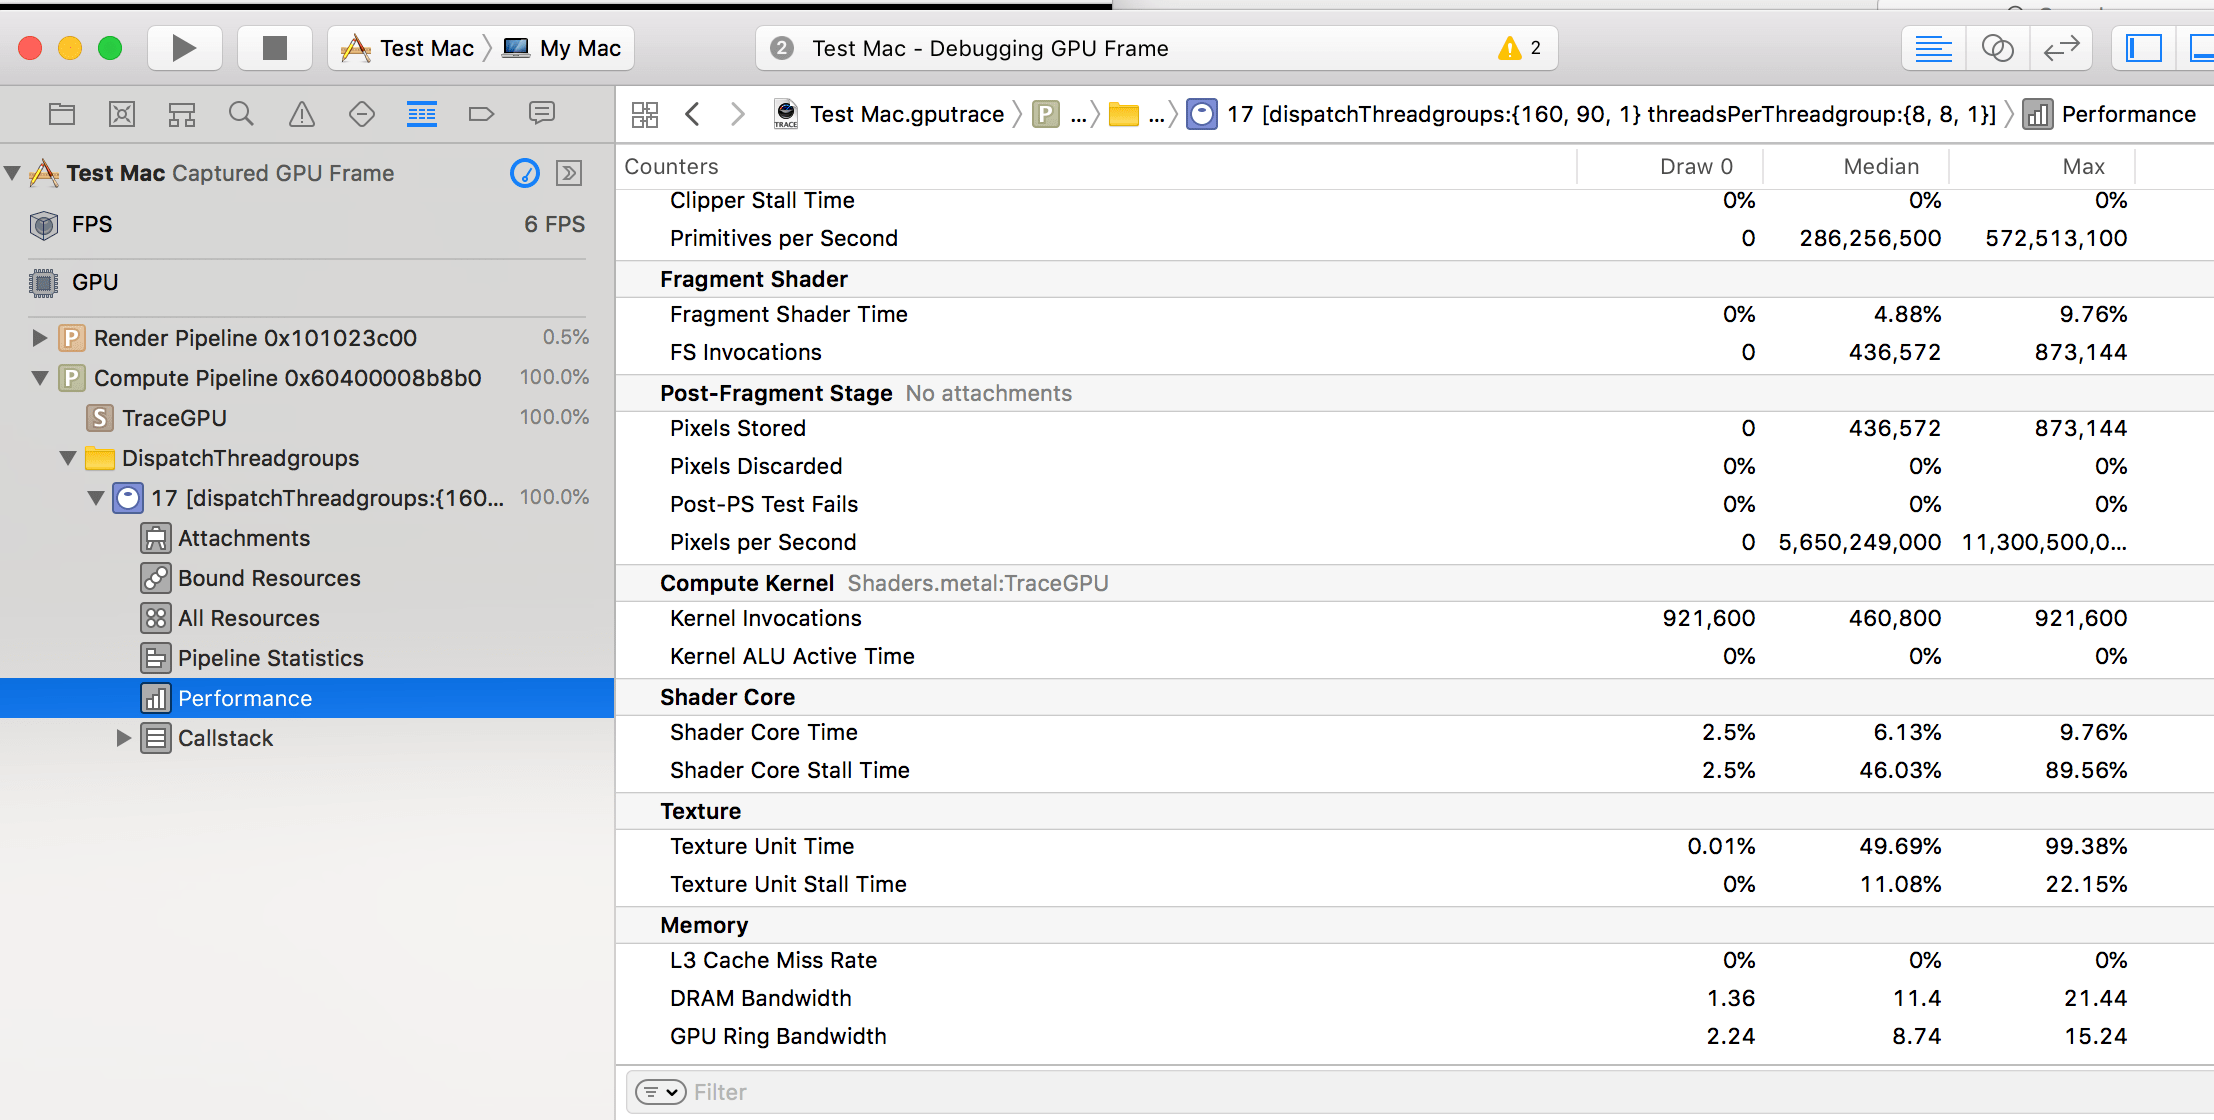
The “compute kernel” part has way fewer counters, and I don’t quite believe that ALU active time was exactly zero.
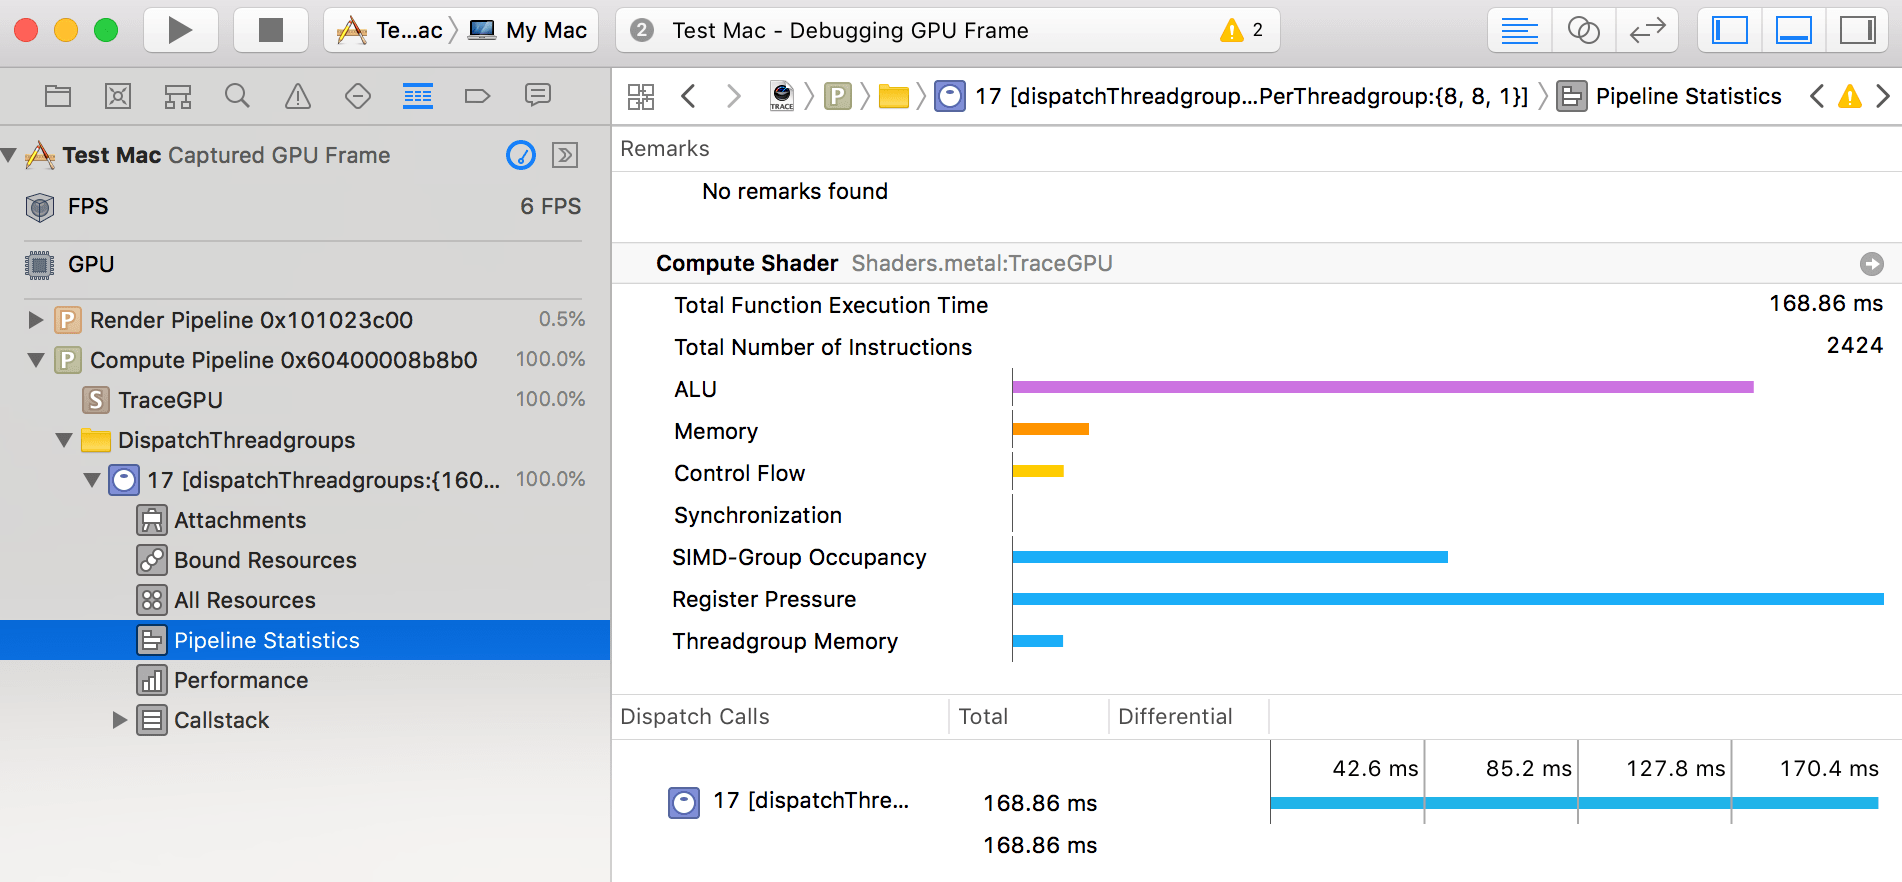
“Pipeline Statistics” section on the other hand… it has no performance hints, but it does have more overview graphs!
“Register pressure”, “SIMD group occupancy” and “threadgroup memory” parts sound useful!
Let’s do SIMD NEON code paths for CPU
Recall when in part 8 I played around with SSE intrinsics for CPU HitSpheres function? Well now that code is disabled since iOS uses ARM CPUs, so Intel specific instructions don’t even compile there.
However, ARM CPUs do have their own SIMD instruction set: NEON.
I know! Let’s use NEON intrinsic functions to implement our
own float3 and float4 helpers, and then the SIMD HitSpheres should more or less work.
Caveat: as usual, I basically have no idea what I’m talking about. I have read some NEON code in the past, and perhaps have written a small NEON function or two at some point, but I’m nowhere near being “proficient” at it.
NEON float3
First off, let’s do the float3 helper class implementation with NEON. On x64 CPUs that did improve performance
a bit (not much though). NEON intrinsics overall seem to be way more orthogonal and “intuitive” than SSE ones,
however SSE has way, way more information, tutorials & reference about it out there. Anyway, the NEON
float3 part is this commit,
and my summary of NEON is:
#include <arm_neon.h>to get intrinsics & data types,float32x4_tdata type is for 4-wide floats,- NEON intrinsic functions start with
v(for “vector”?), haveqin there for things that operate on four things, and a suffix indicating the data type. For example, a 4-wide float add isvaddq_f32. Simple and sweet! - Getting to individual SIMD lanes is much easier than on SSE (just
vgetq_lane_f32), however doing arbitrary swizzles/shuffles is harder – you have to dance around with extracting low/high parts, or “zipping” various operands, etc.
Doing the above work did not noticeably change performance though. Oh well, actually quite expected. I did learn/remember some NEON stuff though, so a net positive :)
NEON HitSpheres & float4
Last time an actual performance gain with SIMD was doing SSE HitSpheres,
with data laid out in struct-of-arrays fashion. To get the same working on NEON, I basically have to implement a float4
helper class, and touch several places in HitSpheres function itself that use SSE directly. It’s all in
this commit.
That got CPU performance from 5.8 Mray/s up to 8.5 Mray/s. Nice!
Note that my NEON approach is very likely suboptimal; I was basically doing a direct port from SSE. Which means:
- “mask” calculation for comparisons. On SSE that is just
_mm_movemask_ps, but becomes this in NEON:
VM_INLINE unsigned mask(float4 v)
{
    static const uint32x4_t movemask = { 1, 2, 4, 8 };
    static const uint32x4_t highbit = { 0x80000000, 0x80000000, 0x80000000, 0x80000000 };
    uint32x4_t t0 = vreinterpretq_u32_f32(v.m);
    uint32x4_t t1 = vtstq_u32(t0, highbit);
    uint32x4_t t2 = vandq_u32(t1, movemask);
    uint32x2_t t3 = vorr_u32(vget_low_u32(t2), vget_high_u32(t2));
    return vget_lane_u32(t3, 0) | vget_lane_u32(t3, 1);
}
- picking closest hit among 4 results may or might not be done more optimally in NEON:
int id_scalar[4];
float hitT_scalar[4];
#if USE_NEON
vst1q_s32(id_scalar, id);
vst1q_f32(hitT_scalar, hitT.m);
#else
_mm_storeu_si128((__m128i *)id_scalar, id);
_mm_storeu_ps(hitT_scalar, hitT.m);
#endif
// In general, you would do this with a bit scan (first set/trailing zero count).
// But who cares, it's only 16 options.
static const int laneId[16] =
{
    0, 0, 1, 0, // 00xx
    2, 0, 1, 0, // 01xx
    3, 0, 1, 0, // 10xx
    2, 0, 1, 0, // 11xx
};
int lane = laneId[minMask];
int hitId = id_scalar[lane];
float finalHitT = hitT_scalar[lane];
Current status
So the above is basic port to iOS, with some simple NEON code path, and no mobile specific GPU tweaks/optimizations
at all. Code is over at 14-ios tag on github.
Performance:
- iPhone SE (A9 chip): 8.5 Mray/s CPU, 19.8 Mray/s GPU.
- iPhone X (A11 chip): 12.9 Mray/s CPU, 46.6 Mray/s GPU.
- I haven’t looked into how many CPU threads the enkiTS task scheduler ends up using on iPhone X. I suspect it still might be just two “high performance” cores, which would be within my expectations of “roughly 50% more per-core CPU perf in two Apple CPU generations”. Which is fairly impressive!
- For comparison, a MacBook Pro (2013) with Core i7 2.3 GHz & Intel Iris Pro gets: 42 Mray/s CPU, 99 Mray/s GPU.
- Which means that single-thread CPU performance on iPhone X is actually very similar, or even a bit higher, than on an (admittedly old) MacBook Pro!
