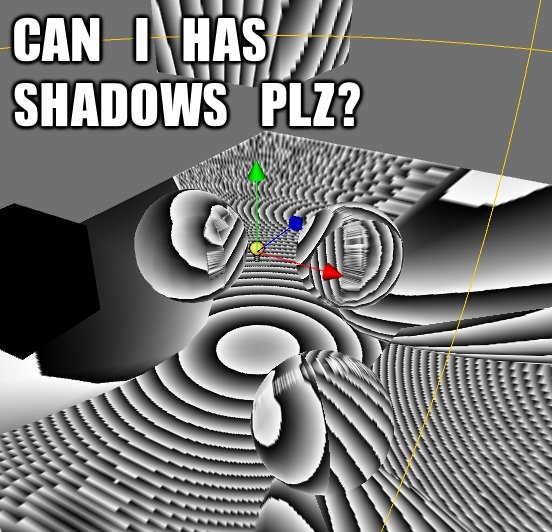
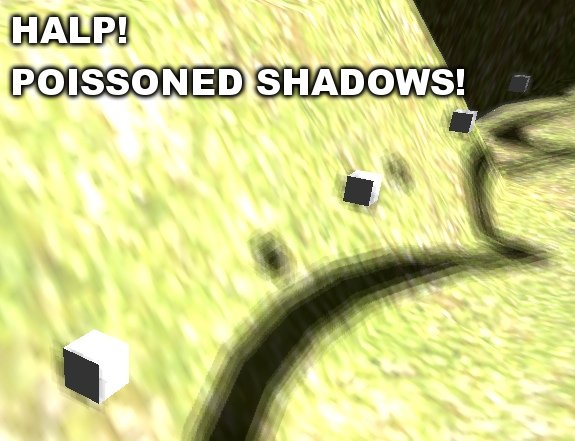
Testing graphics code

Everyone is saying “unit tests for the win!” all over the place. That’s good, but how would you actually test graphics related code? Especially considering all the different hardware and drivers out there, where the result might be different just because the hardware is different, or because the hardware/driver understands your code in a funky way…

Here is how we do it at work. This took quite some time to set up, but I think it’s very worth it.

'Testing Lab in action'First you need hardware to test things on. For a start just a couple of graphics cards that you can swap in and out might do the trick. A larger problem is integrated graphics cards - it’s quite hard to swap them in and out, so we bit the bullet and bought a machine for each integrated card that we care about. The same machines are then used to test discrete cards (we have several shelves of those by now, going all the way back to… does ATI Rage, Matrox G45 or S3 ProSavage say anything to you?).

'It looks pretty random, huh?'Then you make the unit tests (or perhaps these should be called the functional tests). Build a small scene for every possible thing that you can imagine. Some examples:

  • Do all blend modes work?

  • Do light cookies work?

  • Does automatic texture coordinate generation and texture transforms work?

  • Does rendering of particles work?

  • Does glow image postprocessing effect work?

  • Does mesh skinning work?

  • Do shadows from point lights work?

This will result in a lot of tests, with each test hopefully testing a small, isolated feature. Make some setup that can load all defined tests in succession and take screenshots of the results. Make sure time always progresses at fixed rate (for the case where a test does not produce a constant image… like particle or animation tests), and take a screenshot of, for example, frame 5 for each test (so that some tests have some data to warm up… for example motion blur test).

By this time you have something that you can run and it spits out lots of screenshots. This is already very useful. Get a new graphics card, upgrade to new OS or install a new shiny driver? Run the tests, and obvious errors (if any) can be found just by quickly flipping through the shots. Same with the changes that are made in rendering related code - run the tests, see if anything became broken.

'My crappy Perl code...'The testing process can be further automated. Here we have a small set of Perl scripts that can either produce a suite of test images for the current hardware, or run all the tests and compare the results with “known to be correct” suite of images. As graphics cards are different from each other, the “correct” results will be somewhat different (because of different capabilities, internal precision etc.). So we keep a set of test results for each graphics card.

'That’s an awful lot of drivers!'Then these scripts can be run for various driver versions on every graphics card. They compare results for each test case, and for failed tests copy out the resulting screenshot, the correct screenshot, log the failures into a wiki-compatible format (to be posted on some internal wiki), etc.

I’ve heard that some folks even go a step further - fully automate the testing of all driver versions. Install one driver in silent mode, reboot the machine, after reboot runs another script that launches the tests and proceeds with the next driver version. I don’t know if that is only an urban legend or if someone actually does this*, but that would be an interesting thing to try. The testing per card then would be: 1) install a card, 2) run the test script, 3) coffee break, happiness and profit!

* My impression is that at least with the big games it works the other way around - you don’t test with the hardware; instead the hardware guys test with your game. That’s how it looks for a clueless observer like me at least.

So far this unit test suite was really helpful in a couple of ways: making of the just-announced Direct3D renderer and discovering new & exciting graphics card/driver workarounds that we have to do. Making of the suite did take a lot of time, but I’m happy with it!


Can you set OpenGL states independently?

Most of the time, yes, you can just set the needed states! You can set alpha blending on and turn light #0 off, and often nothing bad will happen. Blending will be on, and light #0 will be off. Fine.

Until you hit a graphics card (quite new - from 2006, it can even do pixel shader 2.0) that completely hangs up the machine in one of your unit tests. In fact, in the first unit test, that does almost nothing. Debugging that thing is total awesomeness - try something out, and the machine either hangs up or it does not. Reboot, repeat.

After something like 30 hang-ups I found the cause: you are damned if you set GL_SEPARATE_SPECULAR_COLOR and GL_COLOR_SUM to different values (i.e. use separate specular but don’t turn on color sum). Because, you know, some code was there that did not see a point in changing light mode color control when no lighting was on. So yeah, always set those two in sync. Just to please this card’s drivers.

It’s hard for me to have any faith in driver developers. I know that their job is hard, walking the fine line between correctness and getting decent benchmark scores… But still - hanging up the machine when two OpenGL 1.2 states are set to different values? Would you trust those people to write full fledged compilers?


Electronic Arts STL

A paper on Electronic Arts’ implementation of Standard Template Library.

Is it insane or the only sane thing to do? It’s insane amount of work, but it looks like they know what they’re doing. STL is broken in many ways, especially on memory limited systems… Now they could release it as open source with a decent license!


Debugging story: video memory leaks

I ranted about OpenGL p-buffers a while ago. Time for the whole story!

From time to time I hit some nasty debugging situation, and it always takes ages to figure out, and the path to the solution is always different. This is an example of such a debugging story.

While developing shadow mapping I implemented a “screen space shadows” thing (where cascaded shadow maps are gathered into a screen-space texture and shadow receiver rendering later uses only that texture). Then while being in the editor and maximizing/restoring the window a few times, everything locks up for 3 or 5 seconds, then resumes normally.

So there’s a problem: a complete freeze after editor window is being resized after a couple of times (not immediately!), but otherwise everything just works. Where is the bug? What caused it?

Since shadows were working fine before, and I never noticed such lock-ups - it must be the screen-space shadow gathering thing that I just implemented, right? (Fast-forward answer: no) So I try to figure out where the lock-up is happening. Profiling does not give any insights - the lock-up is not even in my process, instead “somewhere”. Hm… I insert lots of manual timing code around various code blocks (that deal with shadows). They say the lock-up most often happens when activating a new render texture (an OpenGL p-buffer), specifically, calling a glFlush(). But not always, sometimes it’s still somewhere else.

After some head-scratching, a session with OpenGL Driver Profiler reveals what is actually happening - video memory is leaked! Apparently Mac OS X “virtualizes” VRAM, and when it runs out, the OS will still happily create p-buffers and so on, it will just start swapping VRAM contents to AGP/PCIe area. This swapping causes the lock-up. Ok, so now I know what is happening, I just need to find out why.

I look at all the code that deals with render textures - it looks ok. And it would be pretty strange if a VRAM leak would be unnoticed for two years since Unity is out in the wild… So that must be the depth render textures that are causing a leak (since they are a new type for the shadows), right? (Answer: no)

I build a test case that allocates and deallocates a bunch of depth render textures each frame. No leaks… Huh.

I change my original code so that it gathers screen-space shadows onto the screen directly, instead of the screen-sized texture. No leaks… Hm… So it must be the depth render texture followed by screen-size render texture, that is causing the leaks, right? (Answer: no) Because when I have just the depth render texture, I have no leaks; and when I have no depth render texture, instead I gather shadows “from nothing” into a screen-size texture, I also have no leaks. So it must be the combination!

So far, the theory is that rendering into a depth texture followed by creation of screen-size texture will cause a video memory leak (Answer: no). It looks like it leaks the amount that should be taken by depth texture (I say “it looks” because in OpenGL you never know… it’s all abstracted to make my life easier, hurray!). Looks like a fine bug report, time to build a small repro application that is completely separate from Unity.

So I grab some p-buffer sample code from Apple’s developer site, change it to also use depth textures and rectangle textures, remove all unused cruft, code the expected bug pattern (render into depth texture followed by rectangle p-buffer creation) and… it does not leak. D’oh.

Ok, another attempt: I take the p-buffer related code out of Unity, build a small application with just that code, code the expected bug pattern and… it does not leak! Huh?

Now what?

I compare the OpenGL call traces of Unity-in-test-case (leaks) and Unity-code-in-a-separate-app (does not leak). Of course, the Unity case does a lot more; setting up various state, shaders, textures, rendering actual objects with actual shaders, filtering out redundant state changes and whatnot. So I try to bring in bits of stuff that Unity does into my test application.

After a while I made my test app leak video memory (now that’s an achievement)! Turns out the leak happens when doing this:

  1. Create depth p-buffer

  2. Draw to depth p-buffer

  3. Copy it’s contents into a depth texture

  4. Create a screen-sized p-buffer

  5. Draw something into it using the depth texture

  6. Release the depth texture and p-buffer

  7. Release the screen-sized p-buffer

My initial test app was not doing step 5… Now, why the leaks happens? Is it a bug or something I am doing wrong? And more importantly: how to get rid of it?

My suspicion was that OpenGL context sharing was somehow to blame here (finally, a correct suspicion). We share OpenGL contexts, because, well, it’s the only sane thing to do - if you have a texture, mesh or shader somewhere, you really want to have it available both to the screen and when rendering into something else. The documentation on sharing of OpenGL contexts is extremely spartan, however. Like: “yeah, when they are shared, then the resources are shared” - great. Well, the actual text is like this (Apple’s QA1248):

All sharing is peer to peer and developers can assume that shared resources are reference counted and thus will be maintained until explicitly released or when the last context sharing resources is itself released. It is helpful to think of this in the simplest terms possible and not to assume excess complication.

Ok, I am thinking of this in the simplest terms possible… and it leaks video memory! The docs do not have a single word on how the resources are reference counted and what happens when a context is deleted.

Anyway, armed with my suspicion of context sharing being The Bad Guy here, I tried random things in my small test app. Turns out that unbinding any active textures from a context before switching to new one got rid of the leak. It looks like objects are refcounted by contexts, and they are not actually deleted while they are bound in some context (that is what I expect to happen). However, when a context itself is deleted, it seems as if it does not decrease refcounts of these objects (that is definitely what I don’t expect to happen). I am not sure if that’s a bug, or just undocumented “feature”…

All happy, I bring in my changes to the full codebase (“unbind any active textures before switching to a new context!”)… and the leak is still there. Huh?

After some head-scratching and randomly experimenting with whatever, turns out that you have to unbind any active “things” before switching to a new context. Even leaving a vertex buffer object bound can make a depth texture memory be leaked when another context is destroyed. Funky, eh?

So that was some 4 days wasted on chasing the bug that started out as “mysterious 5 second lock-ups”, went through “screen-space shadows leak video memory”, then through “depth textures followed by screen-size textures leak video memory” and through “unbind textures before switching contexts” to “unbind everything before switching contexts”. Would I have guessed it would end up like this? Not at all. I am still not sure if that’s the intended behavior or a bug; it looks more like a bug to me.

The take-away for OpenGL developers: when using shared contexts, unbind active textures, VBOs, shader programs etc. before switching OpenGL contexts. Otherwise at least on Mac OS X you will hit video memory leaks.

It’s somewhat sad that I find myself fighting issues like that most of my development time - not actually implementing some cool new stuff, but making stuff actually work. Oh well, I guess that is the difference between making (tech)demos and an actual software product.