tl;dr: Just spent a week in Iceland and it was awesome!
Some folks have asked for impressions of my Iceland vacation or some advice, so here it goes. Caveats: my first (and only so far) trip there, we went with kids, came up with the itinerary ourselves (with some advice from friends), etc.
Our trip was one week; myself, my wife and two kids (10 and 4yo). If you’re going alone, or for a honeymoon, or with a group of friends, the experience might be very different. Without small kids, I’d go for longer than a week, and try to wander further away from main roads.
Planning
Summary of what we wanted:
- Go in summer so it’s fairly warm.
- Stay away from people ;) Well, at least a bit.
- No serious hiking climbing; just rent a car and go places.
Asking friends, reading the internets (wikitravel, wikipedia, lonely planet, random blogs), came up with a list of “places I’d like to go”. Used Google Maps Engine Lite to layout the plan, and google maps to estimate driving times.
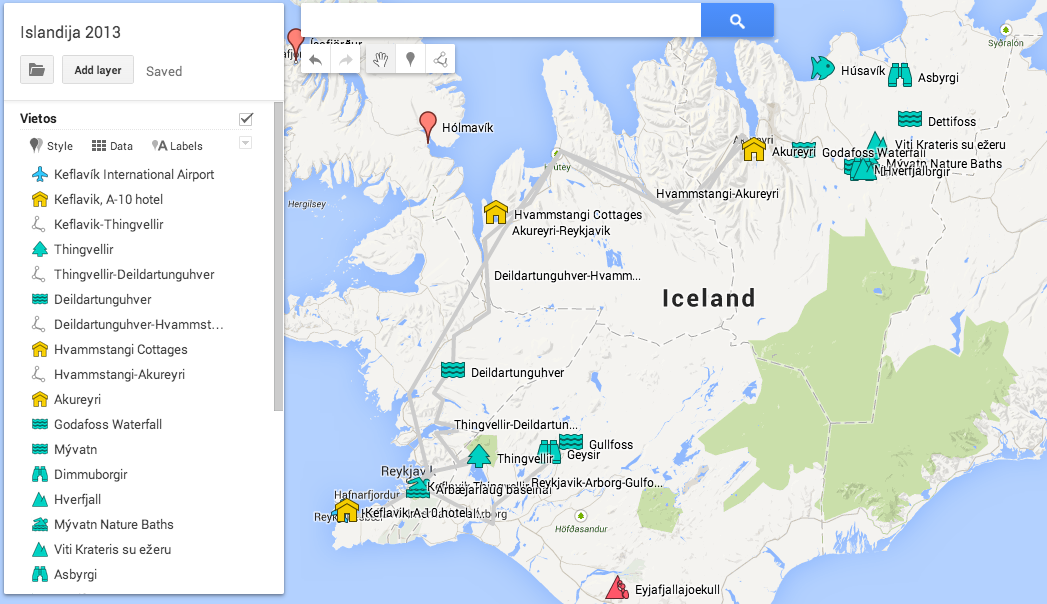
The plan was mostly to explore the nothern part of Iceland, staying in Akureyri for 3 nights; and last two nights in Reykjavik.
We booked everything in advance. Larger places (Akureyri and Reykjavik) through airbnb – so far all my experiences with airbnb have been very positive, and it’s much nicer to stay in an actual apartment instead of some generic hotel/guesthouse. Towns in Iceland are extremely small though - Akureyri, being the 2nd largest city outside of Reykjavik area, is only 18000. Which means airbnb is only really practical in Reykjavik & Akureyri. We booked some small cottages & guesthouses for several nights elsewhere (through tripadvisor, booking.com etc.).
Driving
Rented a car in advance as well. For the first Iceland trip decided to go “casual driving”. Car rental is expensive. In our case, we paid as much for a simple Renault Megane as we paid for all the housing. Rent a local GPS; neither Apple nor Google maps have very good road coverage, and cell connectivity might be shaky in more remote places.
Paved roads (the 1 “ring road” and most of two-digit roads) are good quality but not wide. Larger gravel roads are okay. Smaller gravel roads are small and rocky – and we didn’t even go to more mountain places. Big chunk of area inside the land is only accessible by 4x4 vehicles; which we decided not to do this time.
Notes! When a sign says “blindhæd”, it means exactly that - a road goes through a top of some hill and you wouldn’t see a car approaching in front. Gas stations are around towns, but you can easily have 100km without a single station in between. Some clouds literally sit on the ground; and visibility while driving through that is really, really bad - couple dozen meters. Sheep often found on the gravel roads. A lot of bridges that are only wide enough for one car. Driving off-road is illegal to preserve vegetation (hey it takes several thousand years for even moss to start growing on lava fields).
Generaly driving conditions are okay (in summer and good weather at least ;)), there’s little traffic going on, and other drivers are very considerate. When two cars have to pass by on a narrow road, one of them often carefully stops several hundred meters away to let the other through. For me, the hardest thing was just that driving 4-5 hours each day is tiring (hey my usual daily dose is 30 minutes! and I don’t like driving to begin with). That, and driving through the clouds - your eyes are used to scanning the road at least several hundred meters ahead, but you can’t quite do that in the cloud.
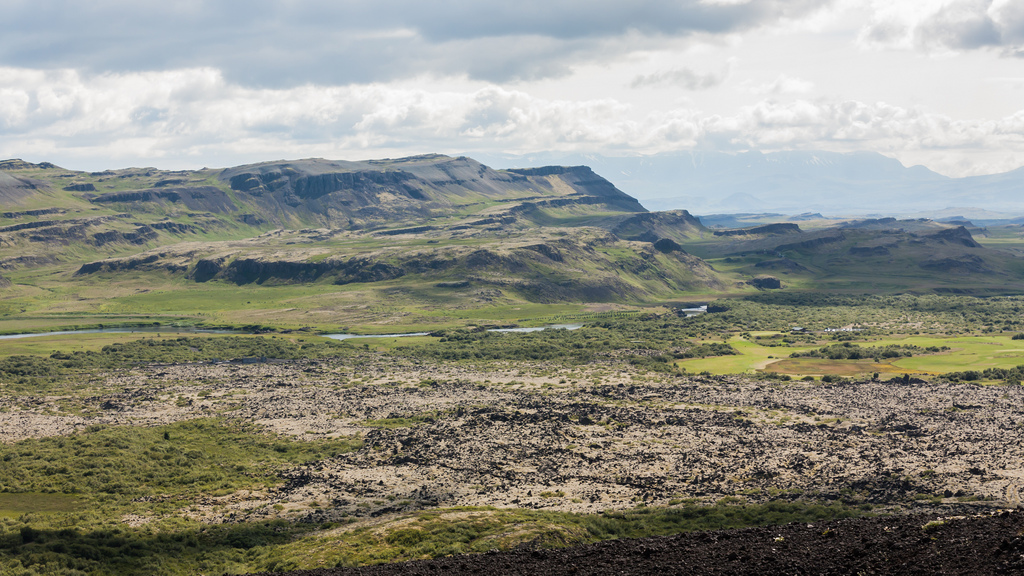
Next time I’m going there, I want to get a 4x4 and go more remote places. The beauty and non-Earthiness of the landscapes is too stunning.
Next up: travel log with pictures. SPOILER ALERT!
Day 1: Þingvellir and Deildartunguhver
Landed in Keflavik airport past midnight, got our car and slept over in some guesthouse in Keflavik itself.
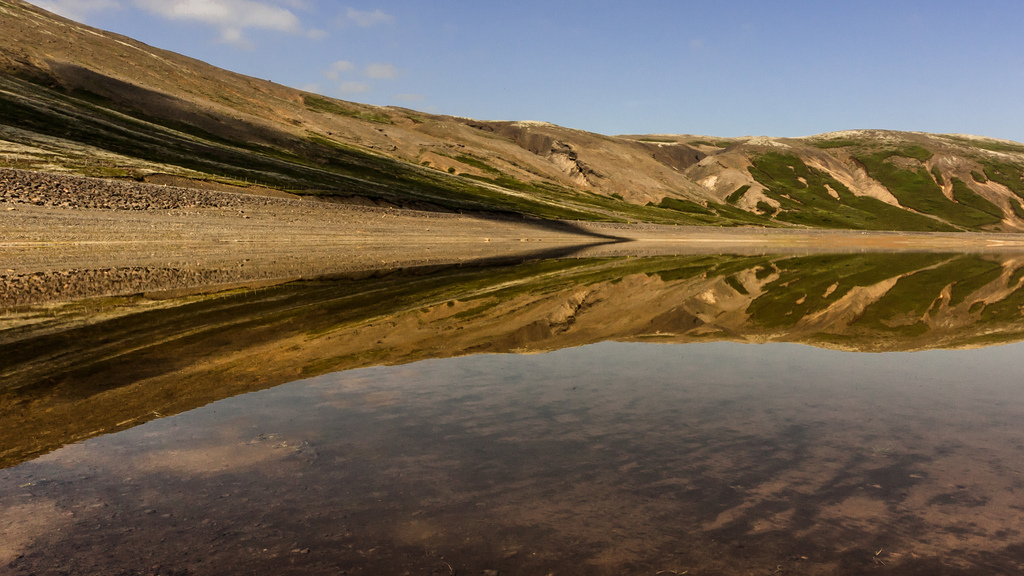
Þingvellir park with rift valley - somewhat too many people for my taste ;). Took smaler gravel roads up north. Surprise find - a lake with flat as a mirror surface; I didn’t even notice the lake at first. Sandkluftavatn is the name.
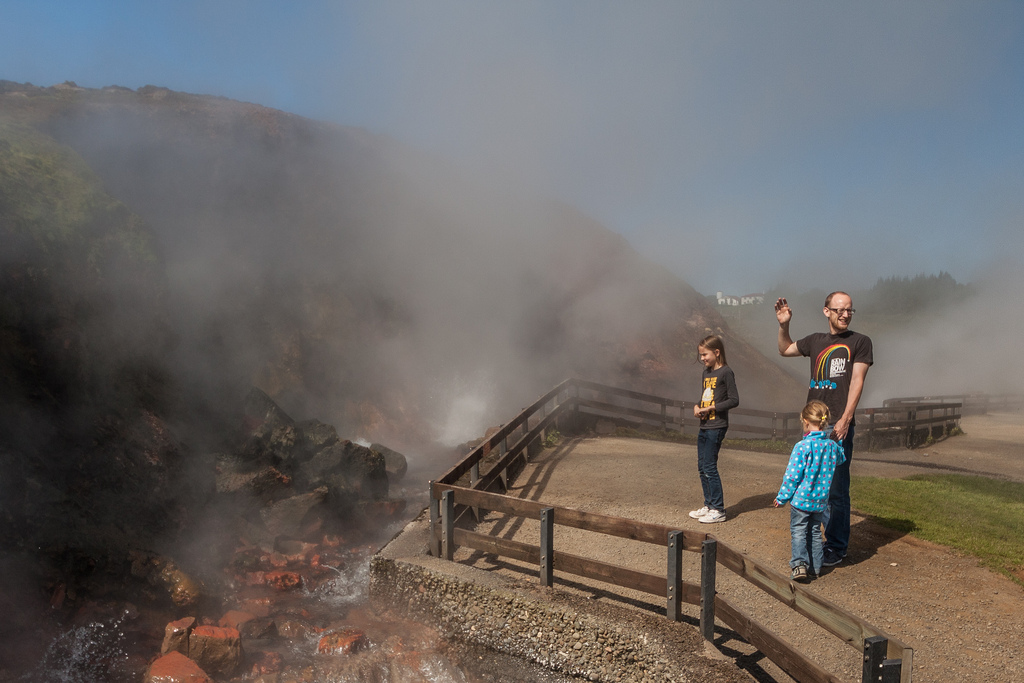
Deildartunguhver hot springs. Fairly impressive to see boiling water coming out of the earth, just like that.
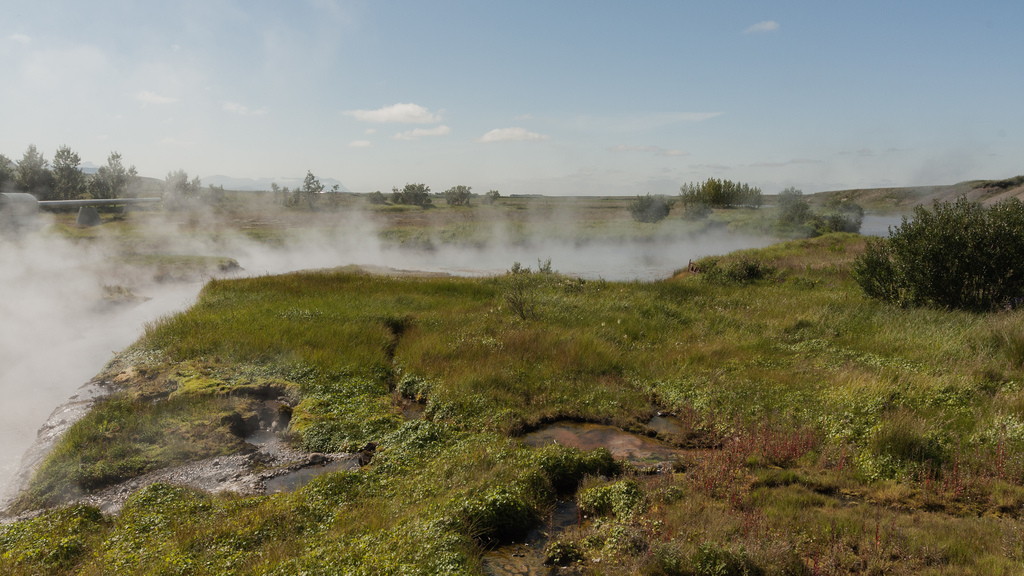
Also, the smell! This is a common theme - Iceland has abundant hot water that’s used for heating & stuff, but most of it has that hard boiled eggs sulfur smell. They somehow do not mention the smell in, for example, Blue Lagoon advertising material ;)
Pathfinding in the GPS led us through some scary road where 7km lasted forever, mostly in 1st gear and trying to avoid damaging the car’s underside or rolling off a hill. A jeep would have been useful. A fence sign that could either be interpreted as “you’ll be shot for going there” or “no shooting here” provided some nice ambiguity! That was the only scary driving experience I had. Moral here: if you’re entering a road and wondering “I wonder if my car is really good for this”, turn around now. The road will not get better!
Rest of the day, highway up to Hvammstangi, slept over in small, simple & nice cottages. “Double story bed, yay!!!” – kids.
Day 2: to Akureyri
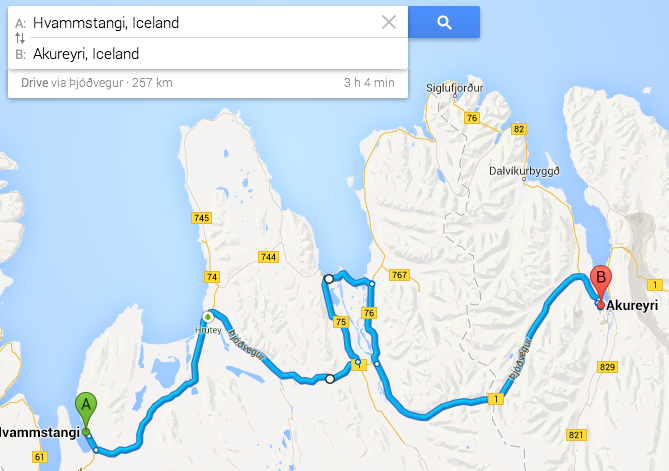
The plan was “just get from Hvammstangi to Akureyri”. Took a little detour to Skagafjördur.
Settled down in Akureyri, which we used as our “home base” for 3 nights. Really lovely town! Just small enough to be, well, small; and just large enough to have decent places to eat ;) Kids loved the swimming pool. Due to lots of natural hot water, swimming pools are everywhere in Iceland, and they are extremely cheap.
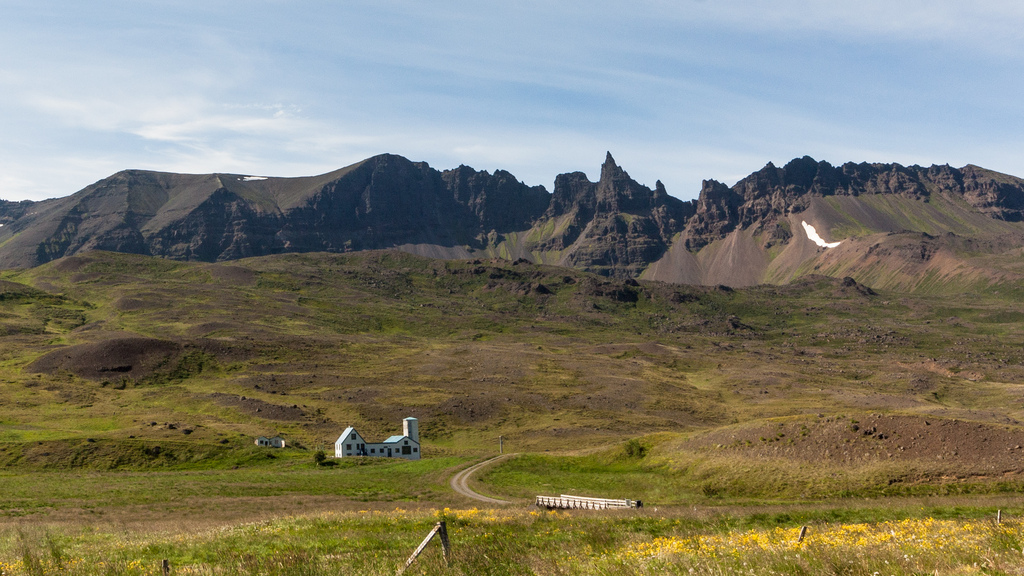
Day 3: Ásbyrgi, Dettifoss, Mývatn
Just found out now that our trip almost went along the “Diamond Circle” route. Akureyri -> Husavik -> Ásbyrgi -> Dettifoss -> Mývatn.
From Husavik people usually go on whale watching tours, but we only stopped for cupcakes.
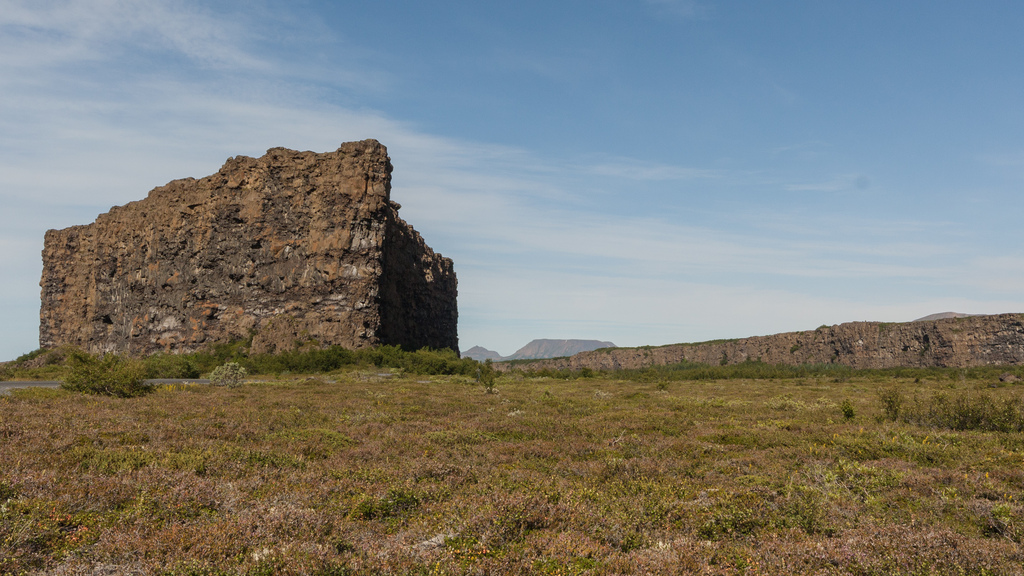
Ásbyrgi canyon is impressive; hard to imagine all that being caused by water.
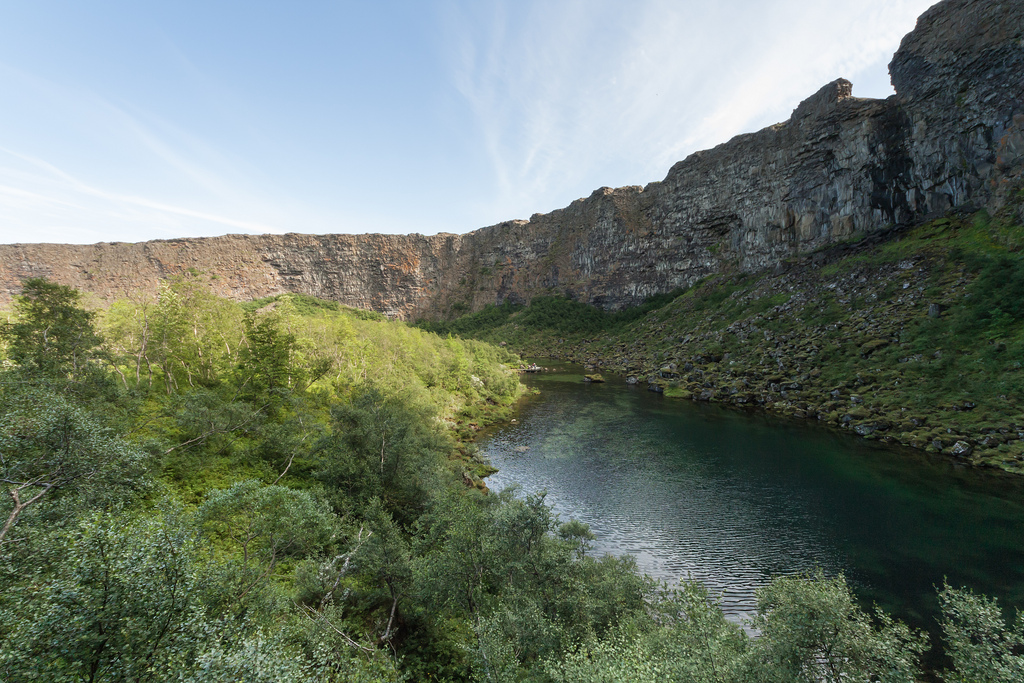
From the internets I imagined Ásbyrgi to be a cube of rock in the middle of nowhere; most of the photos show it like this. It’s not a cube; that’s just one end of a long wall.
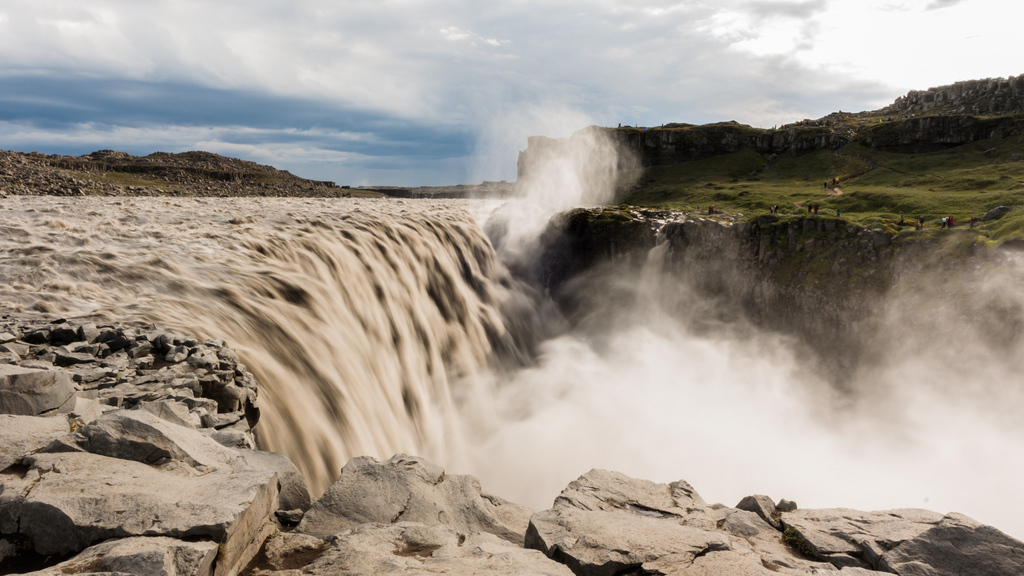
Dettifoss is big, but I don’t have photos to do it justice. We went on the east side which is more gravel driving, but supposedly better view.
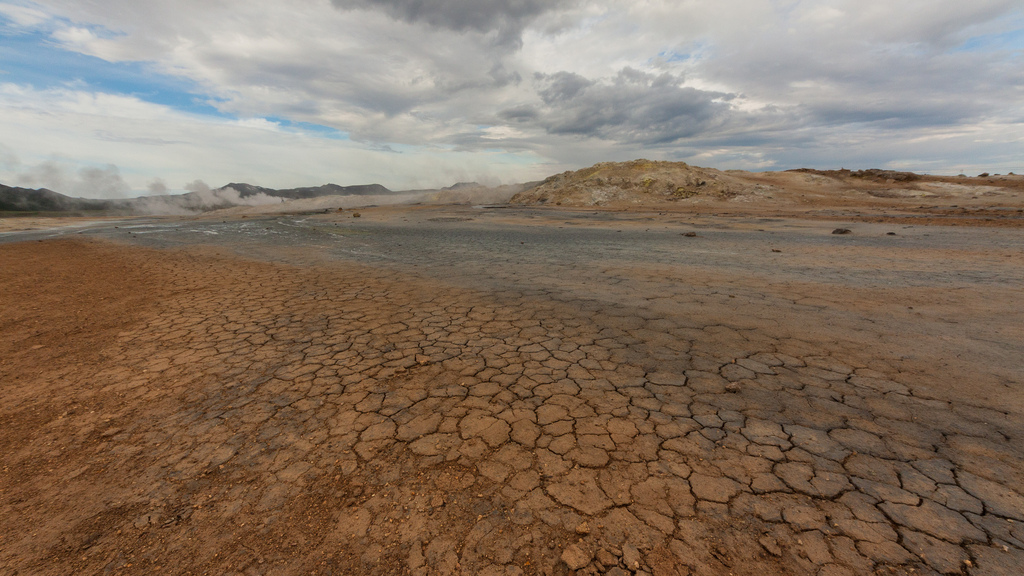
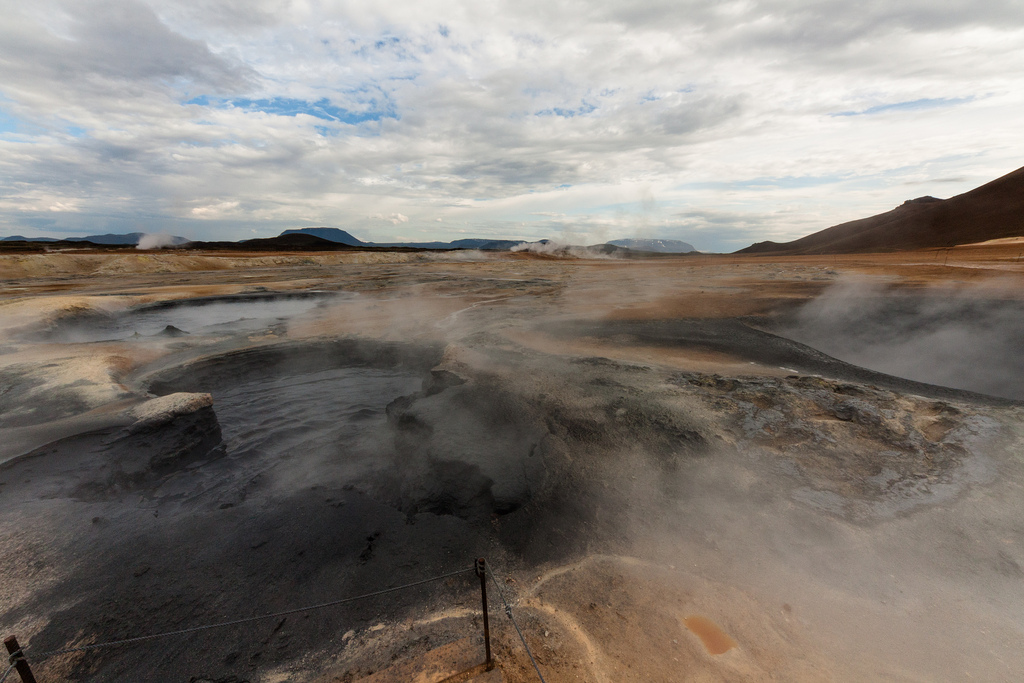
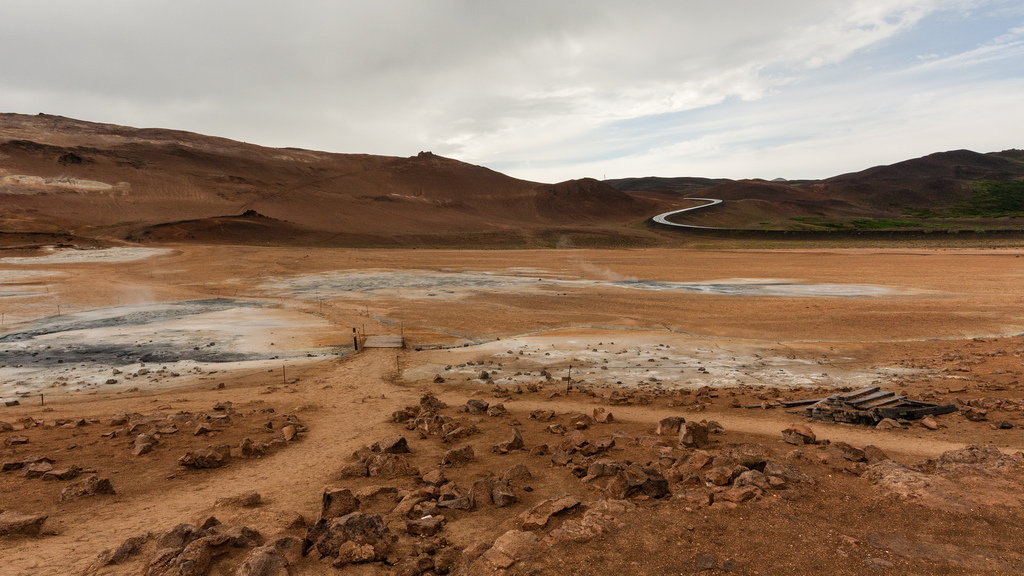
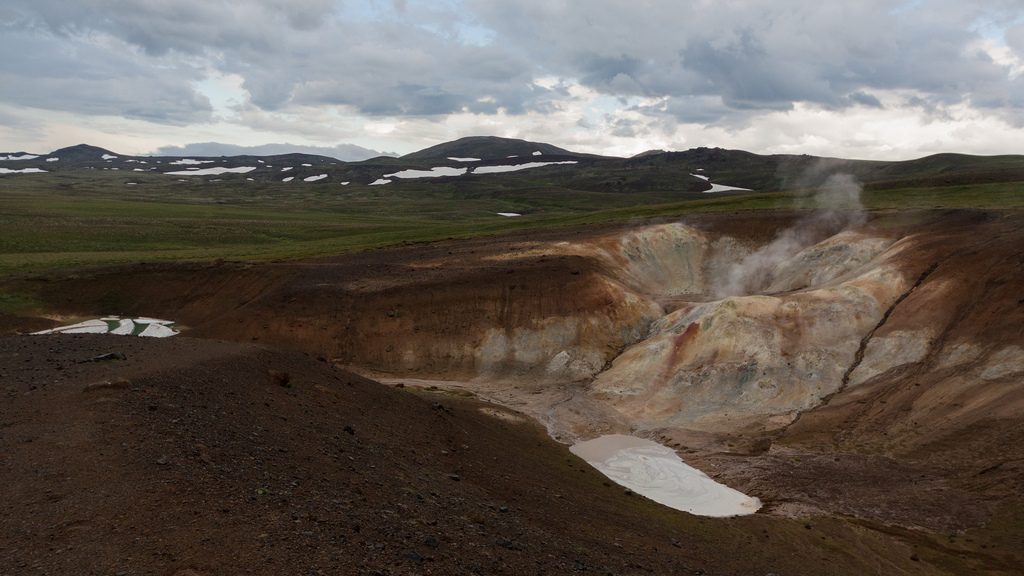
On our way back, accidental find - Hverarönd which gets you wondering “are we still on Earth?” - a bunch of fumaroles and mudpots.
Next up, Mývatn nature baths which folks say is a less touristy version of Blue Lagoon (we haven’t been to that one). Less crowded = good in my book; even if Mývatn ones are still quite crowded. Water from 36 to 45˚C (97 to 113 F), sulfur smell, oh my!
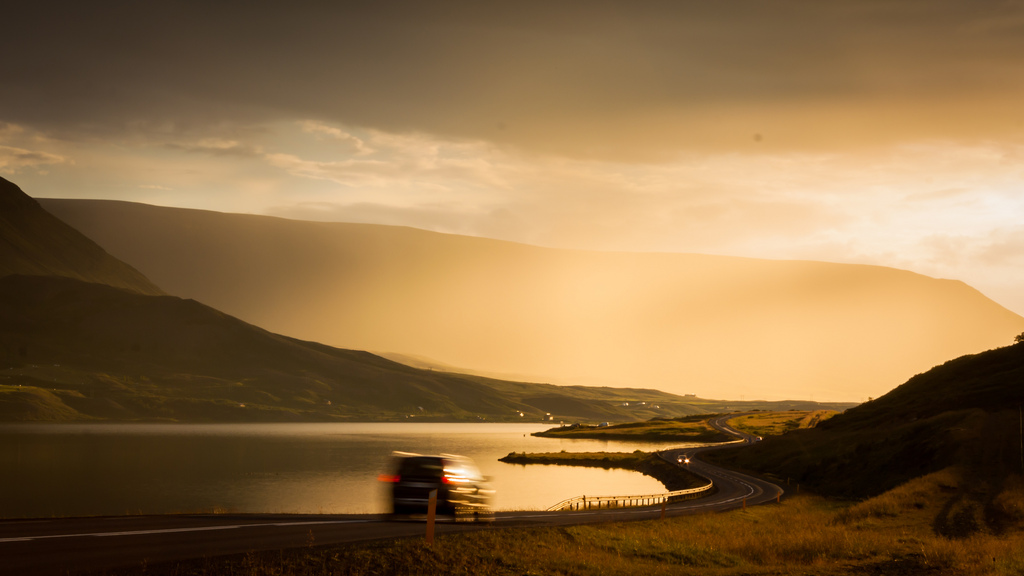
Drive back to Akureyri and observe sunlight scattering in distant cloud of rain.
Day 4: Godafoss, Dimmuborgir, Viti
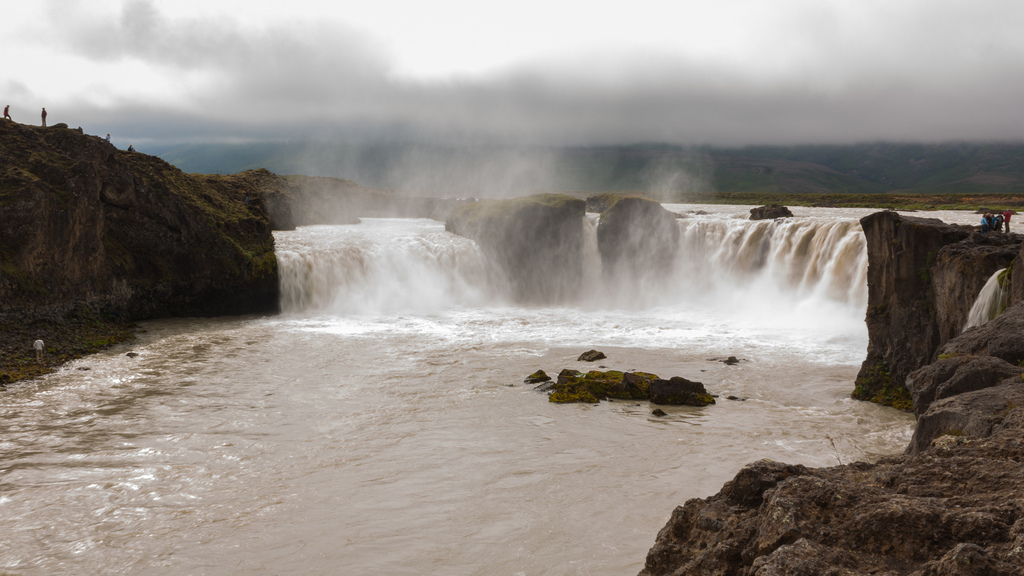
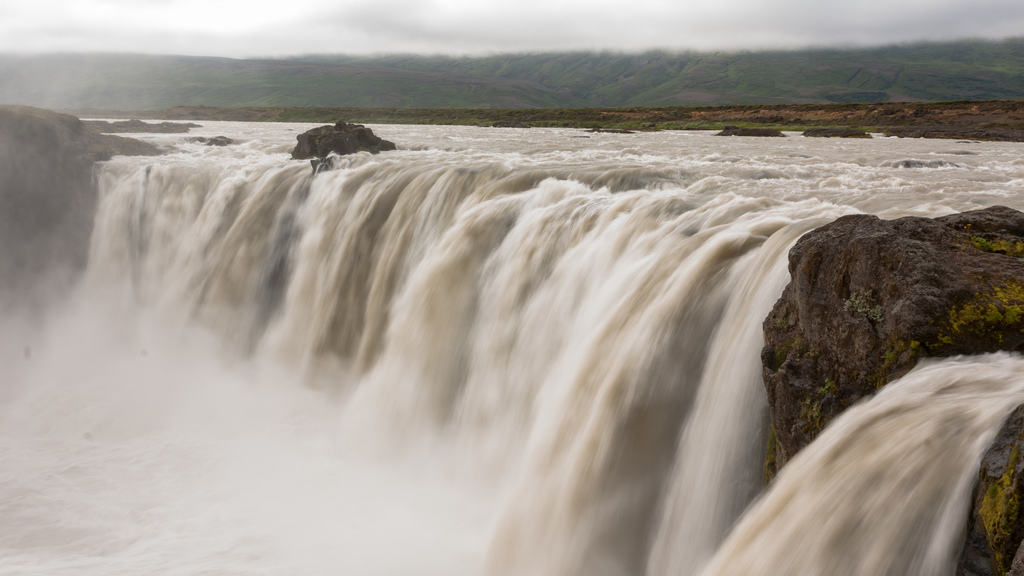
Same area around Mývatn. Godafoss waterfall:
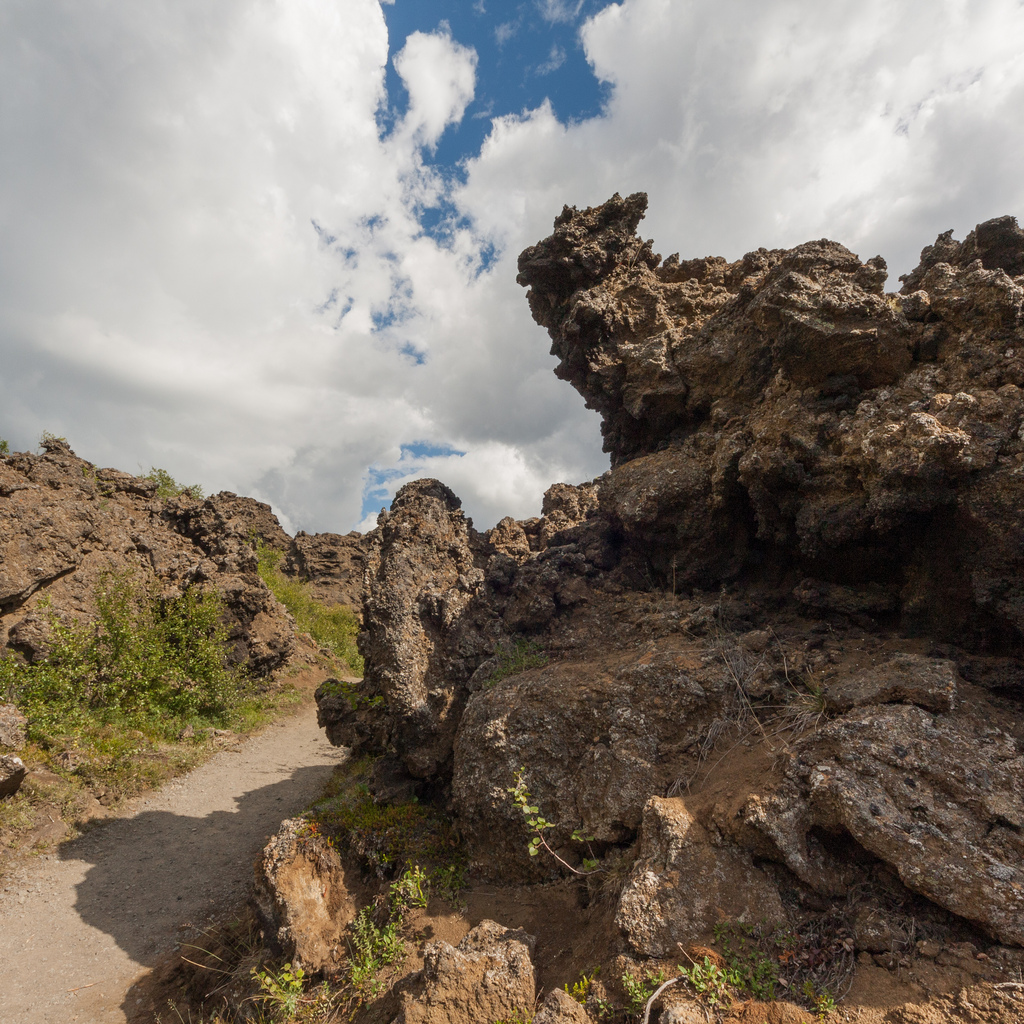
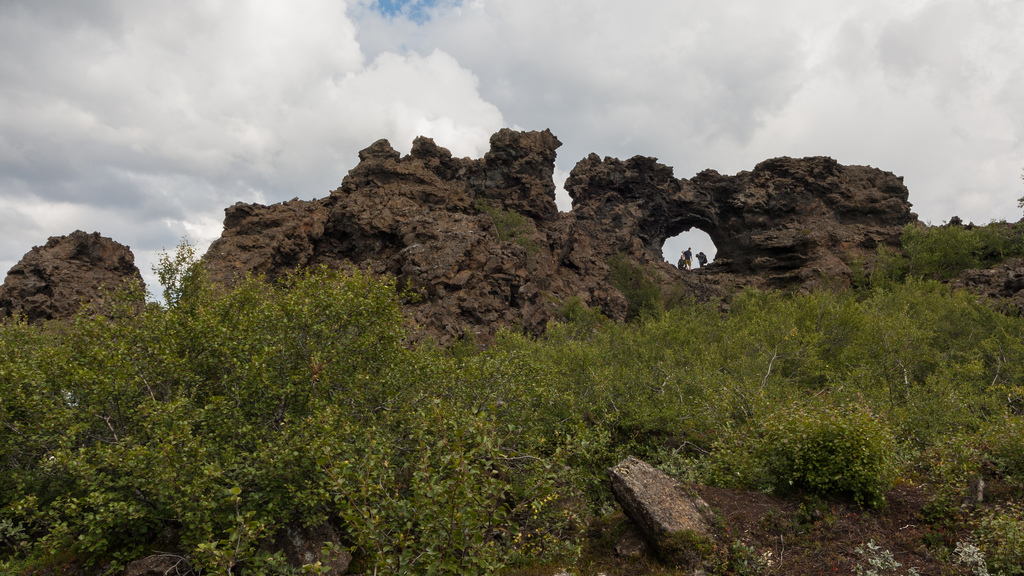
Dimmuborgir, which I wanted to check out if only because of
Dimmu Borgir. It’s okay. Not metal though ;)
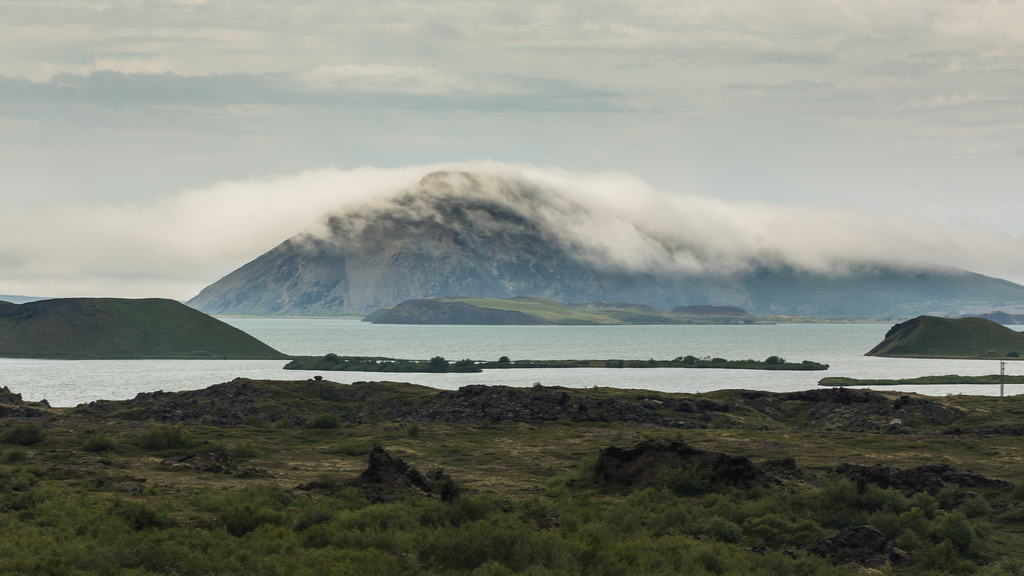
Cloud rolling over a mountain:
There’s also a Hverfjall crater right next to Dimmuborgir, but we decided not to climb it with kids. Next time?
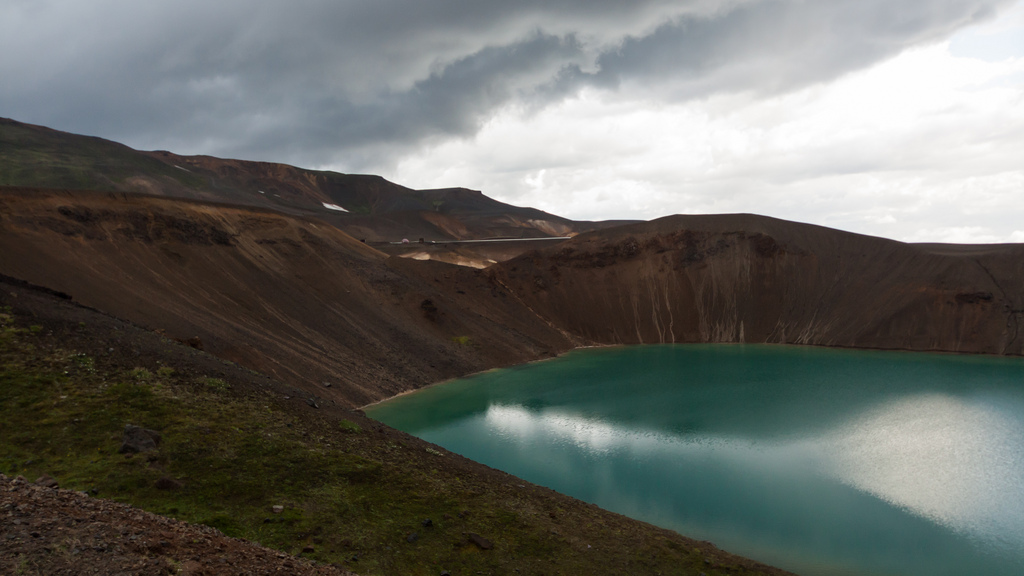
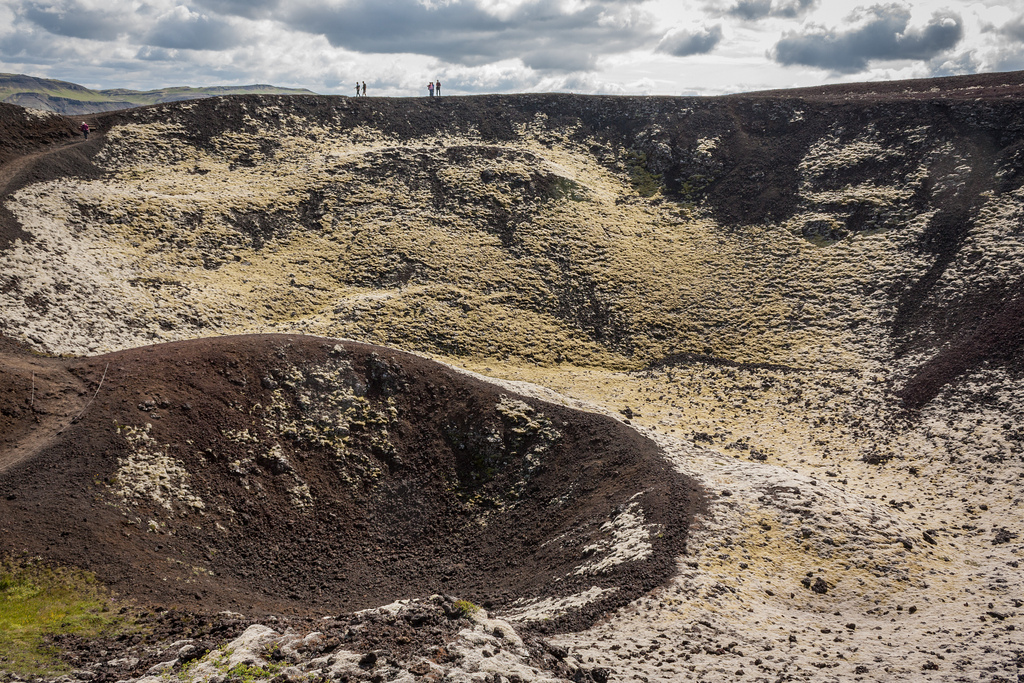
Víti crater near Krafla, and some fumaroles right next to it.
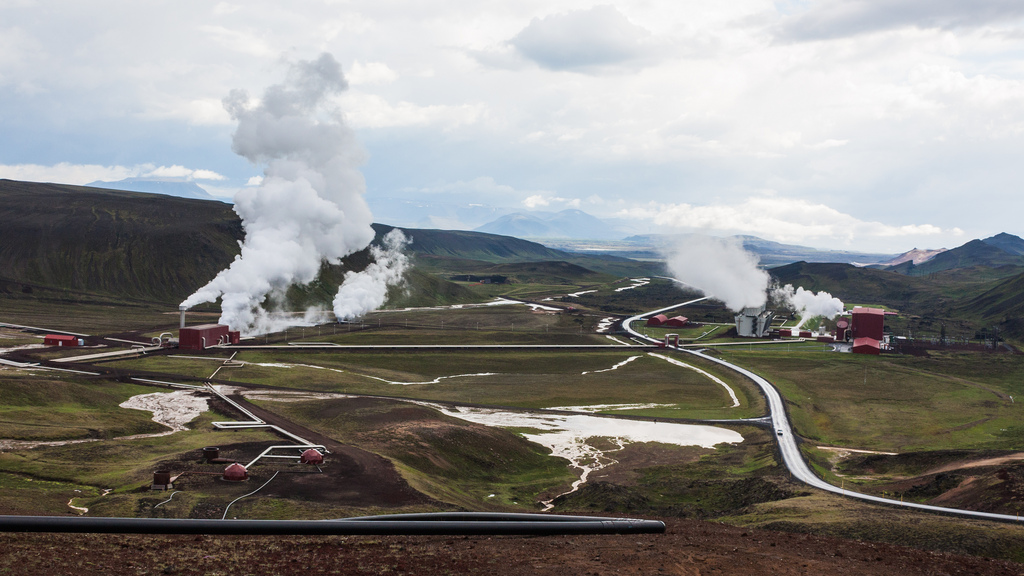
Thermal power plants there look like some alien constructions, with pipes spanning vast distances. Here, Krafla power station:
Day 5: to Reykjavik
Long drive from Akureyri to Reykjavik. Unplanned find, Grábrók crater right next to the highway; in a group of 3 craters.
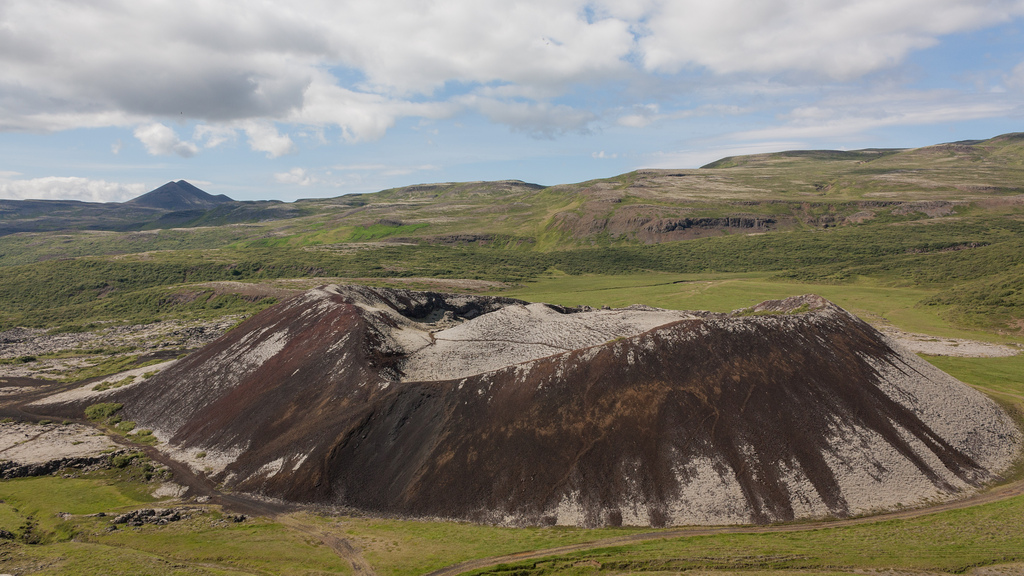
Nice fBm noise generator for the terrain you’ve got there, Iceland:
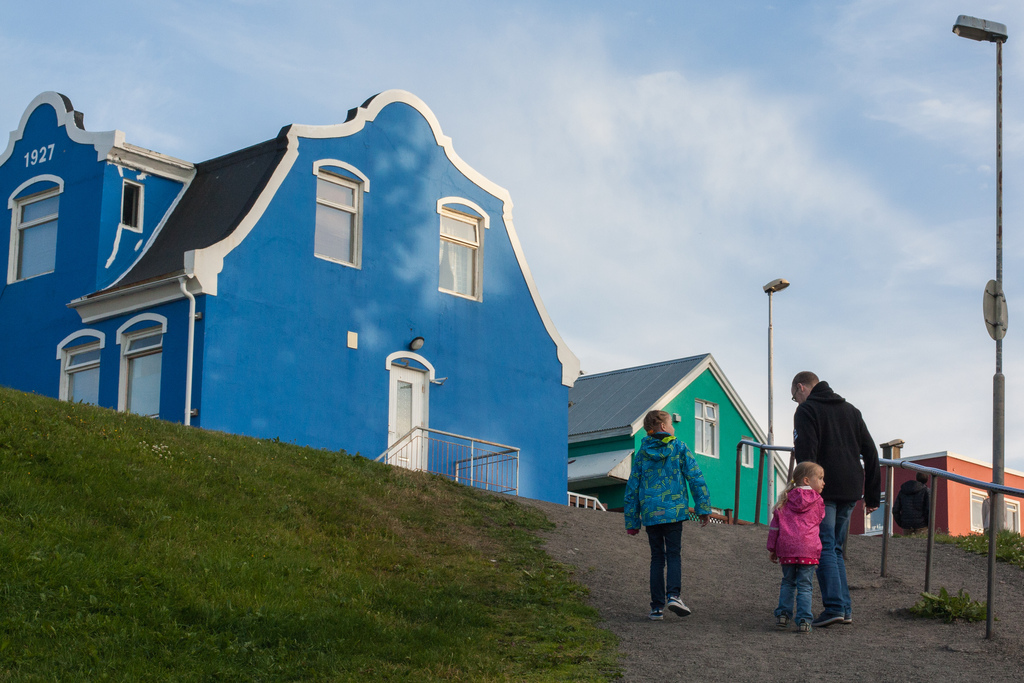
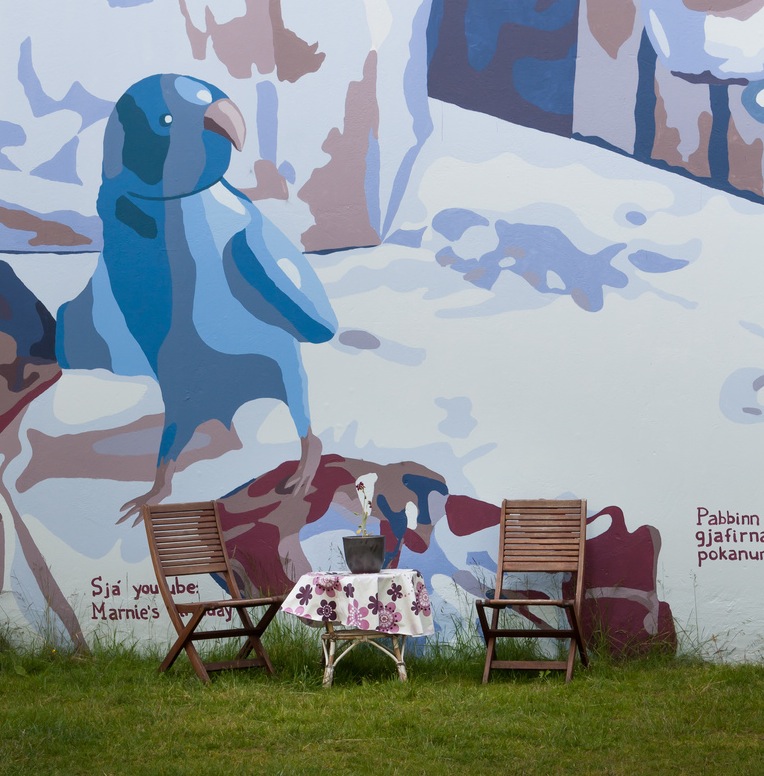
Arrive in Reykjavik, check out downtown. It’s full of colors!
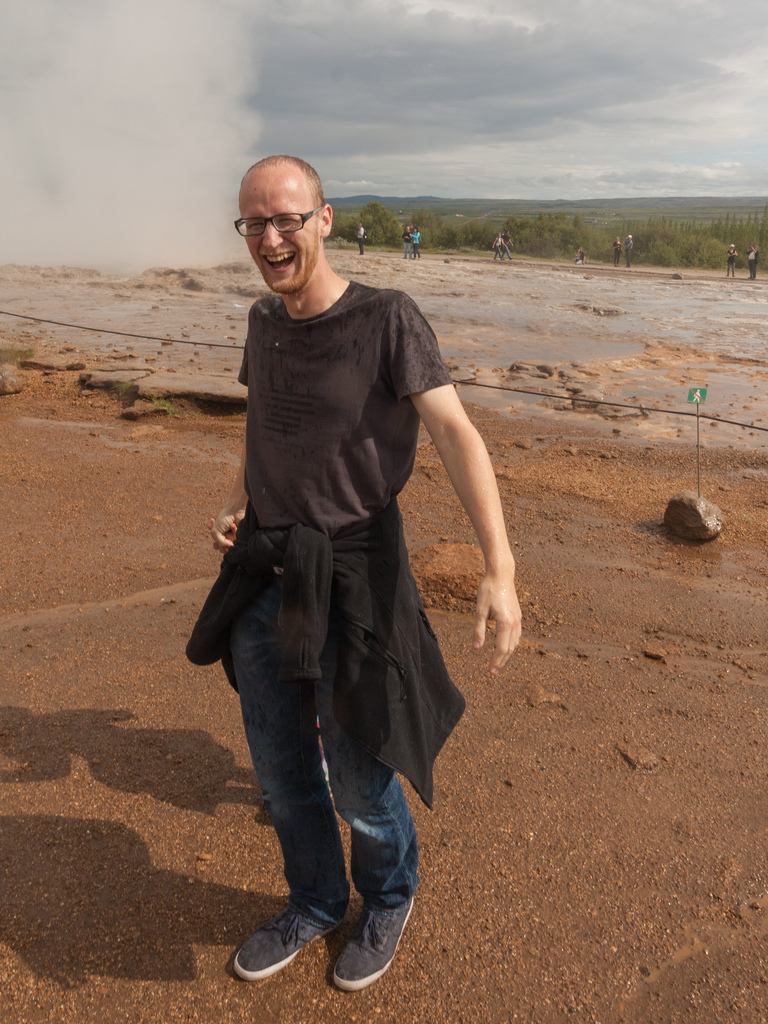
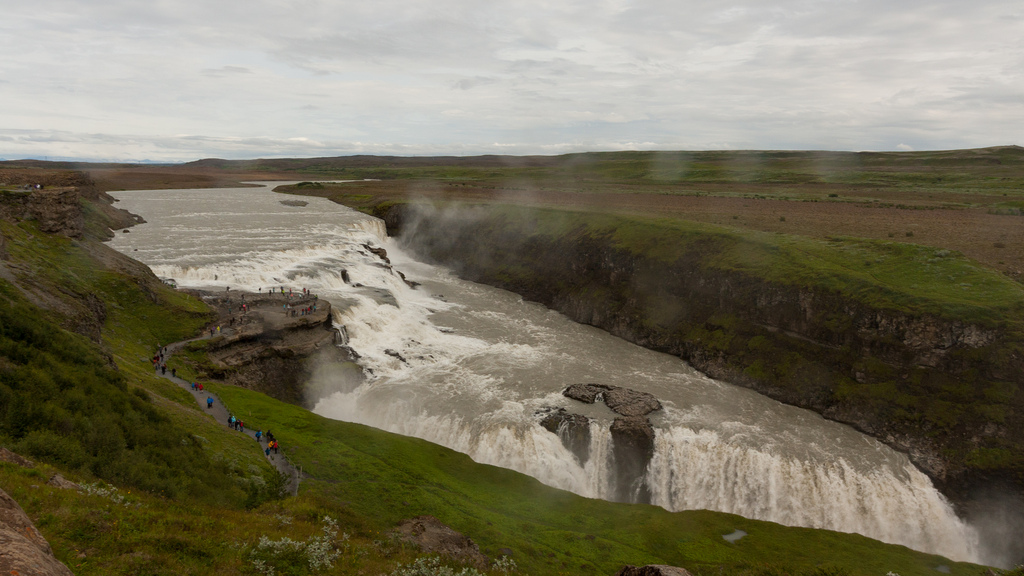
Day 6: Geysir, Gullfoss
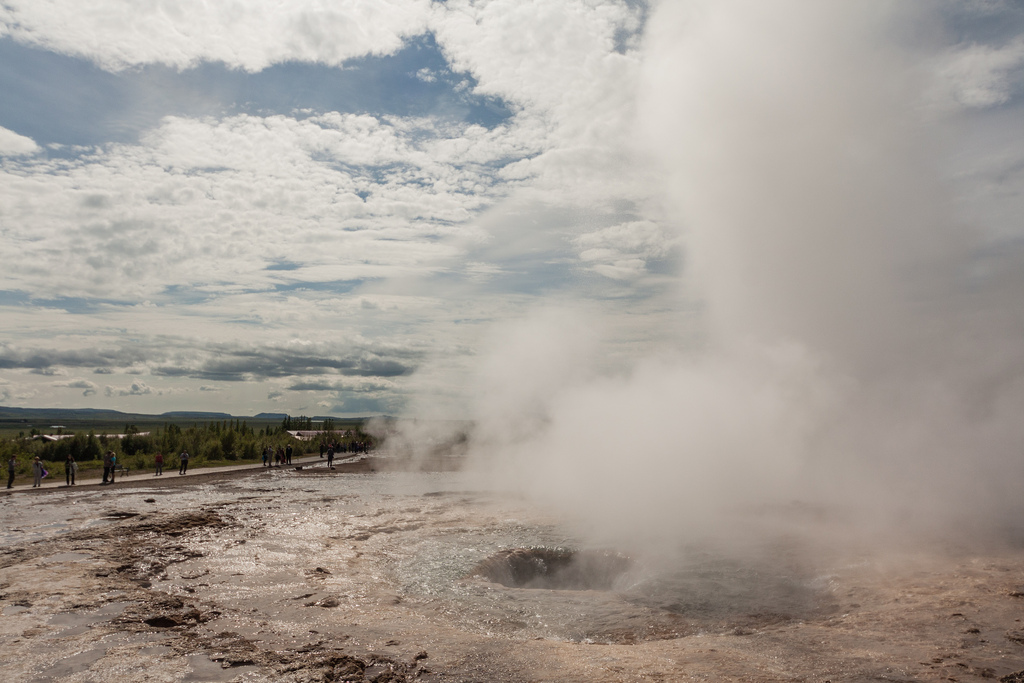
Geysir, the geyser that named them all, is mostly dormant now. However,
Strokkur right next to it goes off each 3-5 minutes. There’s a lot of people there and I initially was wary of that (“them tourists ruin everything!”) but geysers are indeed impressive.
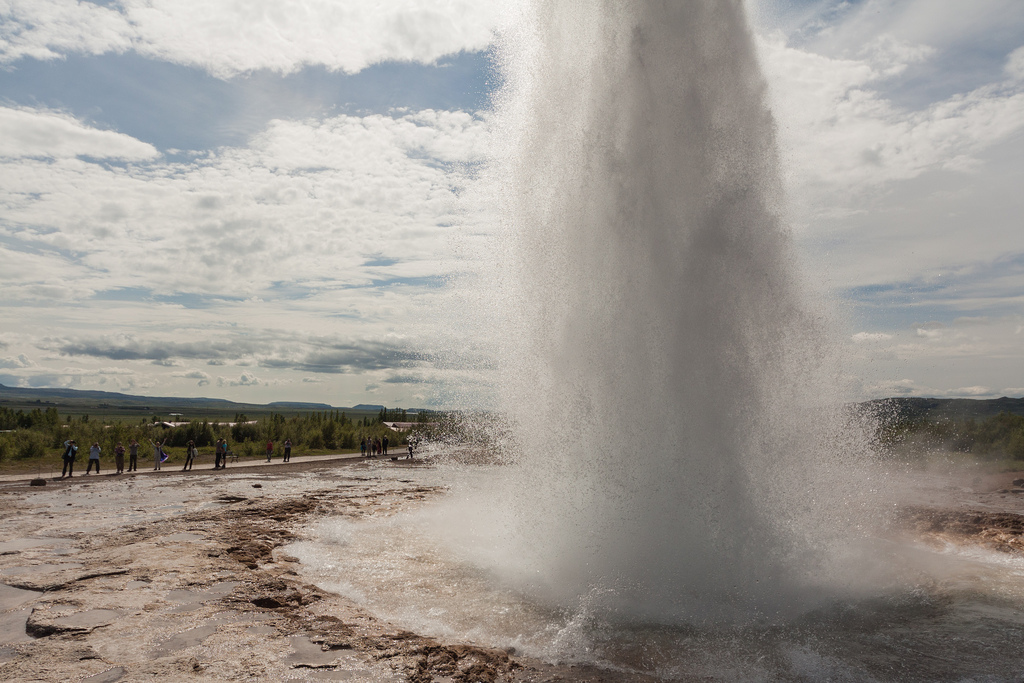
One of the eruptions, we were standing a bit further away to get a better view. Either the wind blew stronger, or the eruption was higher, or both – but the water just landed onto all of us. Good thing it was not hot. Achievement unlocked: got soaked by the geyser!
Gullfoss:
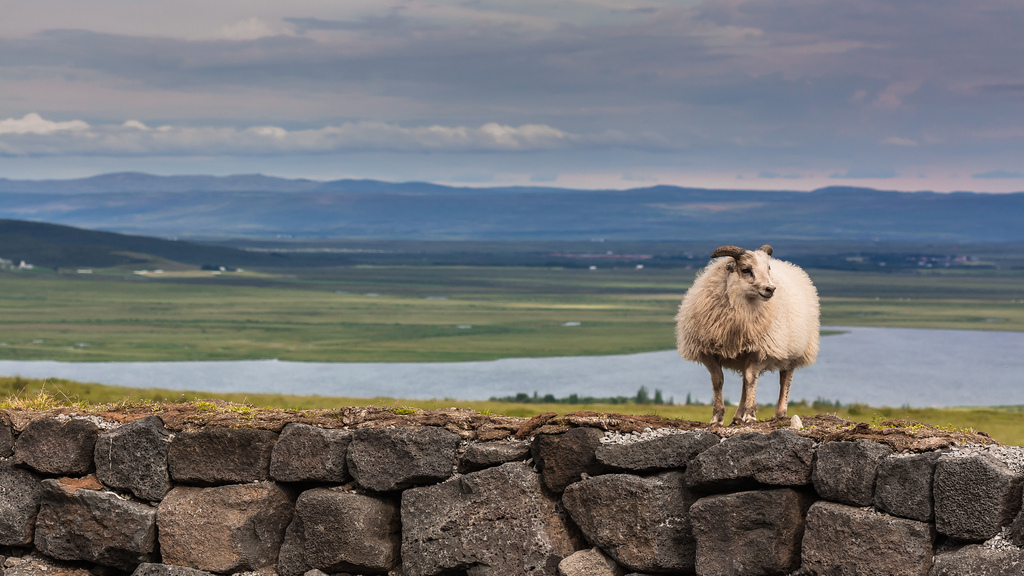
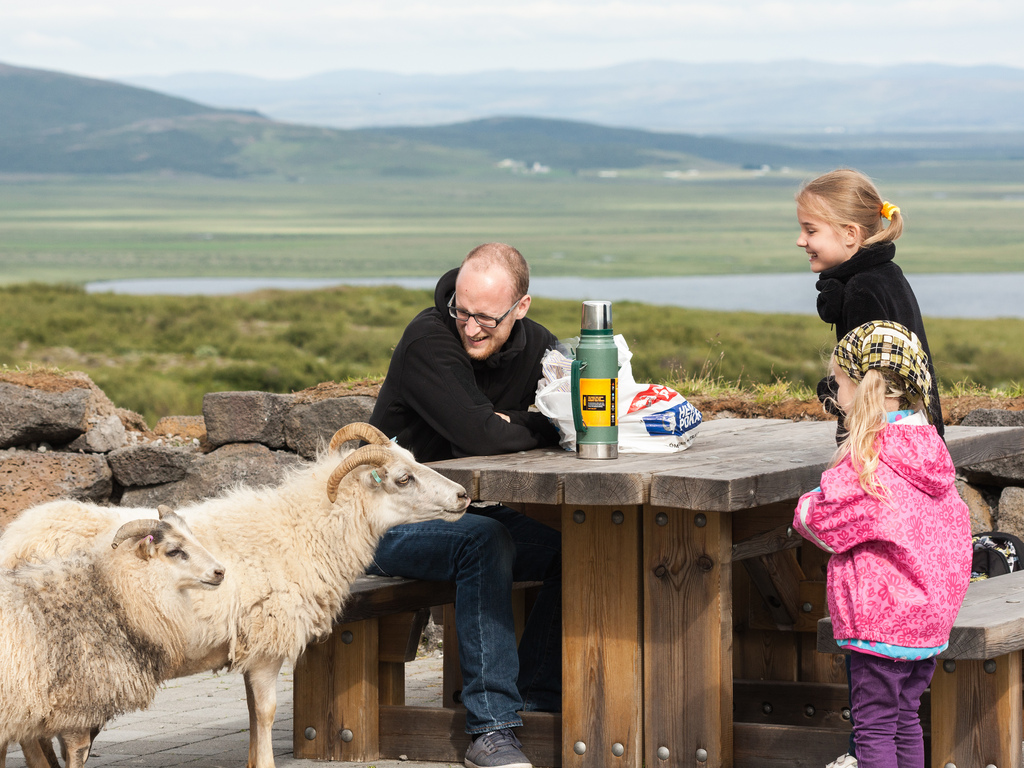
And finally, friendly sheep joining us for our lunch stop:
Next time?
This time, we’ve mostly been to the north and some major attractions around Reykjavik. Did not see any glaciers up close, nor anything that is in the south or middle. I guess that’s left for the next time(s). Update: “next time” has happened in 2018!
Most of the photos above shot by my wife Aistė. I’ll just end the post with this picture. BAA!