Optimizing Shader Info Loading, or Look at Yer Data!
A story about a million shader variants, optimizing using Instruments and looking at the data to optimize some more.
The Bug Report
The bug report I was looking into was along the lines of “when we put these shaders into our project, then building a game becomes much slower – even if shaders aren’t being used”.
Indeed it was. Quick look revealed that for ComplicatedReasons(tm) we load information about all shaders during the game build – that explains why the slowdown was happening even if shaders were not actually used.
This issue must be fixed! There’s probably no really good reason we must know about all the shaders for a game build. But to fix it, I’ll need to pair up with someone who knows anything about game data build pipeline, our data serialization and so on. So that will be someday in the future.
Meanwhile… another problem was that loading the “information for a shader” was slow in this project. Did I say slow? It was very slow.
That’s a good thing to look at. Shader data is not only loaded while building the game; it’s also loaded when the shader is needed for the first time (e.g. clicking on it in Unity’s project view); or when we actually have a material that uses it etc. All these operations were quite slow in this project.
Turns out this particular shader had massive internal variant count. In Unity, what looks like “a single shader” to the user often has many variants inside (to handle different lights, lightmaps, shadows, HDR and whatnot - typical ubershader setup). Usually shaders have from a few dozen to a few thousand variants. This shader had 1.9 million. And there were about ten shaders like that in the project.
The Setup
Let’s create several shaders with different variant counts for testing: 27 thousand, 111 thousand, 333 thousand and 1 million variants. I’ll call them 27k, 111k, 333k and 1M respectively. For reference, the new “Standard” shader in Unity 5.0 has about 33 thousand internal variants. I’ll do tests on MacBook Pro (2.3 GHz Core i7) using 64 bit Release build.
Things I’ll be measuring:
- Import time. How much time it takes to reimport the shader in Unity editor. Since Unity 4.5 this doesn’t do much of actual shader compilation; it just extracts information about shader snippets that need compiling, and the variants that are there, etc.
- Load time. How much time it takes to load shader asset in the Unity editor.
- Imported data size. How large is the imported shader data (serialized representation of actual shader asset; i.e. files that live in
Library/metadatafolder of a Unity project).
So the data is:
Shader   Import	   Load    Size
   27k    420ms   120ms    6.4MB
  111k   2013ms   492ms   27.9MB
  333k   7779ms  1719ms   89.2MB
    1M  16192ms  4231ms  272.4MB
Enter Instruments
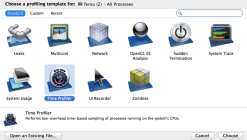
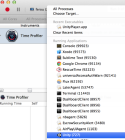
Last time we used xperf to do some profiling. We’re on a Mac this time, so let’s use Apple Instruments. Just like xperf, Instruments can show a lot of interesting data. We’re looking at the most simple one, “Time Profiler” (though profiling Zombies is very tempting!). You pick that instrument, attach to the executable, start recording, and get some results out.
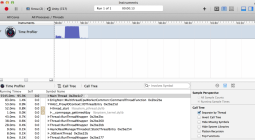
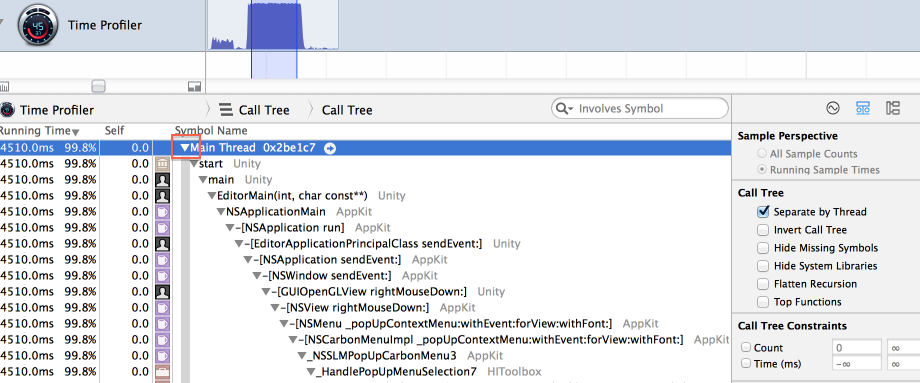
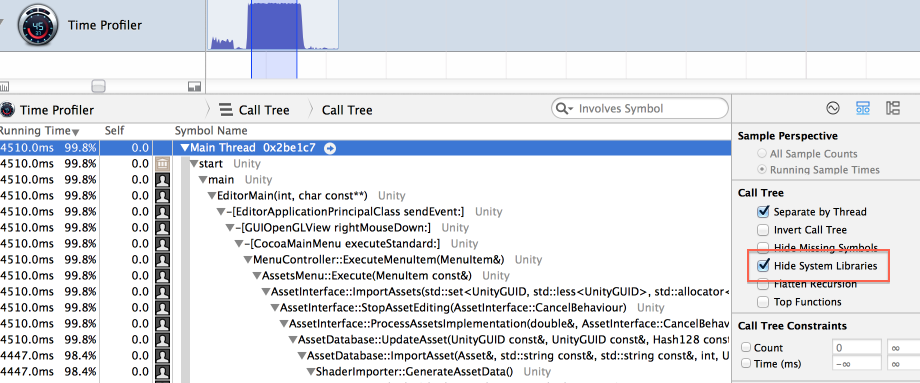
You then select the time range you’re interested in, and expand the stack trace. Protip: Alt-Click (ok ok, Option-Click you Mac peoples) expands full tree.
So far the whole stack is just going deep into Cocoa stuff. “Hide System Libraries” is very helpful with that:
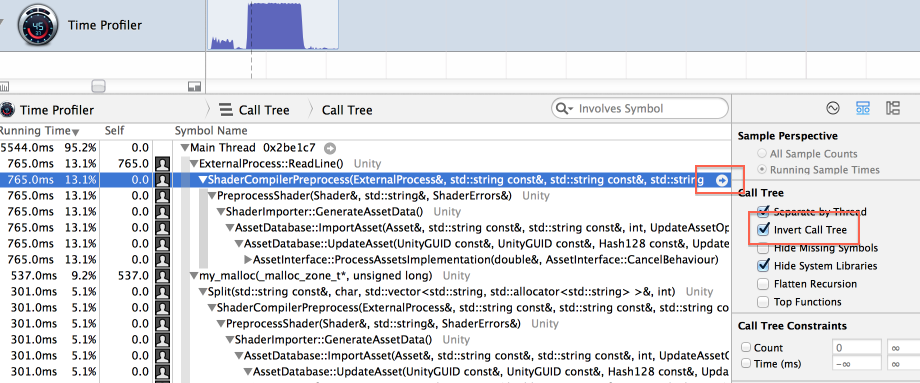
Another very useful feature is inverting the call tree, where the results are presented from the heaviest “self time” functions (we won’t be using that here though).
When hovering over an item, an arrow is shown on the right (see image above). Clicking on that does
“focus on subtree”, i.e. ignores everything outside of that item, and time percentages are shown
relative to the item. Here we’ve focused on ShaderCompilerPreprocess (which does majority of
shader “importing” work).
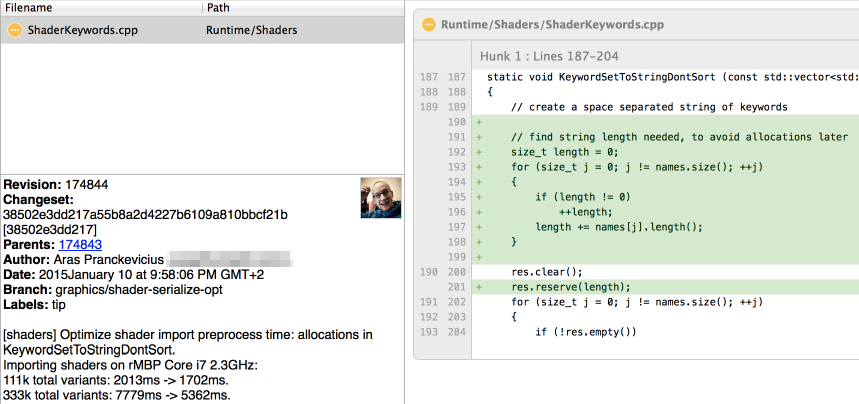
Looks like we’re spending a lot of time appending to strings. That usually means strings did not have enough storage buffer reserved and are causing a lot of memory allocations. Code change:
This small change has cut down shader importing time by 20-40%! Very nice!
I did a couple other small tweaks from looking at this profiling data - none of them resulted in any signifinant benefit though.
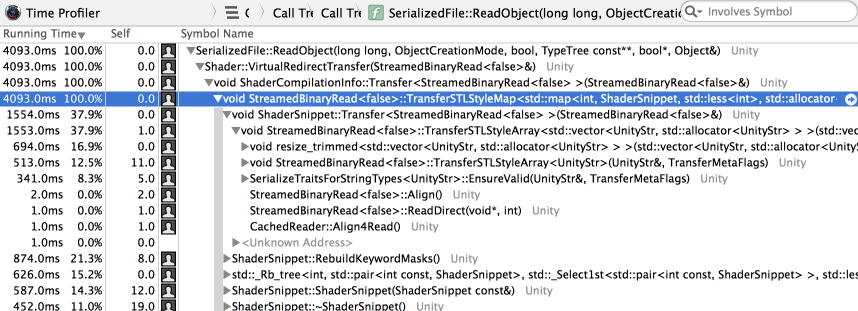
Profiling shader load time also says that most of the time ends up being spent on loading editor related data that is arrays of arrays of strings and so on:
I could have picked functions from the profiler results, went though each of them and optimized, and perhaps would have achieved a solid 2-3x improvement over initial results. Very often that’s enough to be proud!
However…
Taking a step back
Or like Mike Acton would say, “look at your data!” (check his CppCon2014 slides or video). Another saying is also applicable: “think!”
Why do we have this problem to begin with?
For example, in 333k variant shader case, we end up sending 610560 lines of shader variant information between shader compiler process & editor, with macro strings in each of them. In total we’re sending 91 megabytes of data over RPC pipe during shader import.
One possible area for improvement: the data we send over and store in imported shader data is a small set of macro strings repeated over and over and over again. Instead of sending or storing the strings, we could just send the set of strings used by a shader once, assign numbers to them, and then send & store the full set as lists of numbers (or fixed size bitmasks). This should cut down on the amount of string operations we do (massively cut down on number of small allocations), size of data we send, and size of data we store.
Another possible approach: right now we have source data in shader that indicate which variants to generate. This data is very small: just a list of on/off features, and some built-in variant lists (“all variants to handle lighting in forward rendering”). We do the full combinatorial explosion of that in the shader compiler process, send the full set over to the editor, and the editor stores that in imported shader data.
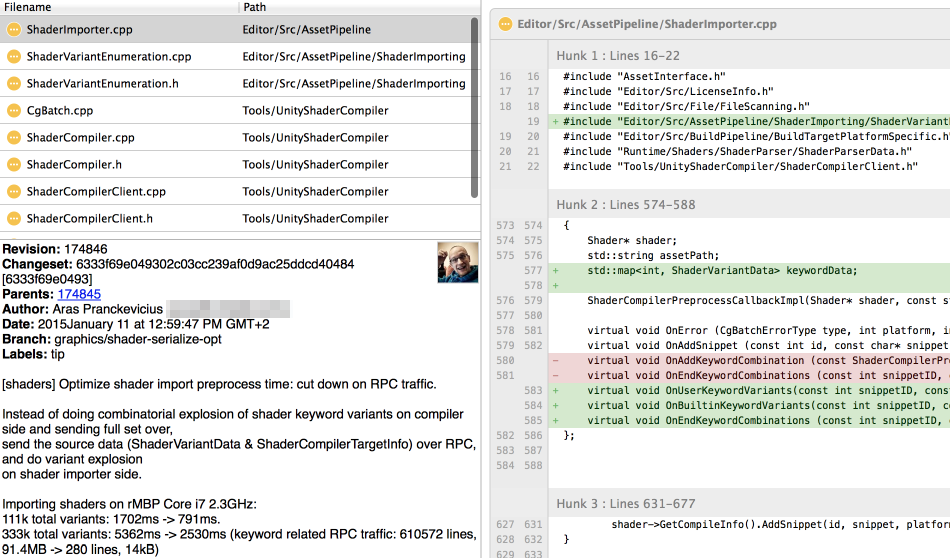
But the way we do the “explosion of source data into full set” is always the same. We could just send the source data from shader compiler to the editor (a very small amount!), and furthermore, just store that in imported shader data. We can rebuild the full set when needed at any time.
Changing the data
So let’s try to do that. First let’s deal with RPC only, without changing serialized shader data. A few commits later…
This made shader importing over twice as fast!
Shader   Import
   27k    419ms ->  200ms
  111k   1702ms ->  791ms
  333k   5362ms -> 2530ms
    1M  16784ms -> 8280ms
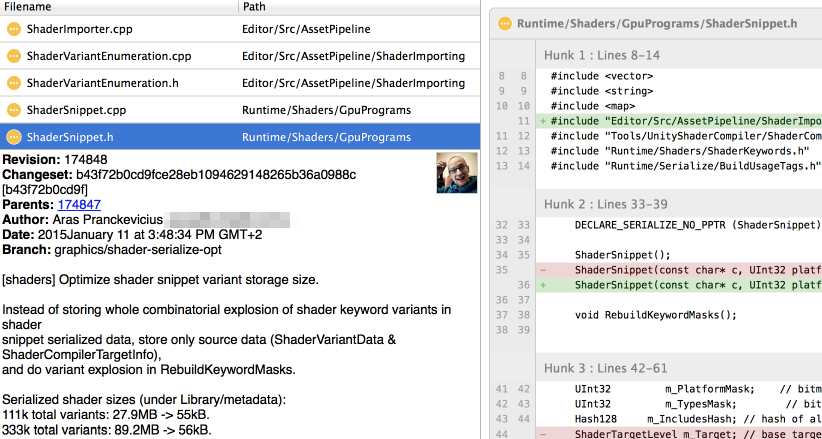
Let’s do the other part too; where we change serialized shader variant data representation. Instead of storing full set of possible variants, we only store data needed to generate the full set:
Shader   Import              Load                 Size
   27k    200ms ->   285ms    103ms ->    396ms     6.4MB -> 55kB
  111k    791ms ->  1229ms    426ms ->   1832ms    27.9MB -> 55kB
  333k   2530ms ->  3893ms   1410ms ->   5892ms    89.2MB -> 56kB
    1M   8280ms -> 12416ms   4498ms ->  18949ms   272.4MB -> 57kB
Everything seems to work, and the serialized file size got massively decreased. But, both importing and loading got slower?! Clearly I did something stupid. Profile!
Right. So after importing or loading the shader (from now a small file on disk), we generate the full set of shader variant data. Which right now is resulting in a lot of string allocations, since it is generating arrays of arrays of strings or somesuch.
But we don’t really need the strings at this point; for example after loading the shader we only need the internal representation of “shader variant key” which is a fairly small bitmask. A couple of tweaks to fix that, and we’re at:
Shader  Import    Load
   27k    42ms     7ms
  111k    47ms    27ms
  333k    94ms    76ms
    1M   231ms   225ms
Look at that! Importing a 333k variant shader got 82 times faster; loading its metadata got 22 times faster, and the imported file size got over a thousand times smaller!
One final look at the profiler, just because:
Weird, time is spent in memory allocation but there shouldn’t be any at this point in that function;
we aren’t creating any new strings there. Ahh, implicit std::string to UnityStr (our own
string class with better memory reporting) conversion operators (long story…). Fix that,
and we’ve got another 2x improvement:
Shader  Import    Load
   27k    42ms     5ms
  111k    44ms    18ms
  333k    53ms    46ms
    1M   130ms   128ms
The code could still be optimized further, but there ain’t no easy fixes left I think. And at this point I’ll have more important tasks to do…
What we’ve got
So in total, here’s what we have so far:
Shader   Import                Load                 Size
   27k    420ms-> 42ms (10x)    120ms->  5ms (24x)    6.4MB->55kB (119x)
  111k   2013ms-> 44ms (46x)    492ms-> 18ms (27x)   27.9MB->55kB (519x)
  333k   7779ms-> 53ms (147x)  1719ms-> 46ms (37x)   89.2MB->56kB (this is getting)
    1M  16192ms->130ms (125x)  4231ms->128ms (33x)  272.4MB->57kB (ridiculous!)
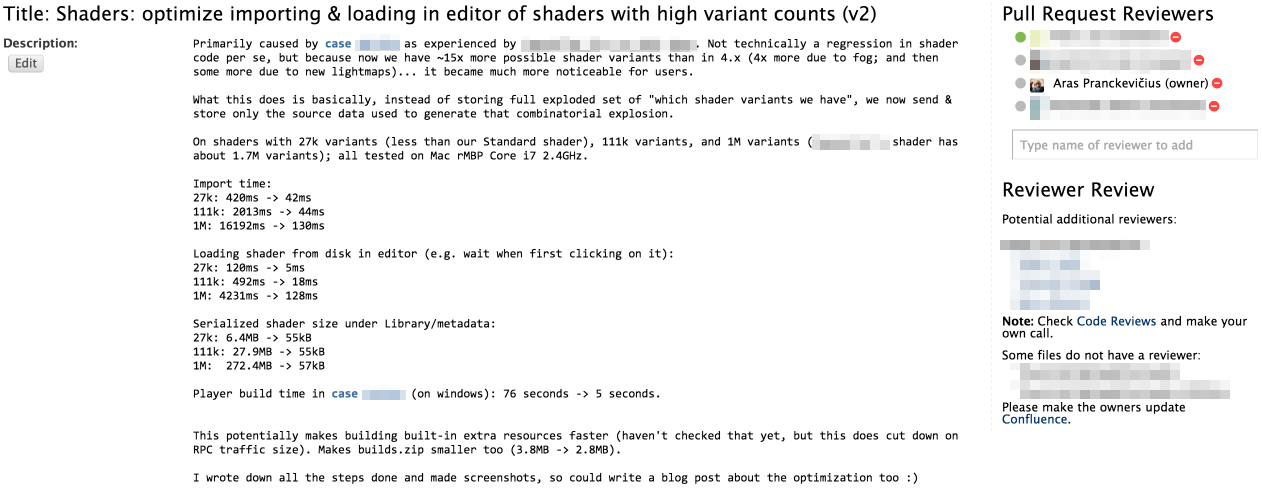
And a fairly small pull request to achieve all this (~400 lines of code changed, ~400 new added):
Overall I’ve probably spent something like 8 hours on this – hard to say exactly since I did some breaks and other things. Also I was writing down notes & making sceenshots for the blog too :) The fix/optimization is already in Unity 5.0 beta 20 by the way.
Conclusion
Apple’s Instruments is a nice profiling tool (and unlike xperf, the UI is not intimidating…).
However, Profiler Is Not A Replacement For Thinking! I could have just looked at the profiling results and tried to optimize “what’s at top of the profiler” one by one, and maybe achieved 2-3x better performance. But by thinking about the actual problem and why it happens, I got a way, way better result.
Happy thinking!
