Optimizing Unity Renderer Part 2: Cleanups
With the story introduction in the last post, let’s get to actual work now!
As already alluded in the previous post, first I try to remember / figure out what the existing code does, do some profiling and write down things that stand out.
Profiling on several projects mostly reveals two things:
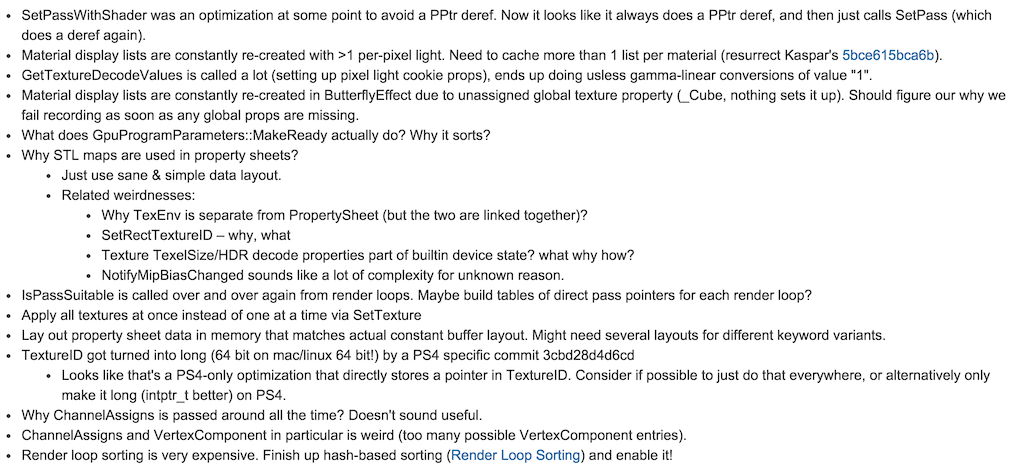
- Rendering code could really use wider multithreading than “main thread and render thread” that we have now. Here’s one capture from Unity 5 timeline profiler:
In this particular case, CPU bottleneck is the rendering thread, where majority of the time it just spends in glDrawElements (this was on a MacBookPro; GPU-simplified scene from Butterfly Effect demo doing about 6000 draw calls). Main thead just ends up waiting for the render thread to catch up. Depending on the hardware, platform, graphics API etc. the bottleneck can be elsewhere, for example the same project on a much faster PC under DX11 is spending about the same time in main vs. rendering thread.
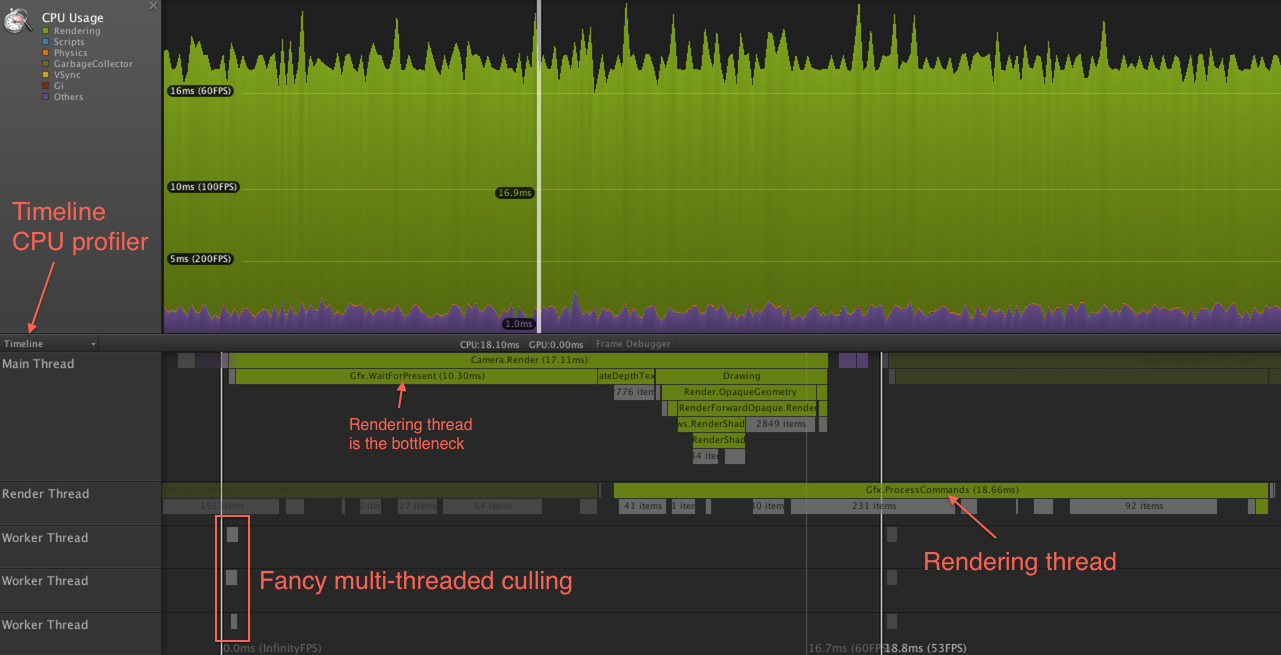
The culling sliver on the left side looks pretty good, eventually we want all our rendering code to look like that too. Here’s the culling part zoomed in:
- There are no “optimize this one function, make everything twice as fast” places :( It’s going to be a long journey of rearranging data, removing redundant decisions, removing small things here and there until we can reach something like “2x faster per thread”. If ever.
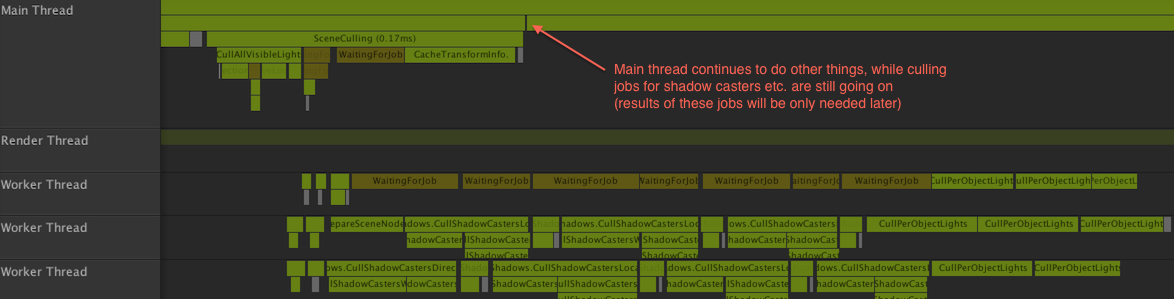
The rendering thread profiling data is not terribly interesting here. Majority of the time (everything highlighted below) is from OpenGL runtime/driver. Adding a note that perhaps we do something stupid that is causing the driver to do too much work (I dunno, switching between different vertex layouts for no good reason etc.), but otherwise not much to see on our side. Most of the remaining time is spent in dynamic batching.
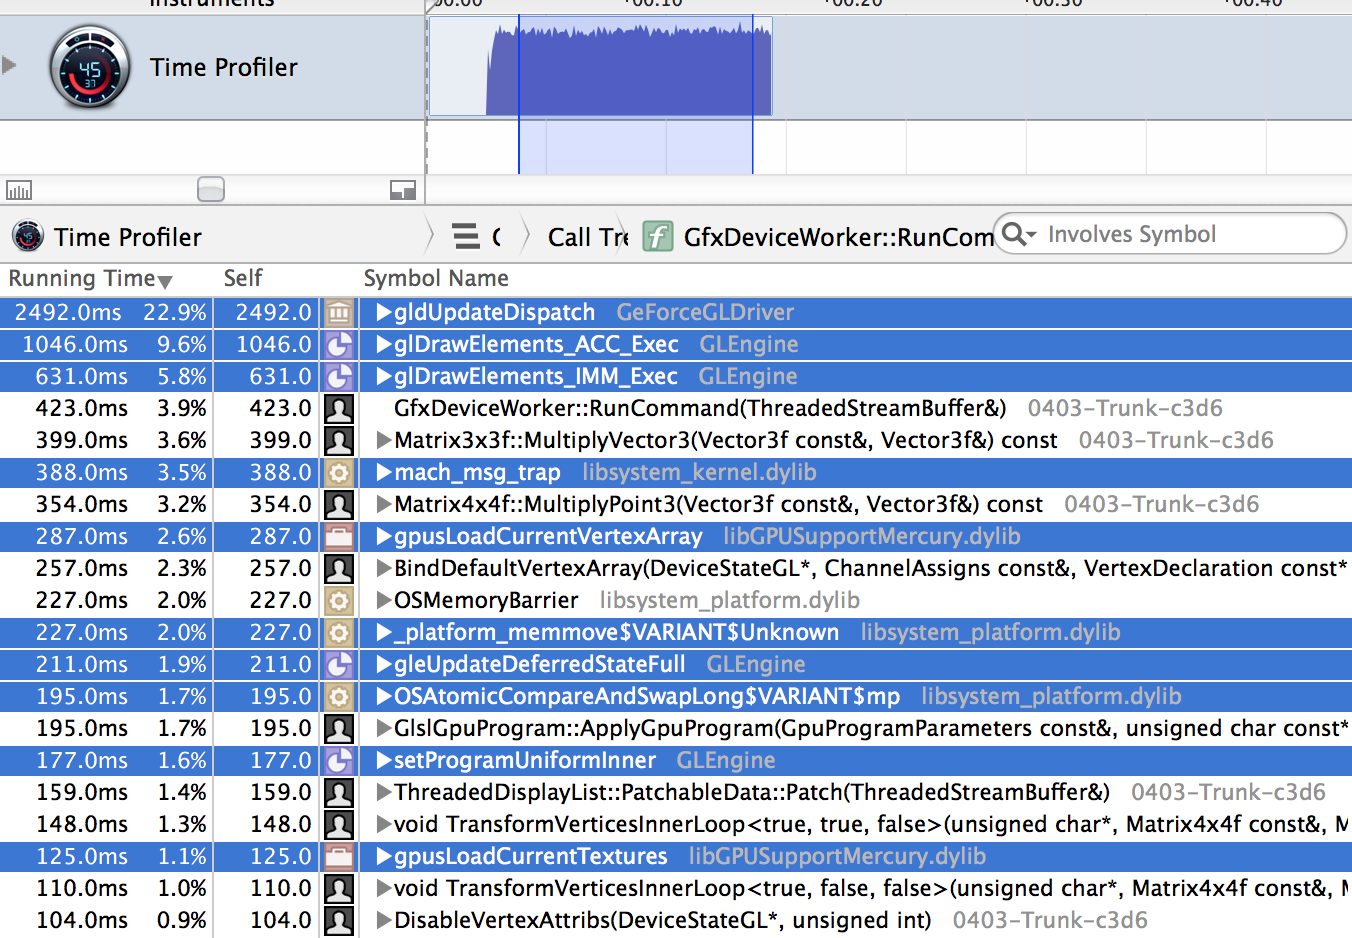
Looking into the functions heavy on the main thread, we get this:
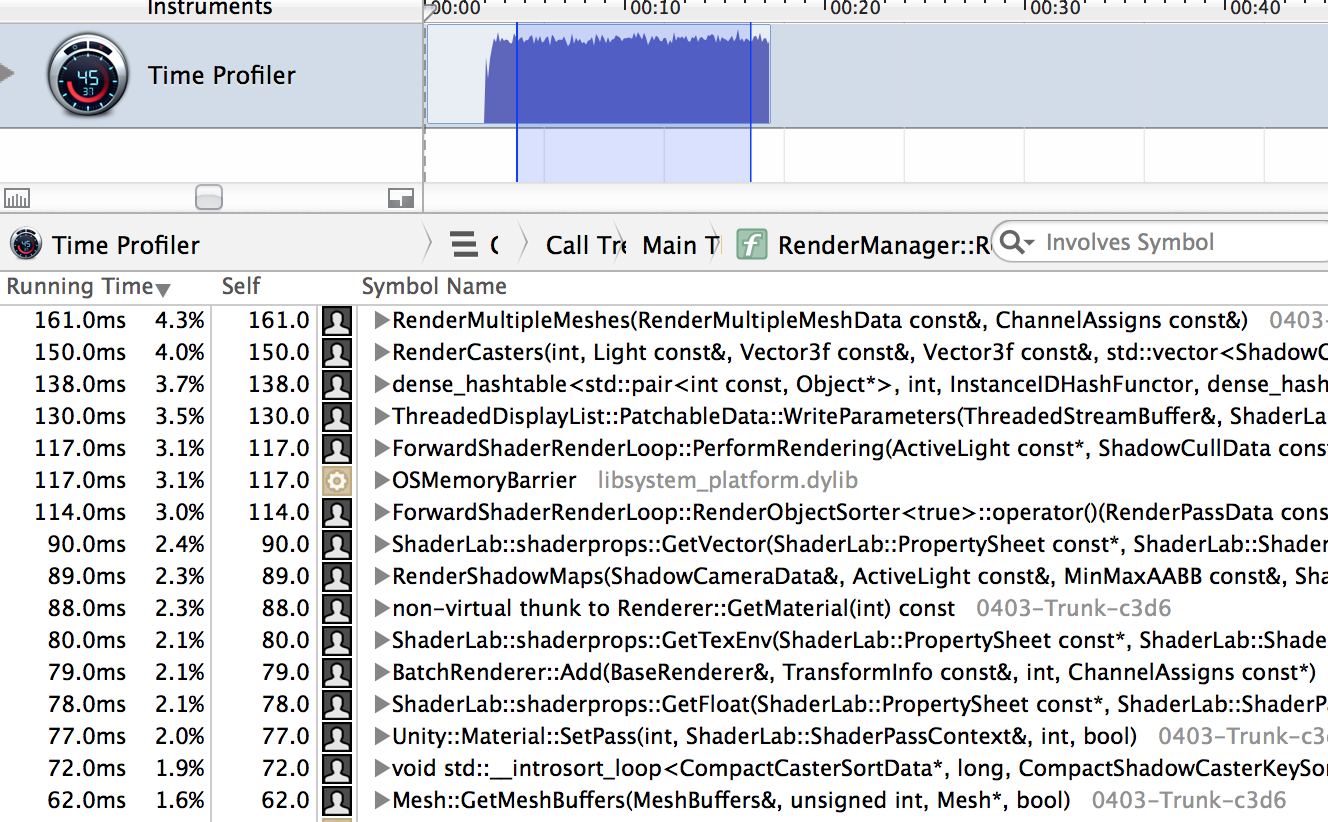
Now there are certainly questions raised (why so many hashtable lookups? why sorting takes so long? etc., see list above), but the point is, there’s no single place where optimizing something would give magic performance gains and a pony.
Observation 1: material “display lists” are being re-created often
In our code, a Material can pre-record what we call a “display list” for the rendering thread. Think of it as a small command buffer, where a bunch of commands (“set this raster state object, set this shader, set these textures”) are stored. Most important thing about them: they are stored with all the parameters (final texture values, shader uniform values etc.) resolved. When “applying” a display list, we just hand it off to the rendering thread, no need to chase down material property values or other things.
That’s all well and good, except when something changes in the material that makes the recorded display list invalid. In Unity, each shader internally often is many shader variants, and when switching to a different shader variant, we need to apply a different display list. If the scene was setup in such a way that caused the same Materials to alternate between different lists, then we have a problem.
Which was exactly what was happening in several of the benchmark projects I had; short story being “multiple per-pixel lights in forward rendering cause this”. Turns out we had code to fix this on some branch, it just needed to be finished up – so I found it, made to compile in the current codebase and it pretty much worked. Now the materials can pre-record more than one “display list” in them, and that problem goes away.
On a PC (Core i7 5820K), one scene went from 9.52ms to 7.25ms on the main thread which is fairly awesome.
Spoilers ahead: this change is the one that brought the largest benefit on the affected scenes, from everything I did over almost two weeks. And it wasn’t even the code that “I wrote”; I just fished it out from a somewhat neglected branch. So, yay! An easy change for a 30% performance gain! And bummer, I will not get this kind of change from anything written below.
Observation 2: too many hashtable lookups
Next from the observations list above, looked into “why so many hashtable lookups” question (if there isn’t a song about it yet, there should be!).
In the rendering code, many years ago I added something like Material::SetPassWithShader(Shader* shader, ...) since the calling code
already knows with which shader material state should be setup with. Material also knows it’s shader, but it stores something we
call a PPtr (“persistent pointer”) which is essentially a handle. Passing the pointer directly avoids doing a handle->pointer lookup
(which currently is a hashtable lookup since for various complicated reasons it’s hard to do an array-based handle system, I’m told).
Turns out, over many changes, somehow Material::SetPassWithShader ended up doing two handle->pointer lookups, even if it
already got the actual shader pointer as a parameter! Fixed:
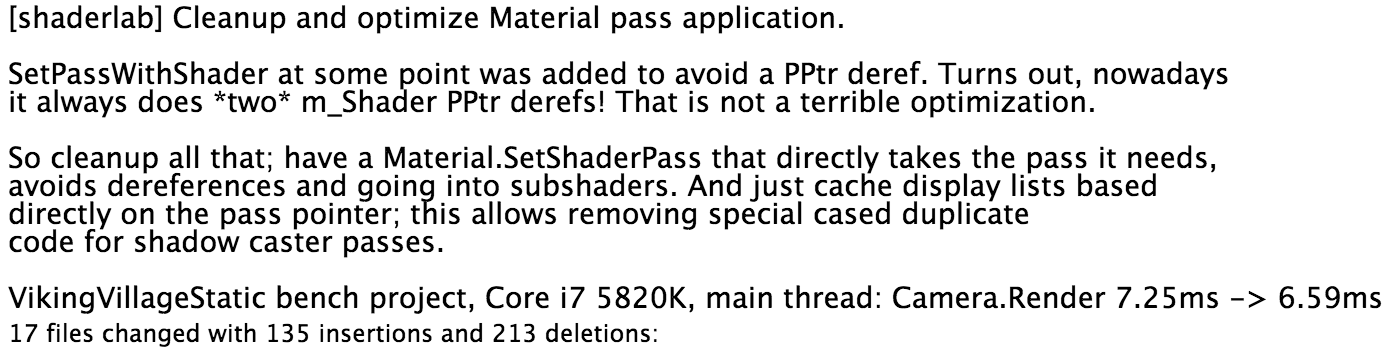
Ok so this one turned out to be good, measurable and very easy performance optimization. Also made the codebase smaller, which is a very good thing.
Small tweaks here and there
From the render thread profiling on a Mac above, our own code in BindDefaultVertexArray was taking 2.3% which sounded excessive.
Turns out, it was looping over all possible vertex component types and checking some stuff; made the code loop only over
the vertex components used by the shader. Got slightly faster.
One project was calling GetTextureDecodeValues a lot, which compute some color space, HDR and lightmap decompression constants
for a texture. It was doing a bunch of complicated sRGB math on an optional “intensity multiplier” parameter which was set to
exactly 1.0 in all calling places except one. Recognizing that in the code made a bunch of pow() calls go away. Added to a
“look later” list: why we call that function very often in the first place?
Some code in rendering loops that was figuring out where draw call batch boundaries need to be put (i.e. where to switch to a new shader etc.), was comparing some state represented as separate bools. Packed a bunch of them into bitfields and did comparisons on one integer. No observable performance gains, but the code actually ended up being smaller, so a win :)
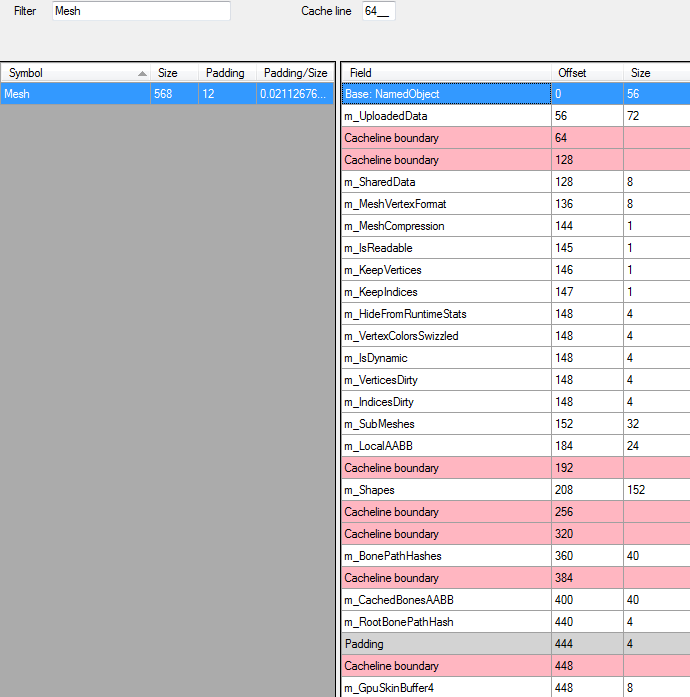 Noticed that figuring out which vertex buffers and vertex layouts are used by objects queries Mesh data that’s quite far
apart in memory. Reordered data based on usage type (rendering data, collision data, animation data etc.).
Noticed that figuring out which vertex buffers and vertex layouts are used by objects queries Mesh data that’s quite far
apart in memory. Reordered data based on usage type (rendering data, collision data, animation data etc.).
Also reduced data packing holes using @msinilo’s excellent CruncherSharp (and did some tweaks to it along the way :)) I hear there’s a similar tool for Linux (pahole). On a Mac there’s struct_layout but it was taking forever on Unity’s executable and the Python script often would fail with some recursion overflow exception.
While browsing through the code, noticed that the way we track per-texture mipmap bias is very convoluted, to put it mildly. It is set per-texture, then the texture tracks all the material property sheets where it’s being used; notifies them upon any mip bias change, and the bias is fetched from property sheets and applied together with the texture each and every time a texture is set on a graphics device. Geez. Fixed. Since this changed interface of our graphics API abstraction, this means changing all 11 rendering backends; just a few fairly trivial changes in each but can feel intimidating (I can’t even build half of them locally). No fear, we have the build farm to check for compile errors, and the test suites to check for regressions!
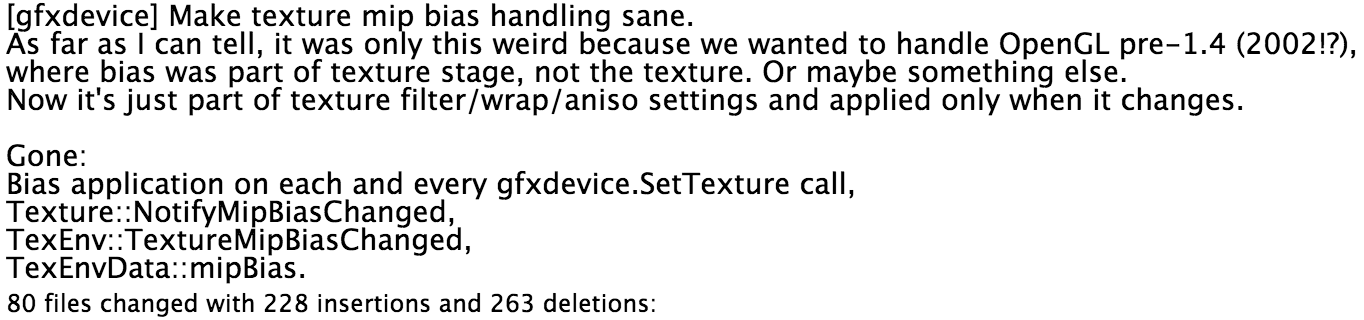
No significant performance difference, but it feels good to get rid of all that complexity. Adding to a “look later” list: there’s one more piece of similar data that we track per-texture; something about UV scaling for non-power-of-two textures. I suspect it’s there for no good reason these days, gotta look and remove it if possible.
And some other similar localized tweaks, each of them is easy and makes some particular place a tiny bit better, but does not result in any observable performance improvement. Maybe doing a hundred of them would result in some noticable effect, but it’s much more possible that we’ll need some more serious re-working of things to get good results.
Data layout of Material property sheets
One thing that has been bothering me is how we store material properties. Each time I’d show the codebase to a new engineer, in that place I’d roll my eyes and say “and yeah, here we store the textures, matrices, colors etc. of the material, in separate STL maps. The horror. The horror.”.
There’s this popular thought that C++ STL containers have no place in high performance code, and no good game has ever shipped with them (not true), and if you use them you must be stupid and deserve to be ridiculed (I don’t know… maybe?). So hey, how about I go and replace these maps with a better data layout? Must make everything a million times better, right?
In Unity, parameters to shaders can come from two places: either from per-material data, or from “global” shader parameters. Former is typically for things like “diffuse texture”, while the latter is for things like “fog color” or “camera projection” (there’s slight complication with per-instance parameters in form of MaterialPropertyBlock etc., but let’s ignore that for now).
The data layout we had before was roughly this (PropertyName is basically an integer):
map<PropertyName, float> m_Floats;
map<PropertyName, Vector4f> m_Vectors;
map<PropertyName, Matrix4x4f> m_Matrices;
map<PropertyName, TextureProperty> m_Textures;
map<PropertyName, ComputeBufferID> m_ComputeBuffers;
set<PropertyName> m_IsGammaSpaceTag; // which properties come as sRGB values
What I replaced it with (simplified, only showing data members; dynamic_array is very much like std::vector, but more EASTL style):
struct NameAndType { PropertyName name; PropertyType type; };

// Data layout:
// - Array of name+type information for lookups (m_Names). Do
//   not put anything else; only have info needed for lookups!
// - Location of property data in the value buffer (m_Offsets).
//   Uses 4 byte entries for smaller data; don't use size_t!
// - Byte buffer with actual property values (m_ValueBuffer).
// - Additional data per-property in m_GammaProps and
//   m_TextureAuxProps bit sets.
//
// All the arrays need to be kept in sync (sizes the same; all
// indexed by the same property index).
dynamic_array<NameAndType> m_Names;
dynamic_array<int> m_Offsets;
dynamic_array<UInt8> m_ValueBuffer;

// A bit set for each property that should do gamma->linear
// conversion when in linear color space
dynamic_bitset m_GammaProps;
// A bit set for each property that is aux for a texture
// (e.g. *_ST for texture scale/tiling)
dynamic_bitset m_TextureAuxProps;
When a new property is added to the property sheet, it is just appended to all the arrays. Property name/type information and property location in the data buffer are kept separate so that when searching for properties, we don’t even fetch the data that’s not needed for the search itself.
Biggest external change is that before, one could find a property value and store a direct pointer to it (was used in the pre-recorded material display lists, to be able to “patch in” values of global shader properties before replaying them). Now the pointers are invalidated whenever resizing the arrays; so all the code that was possibly storing pointers has to be changed to store offsets into the property sheet data instead. So in the end this was quite some code changes.
Finding properties has changed from being an O(logN) operation (map lookup) into an O(N) operation (linear scan though the names array). This sounds bad if you’re learning computer science as it is typically taught. However, I looked at various projects and found that typically the property sheets contain between 5 and 30 properties in total (most often around 10); and a linear scan with all the search data right next to each other in memory is not that bad compared to STL map lookup where the map nodes can be placed arbitrarily far away from one another (if that happens, each node visit can be a CPU cache miss). From profiling on several different projects, the part that does “search for properties” was consistently slightly faster on a PC, a laptop and an iPhone.
Did this change brought magic performance improvements though? Nope. It brought a small improvement in average frame time and slightly smaller memory consumption, especially when there are lots of different materials. But does “just replace STL maps with packed arrays” result in magic? Alas, no. Well, at least I don’t have to be roll my eyes anymore when showing this code to people, so there’s that.
Upon my code review, one comment that popped up is that I should try splitting up property data so that properties of the same type are grouped together. A property sheet could know which start and end index is for a particular type, and then searching for a particular property would only need to scan the names array of that type (and the array would only contain an integer name per property, instead of name+type). Adding a new property into the sheet would become more expensive, but looking them up cheaper.
A side note from all this: modern CPUs are impressively fast at what you could call “bad code”, and have mightily large caches too. I wasn’t paying much attention to mobile CPU hardware, and just realized that iPhone 6 CPU has a 4 megabyte L3 cache. Four. Megabytes. On a phone. That’s about how much RAM my first PC had!
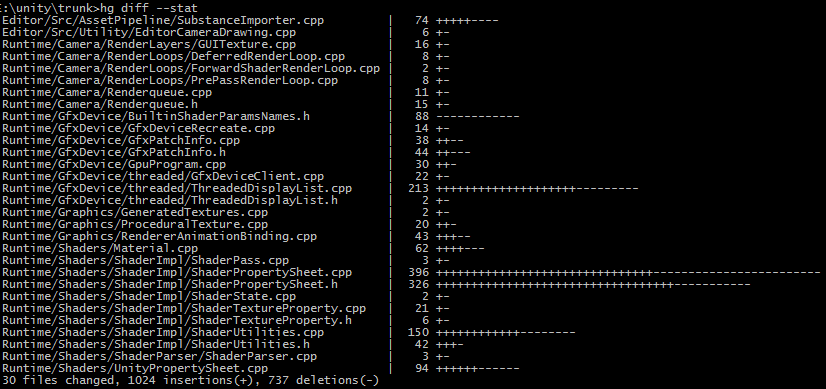
Results so far
So that was about 2 weeks of work (I’d estimate at 75% time - the rest spent on unrelated bugfixes, code reviews, etc.); with a state where all the platforms are building and tests are passing; and a pull request ready. 40 commits, 135 files, about 2000 lines of code changed.
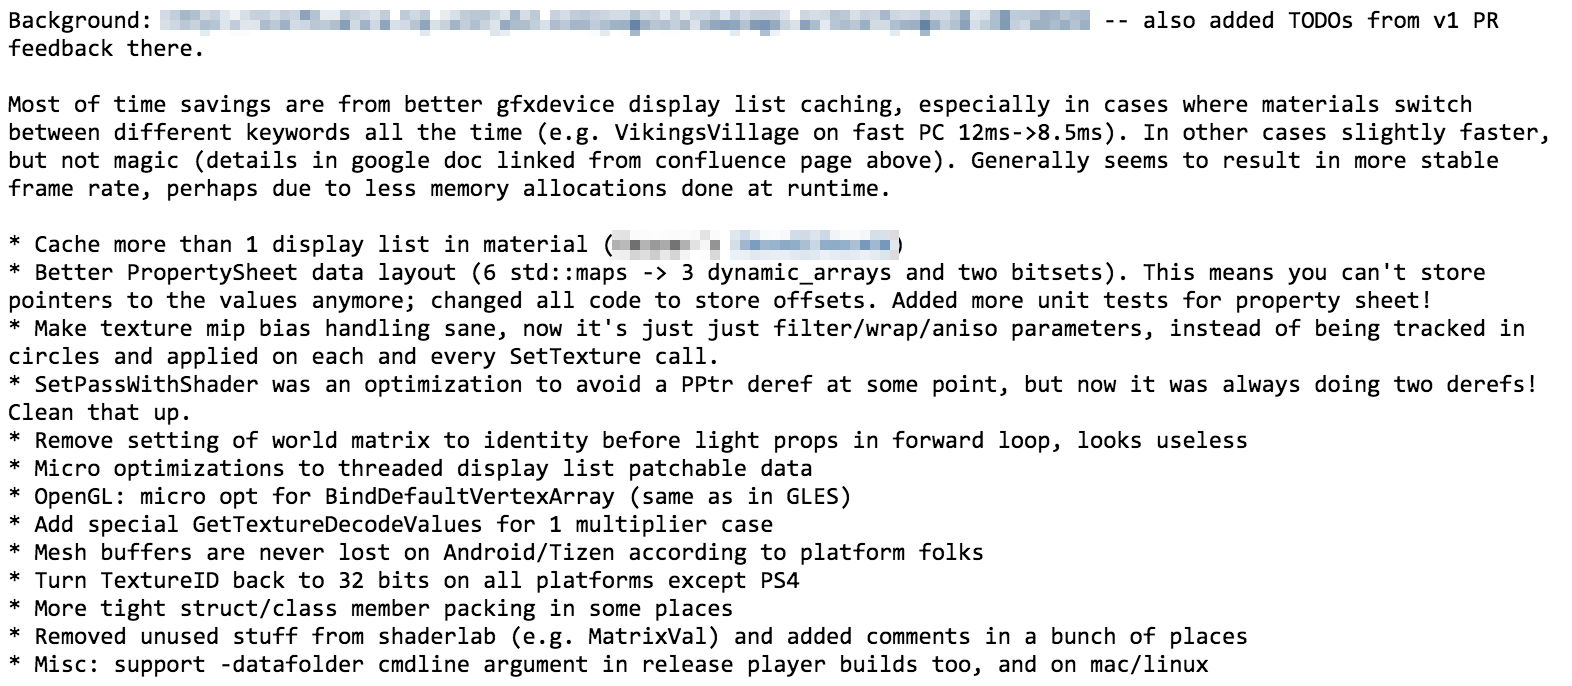
Performance wise, one benchmark project improved a lot (the one most affected by “display lists being re-created” issue), with total frame time 11.8ms -> 8.50ms on PC; and 29.2ms -> 26.9ms on a laptop. Other projects improved, but nowhere near as much (numbers like 7.8ms -> 7.3ms on PC; another project 15.2ms -> 14.1ms on iPhone etc.).
Most of the performance improvements came from two places really (display list re-creation; and avoiding useless hashtable lookups). Not sure how to feel about the rest of the changes - it feels like they are good changes overall, if only because I now have a better understanding of the codebase, and have added quite many comments explaining what & why. I also now have an even longer list of “here are the places that are weird or should be improved”.
Is spending almost two weeks worth the results I got so far? Hard to say. Sometimes I do have a week where it feels like I did nothing at all, so it’s better than that :)
Overall I’m still not sure if “optimizing stuff” is my strong area. I think I’m pretty good at only a few things: 1) debugging hard problems – I can come up with plausible hypotheses and ways to divide-and-conquer the problem fast; 2) understanding implications of some change or a system – what other systems will be affected and what could/would be problematic interactions; and 3) having good ambient awareness of things done by others in the codebase – I can often figure out when several people are working on somewhat overlapping stuff and tell them “yo, you two should coordinate”.
Is any of that a useful skill for optimization? I don’t know. I certainly can’t juggle instruction latencies and execution ports and TLB misses in my head. But maybe I’ll get better at it if I practice? Who knows.
Not quite sure which path to go next at the moment; I see at least several possible ways:
- Continue doing incremental improvements, and hope that net effect of a lot of them will be good. Individually each of them is a bit disappointing since the improvement is hard to measure.
- Start looking at the bigger picture and figure out how we can avoid a lot of currently done work completely, i.e. more serious “reshaping” of how things are structured.
- Once some more cleanup is done, switch to helping others with “multithread more stuff” approaches.
- Optimization is hard! Let’s play more Rocksmith until situation improves.
I guess I’ll discuss with others and do one or more of the above. Until next time!
Update: Part 3: Fixed Function Removal is up.