A bit over two months ago I started to contribute a bit of code to Blender’s Video Sequence Editor (VSE).
Did you know that Blender has a suite of video editing tools? Yeah, me neither :) Even the
feature page for it on the website looks… a bit empty lol.
Do I know anything at all about video editing, timelines, sequencers, color grading, ffmpeg, audio mixing and so on?
Of course not! So naturally, that means I should start to tinker with it.
Wait what?
How does one accidentally start working on VSE?
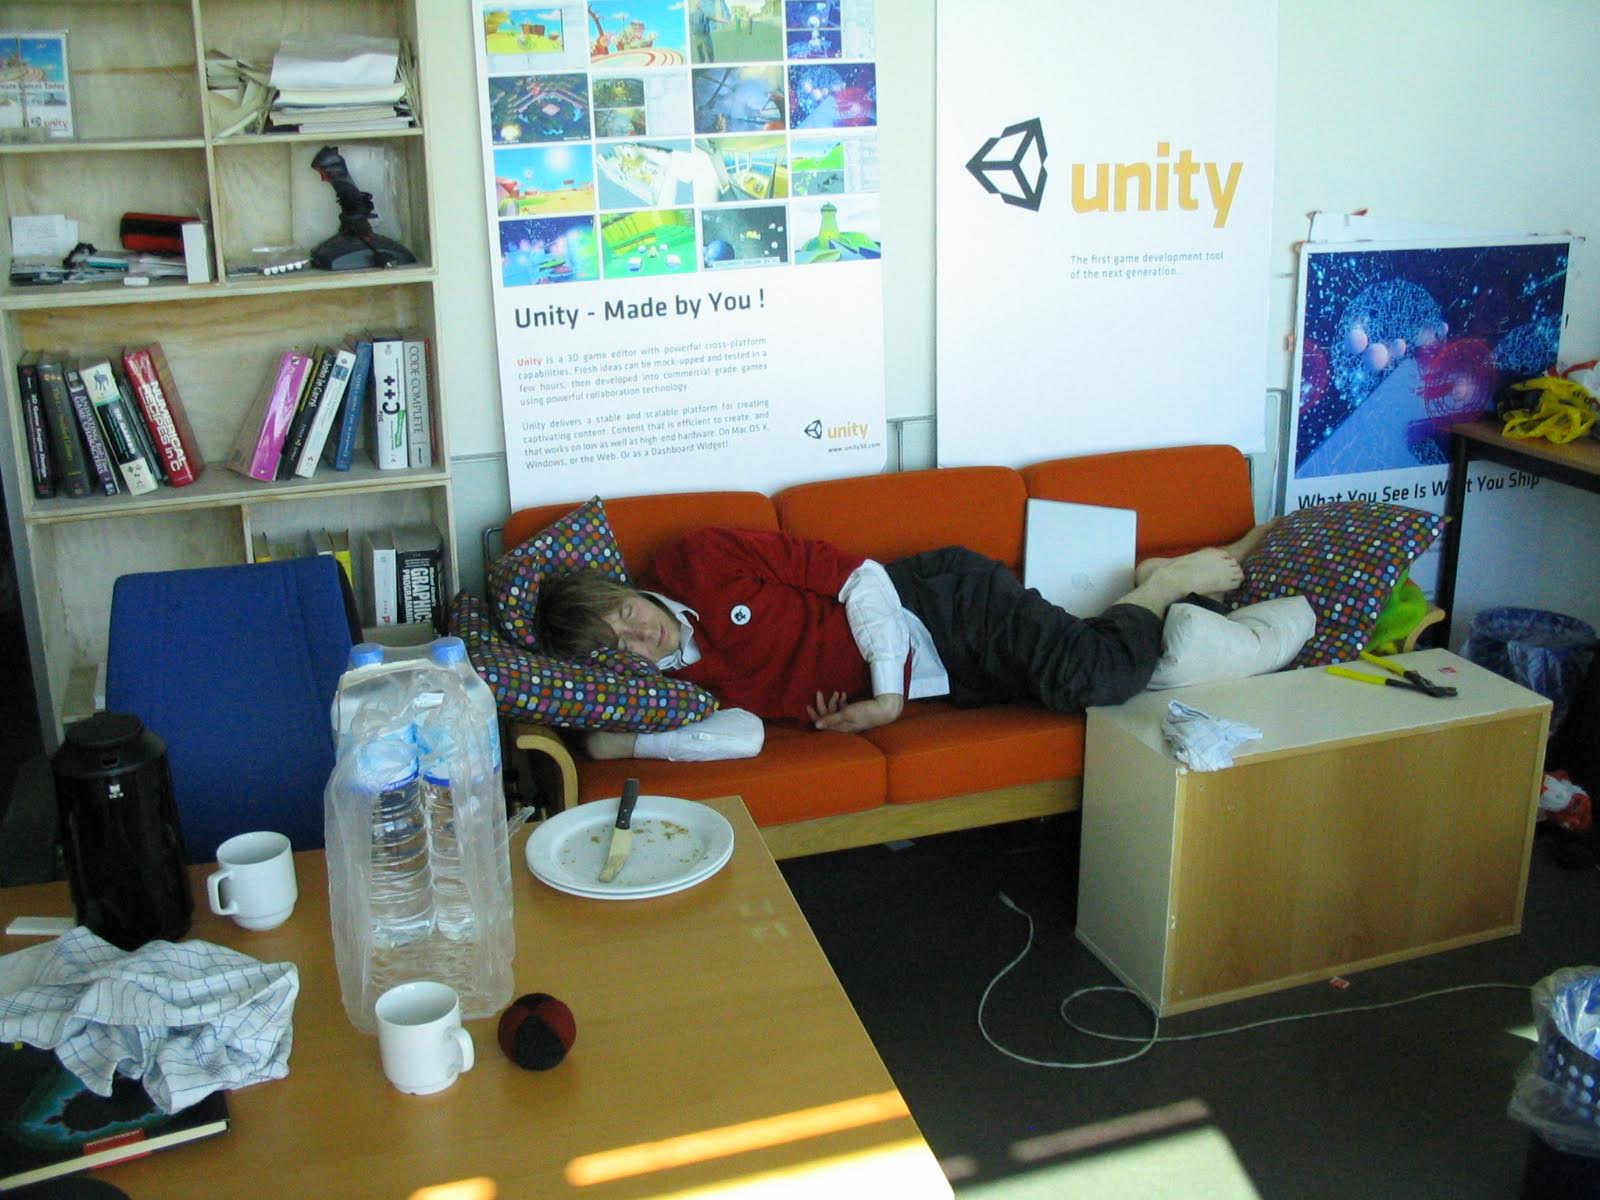
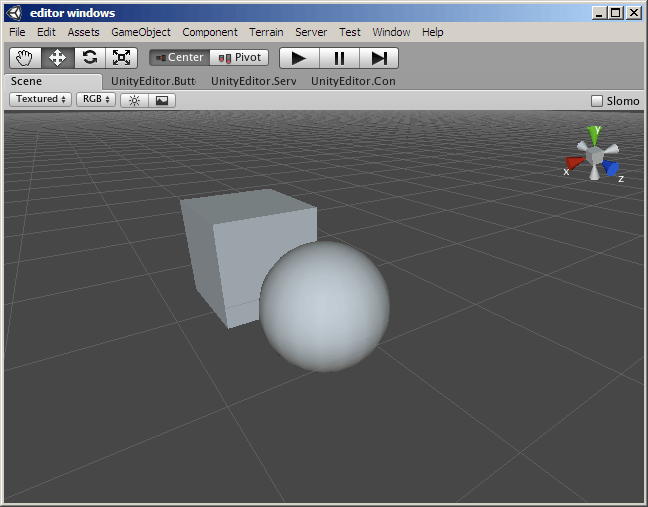
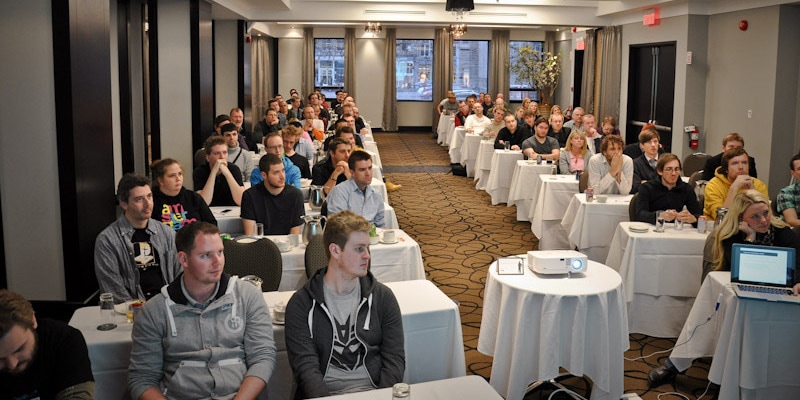
You do that because you decide to check out Unity’s
Unite 2023 conference
in Amsterdam, and to visit some friends. For a spare half-a-day after the conference, you decide to
check out Blender HQ. There, Francesco and Sergey, for some reason,
ask you whether you’d like to contribute to VSE, and against your better judgement, you say “maybe?”.
So that’s how. And then it feels pretty much like this:
I started to tinker with it, mostly trying to do random “easy” things. By easy,
I mean performance optimizations. Since, unless the code complexicates a lot, they are hard
to argue against. “Here, this thing is 2x faster now”, in most places everyone will react with “oh nice!”. Hopefully.
So, two months of kinda-partime tinkering in this area that I did not even know existed before, and Blender VSE
got a small set of improvements for upcoming Blender 4.1 (which just became beta and can be downloaded from usual
daily builds). Here they are:
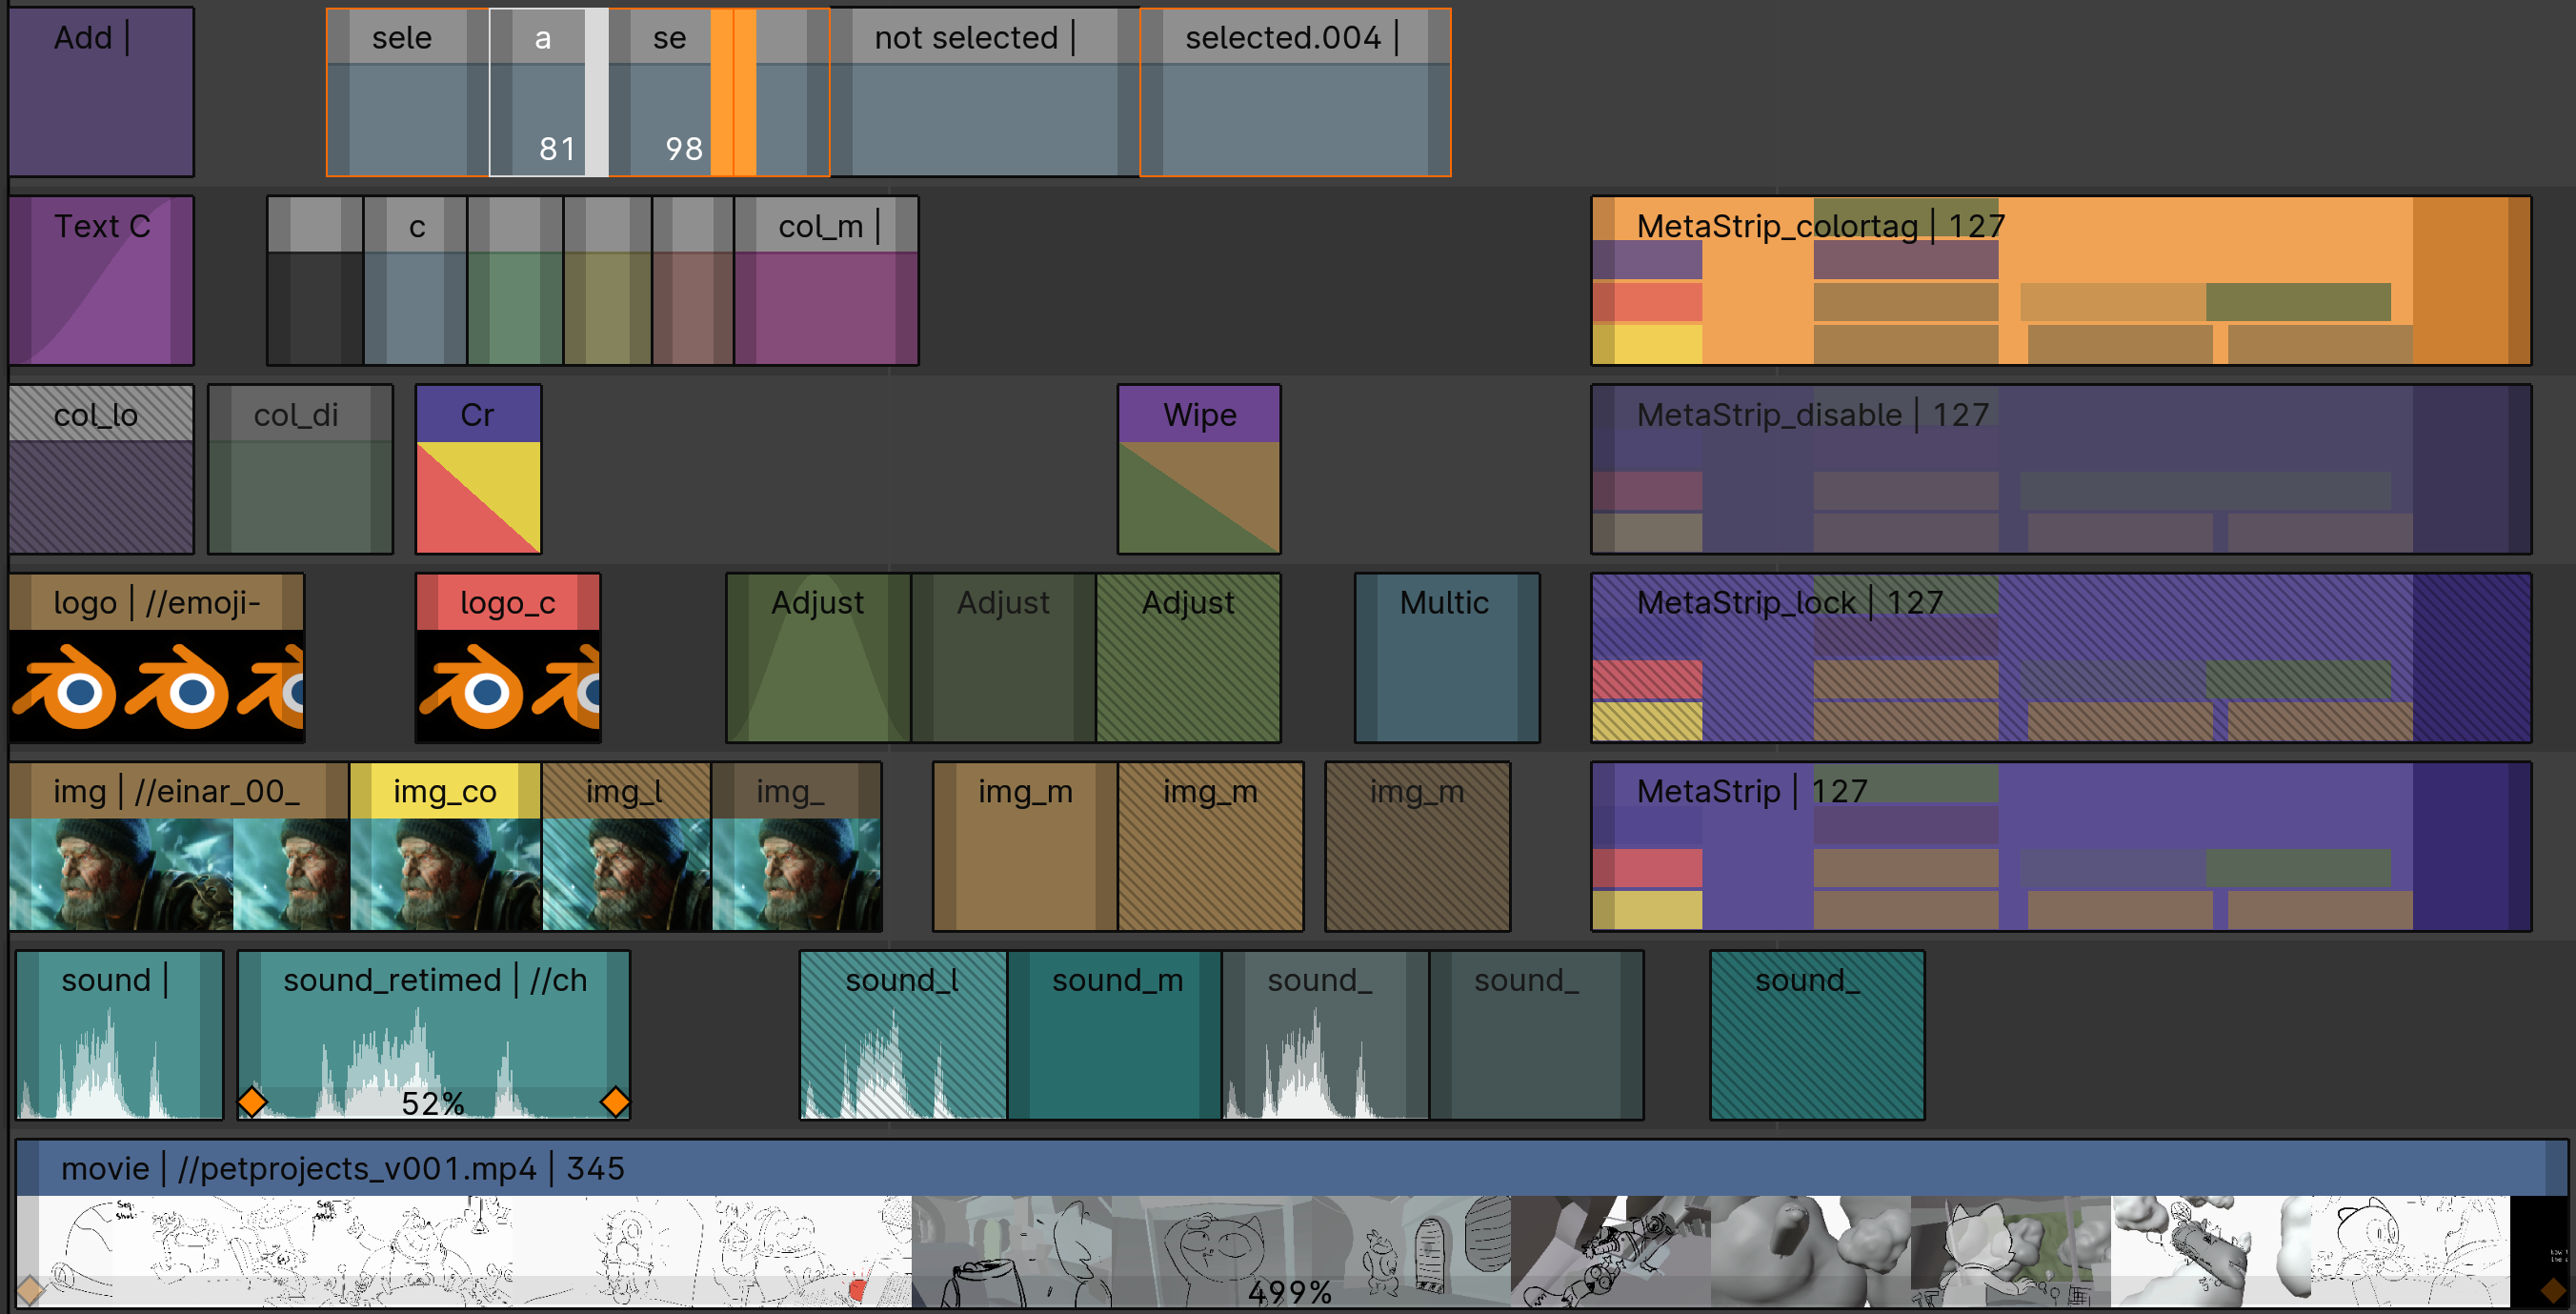
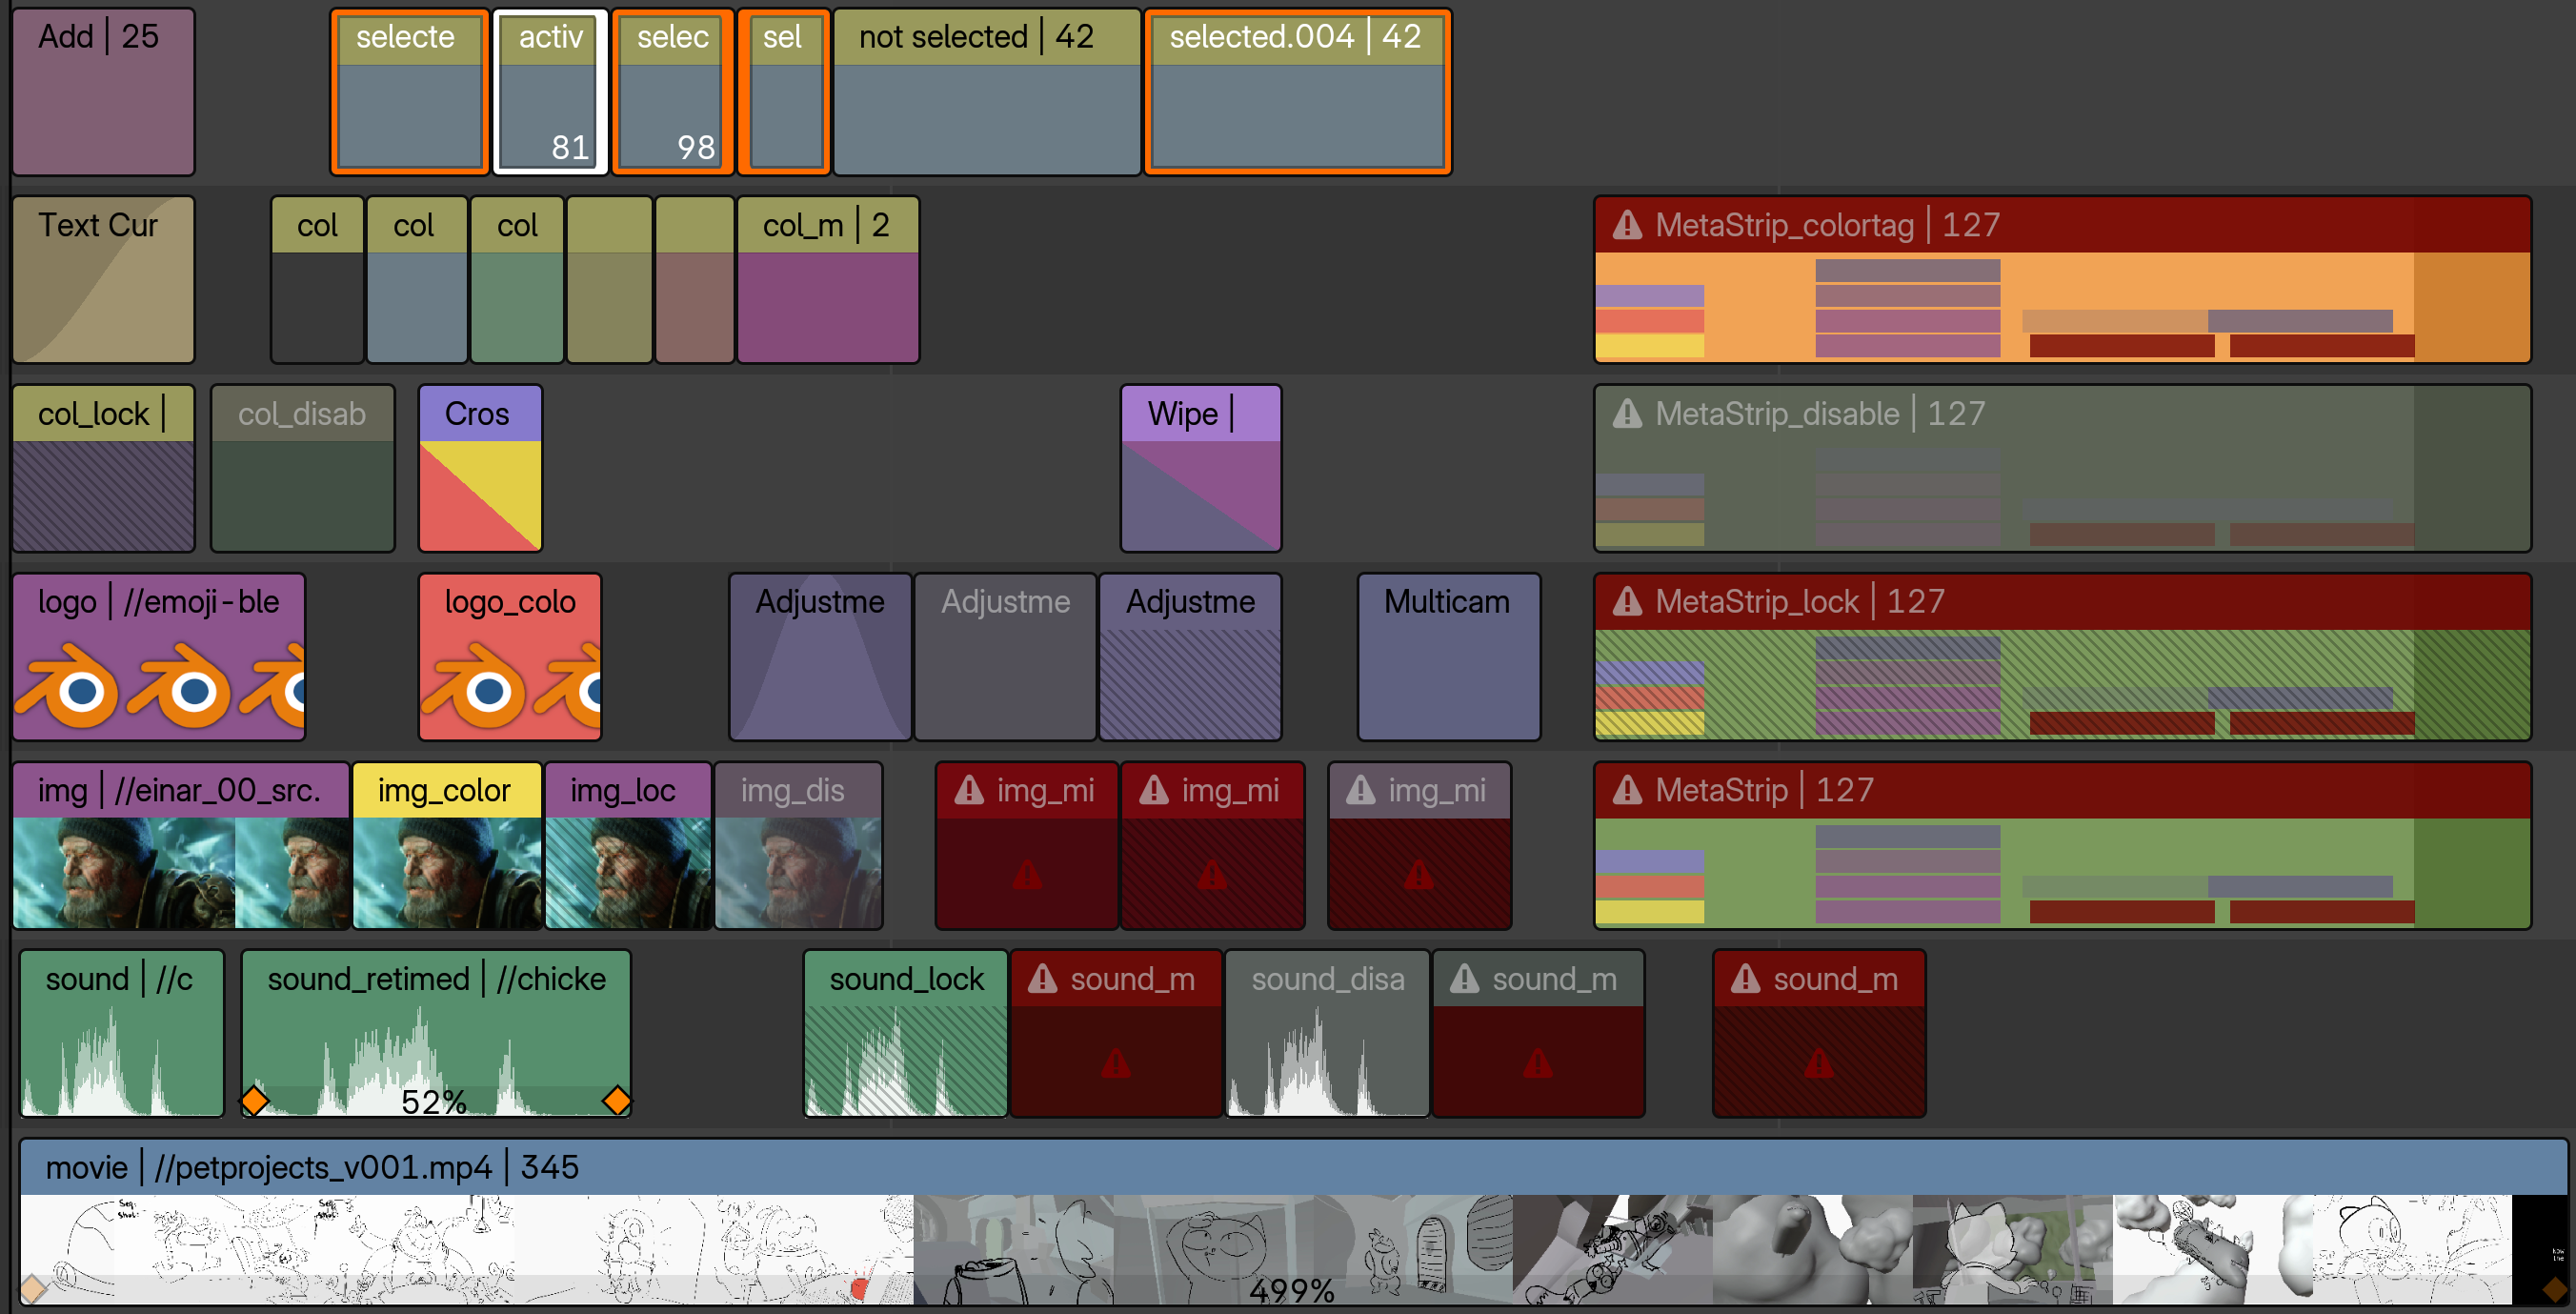
Snappier Timeline drawing
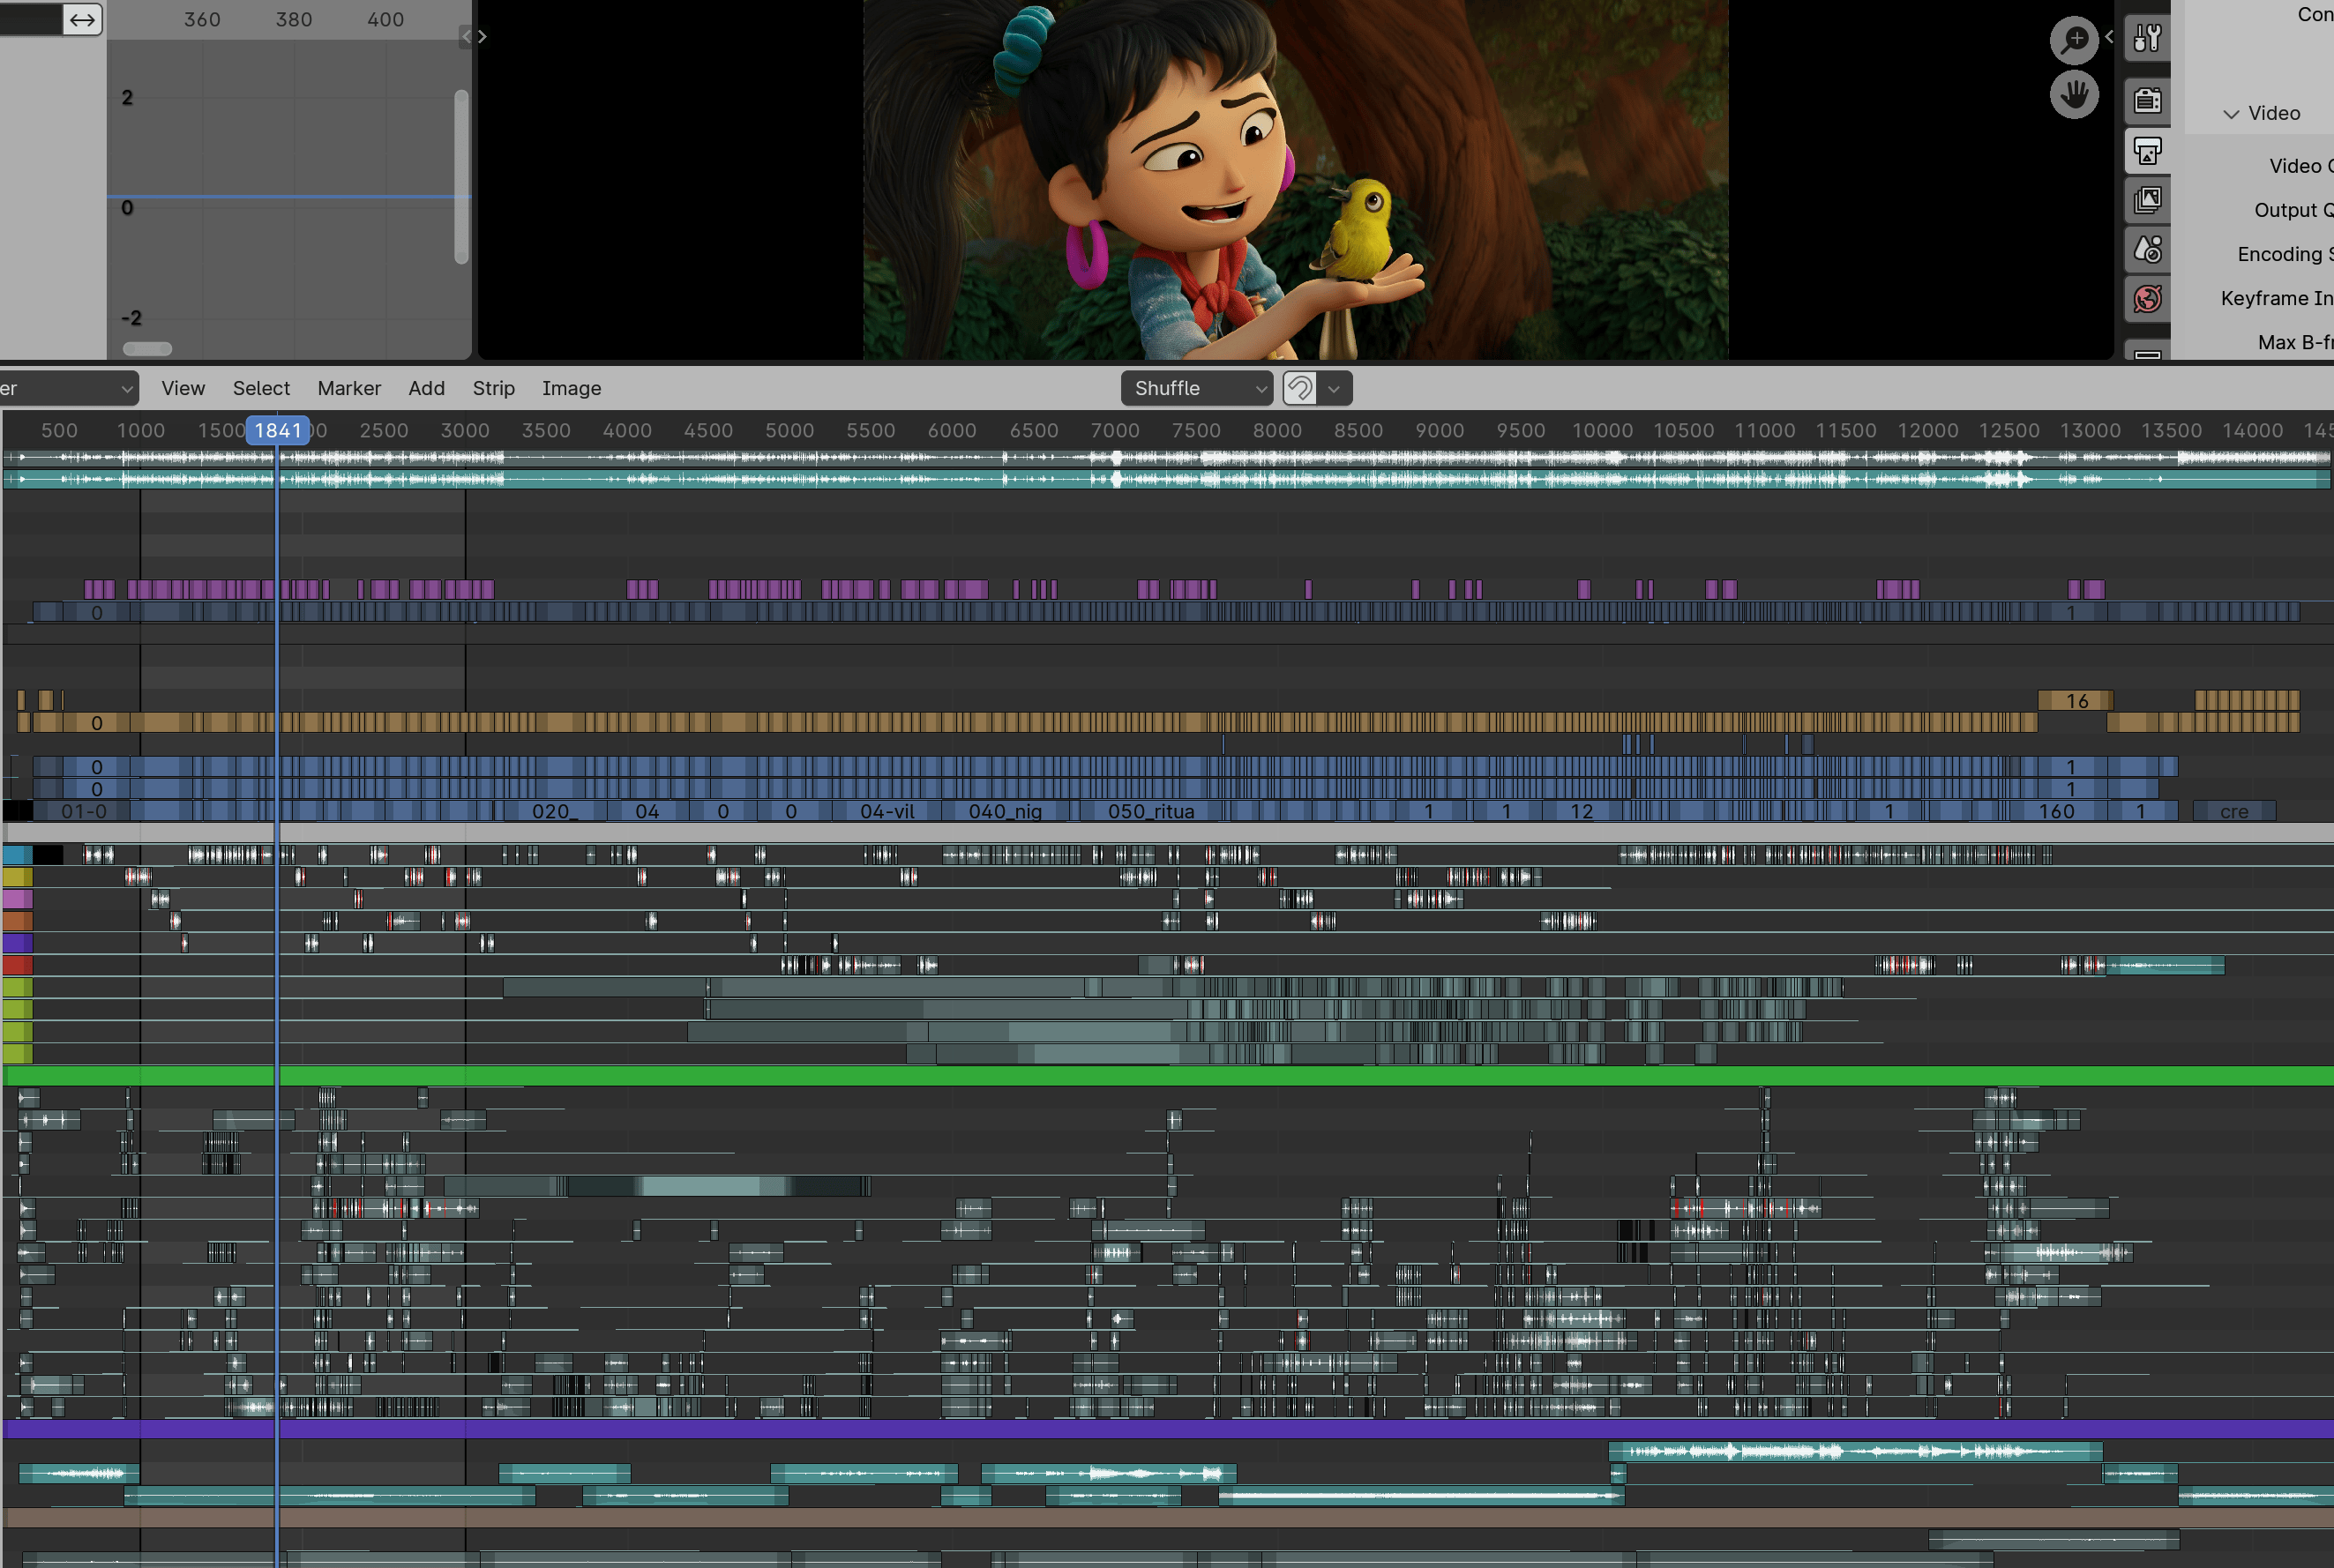
VSE timeline is the bottom part of the image above. Here it is zoomed out into the complete
Sprite Fright edit project, with about 3000 “strips” visible at once.
Just scrolling and panning around in that timeline was updating the user interface at ~15 frames per second.
Now that’s 60+ frames per second (#115311). Turns out,
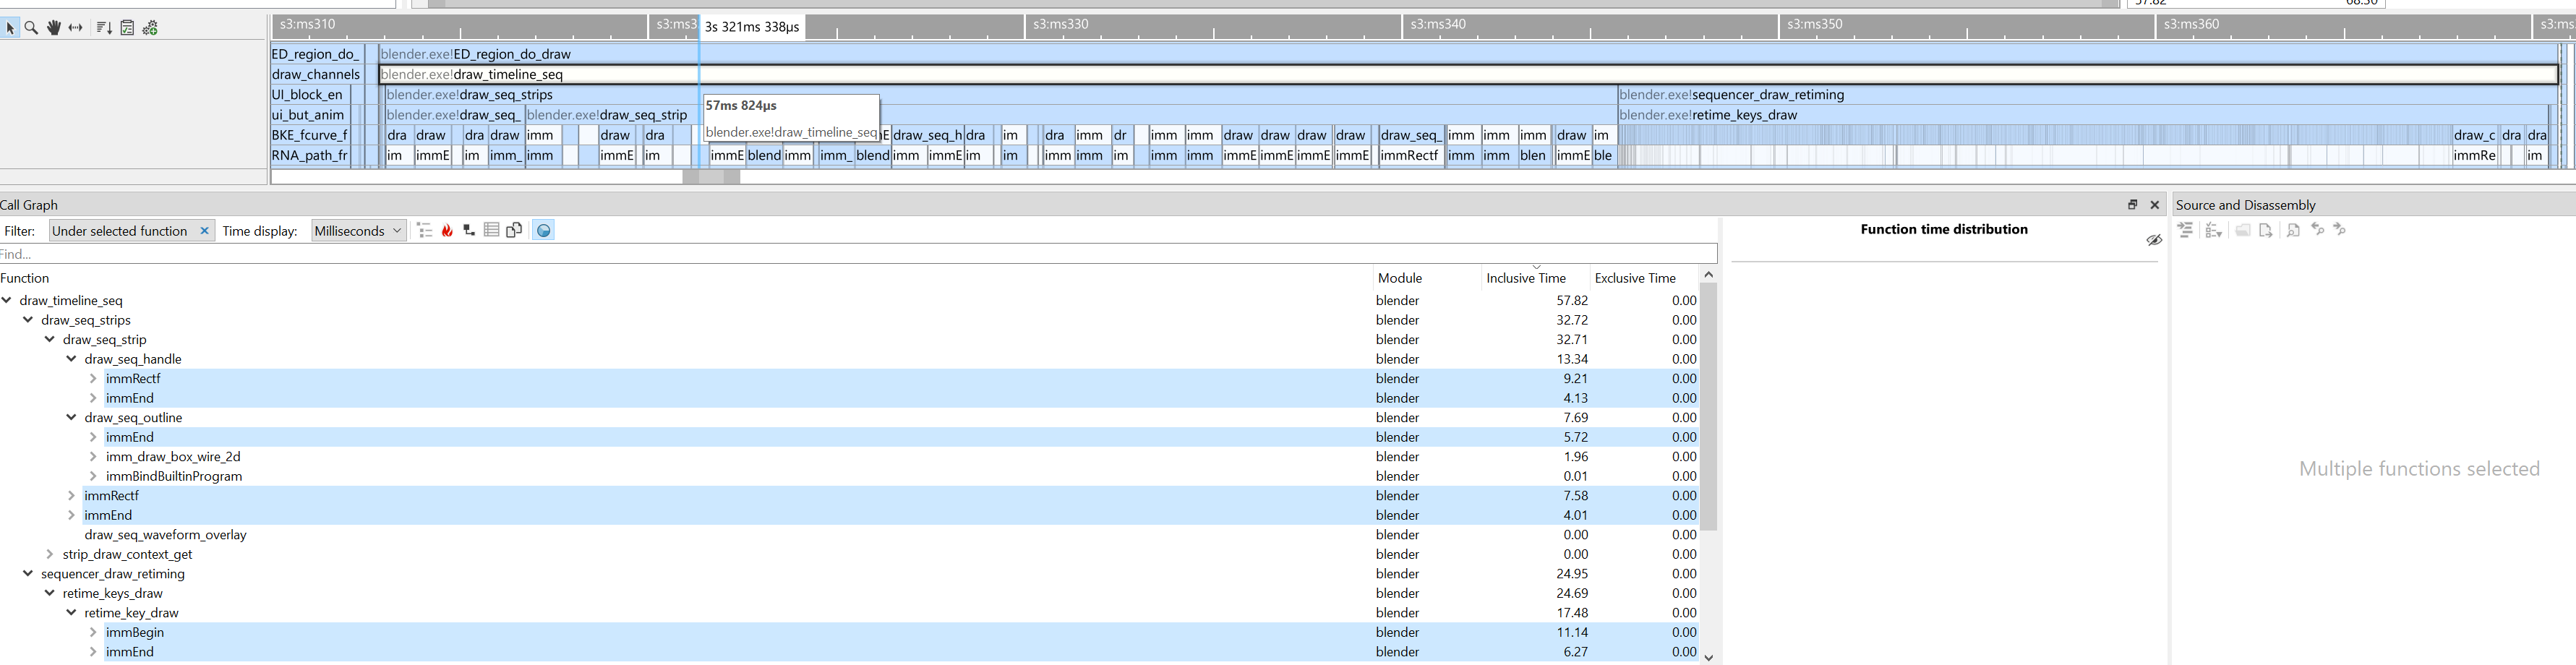
submitting graphics API draw calls two triangles at a time is not the fastest approach, heh. Here’s that process
visualized inside the most excellent Superluminal profiler – pretty much all the time
is spent inside “begin drawing one quad” and “finish drawing one quad” functions 🤦
As part of that, audio waveforms display also got some weirdness about it fixed, some UI polish tweaks, and now is on by default
(#115274).
Scopes
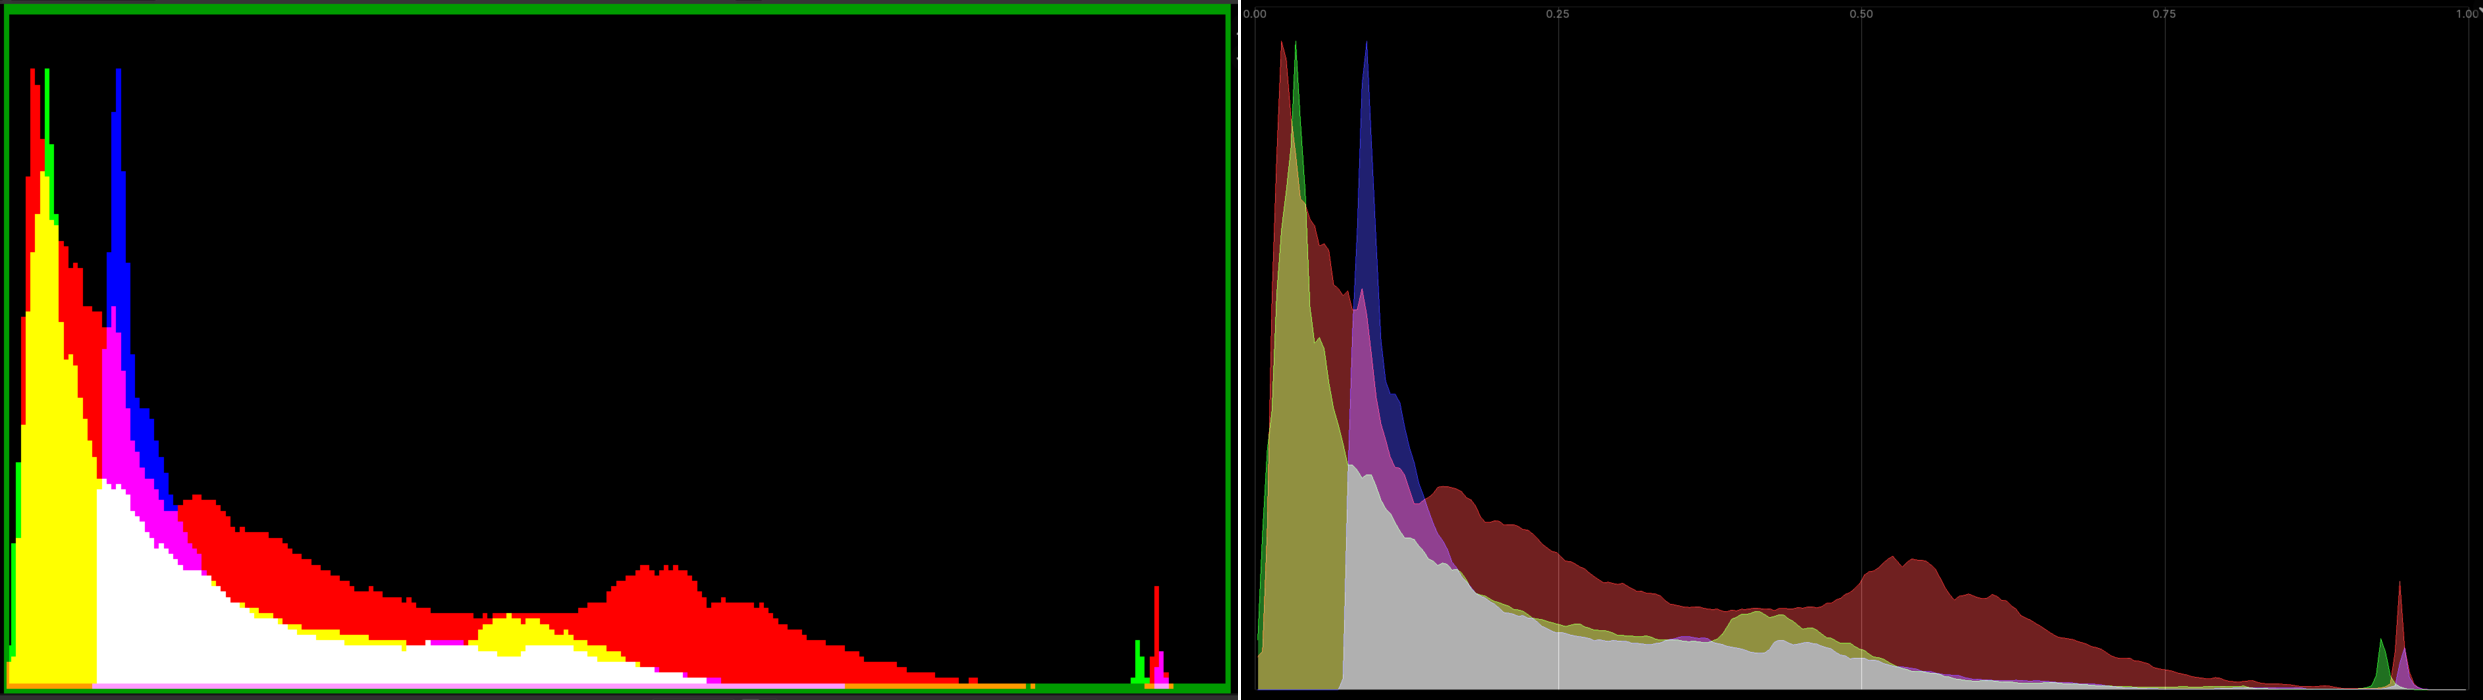
VSE has options to display typical “scopes” you might expect: image histogram, waveform, vectorscope. Here’s their look,
“before” on the left side, “now” on the right.
Histogram was drawn as pixelated image, with very saturated colors. Draw as nicer polygons, with a grid, and less saturation
(#116798):
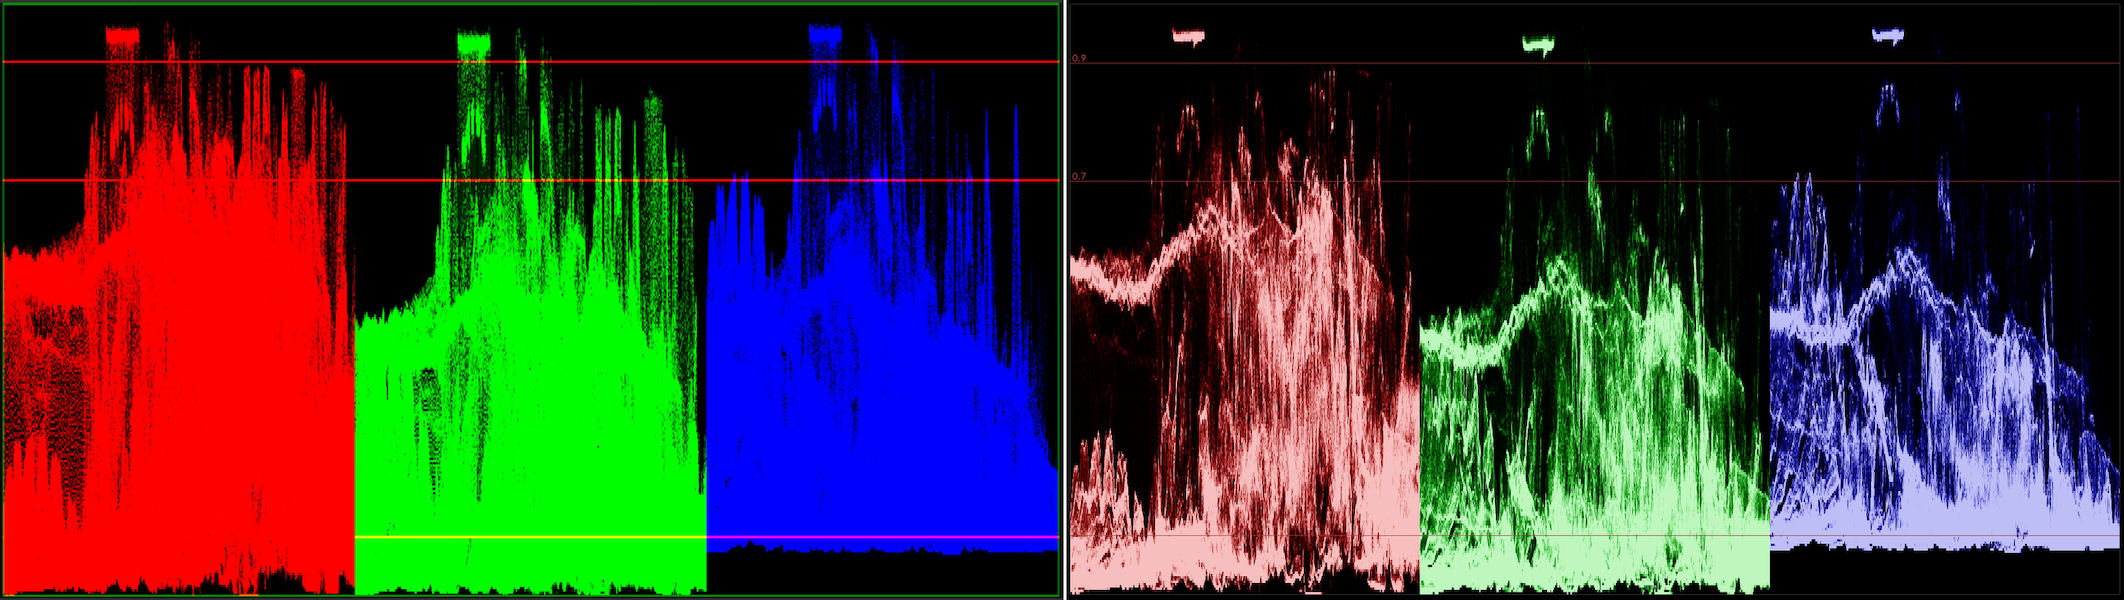
Waveform (here shown in “parade” option) was saturating very quickly. Oh, and make it 15x faster with some multi-threading
(#115579).
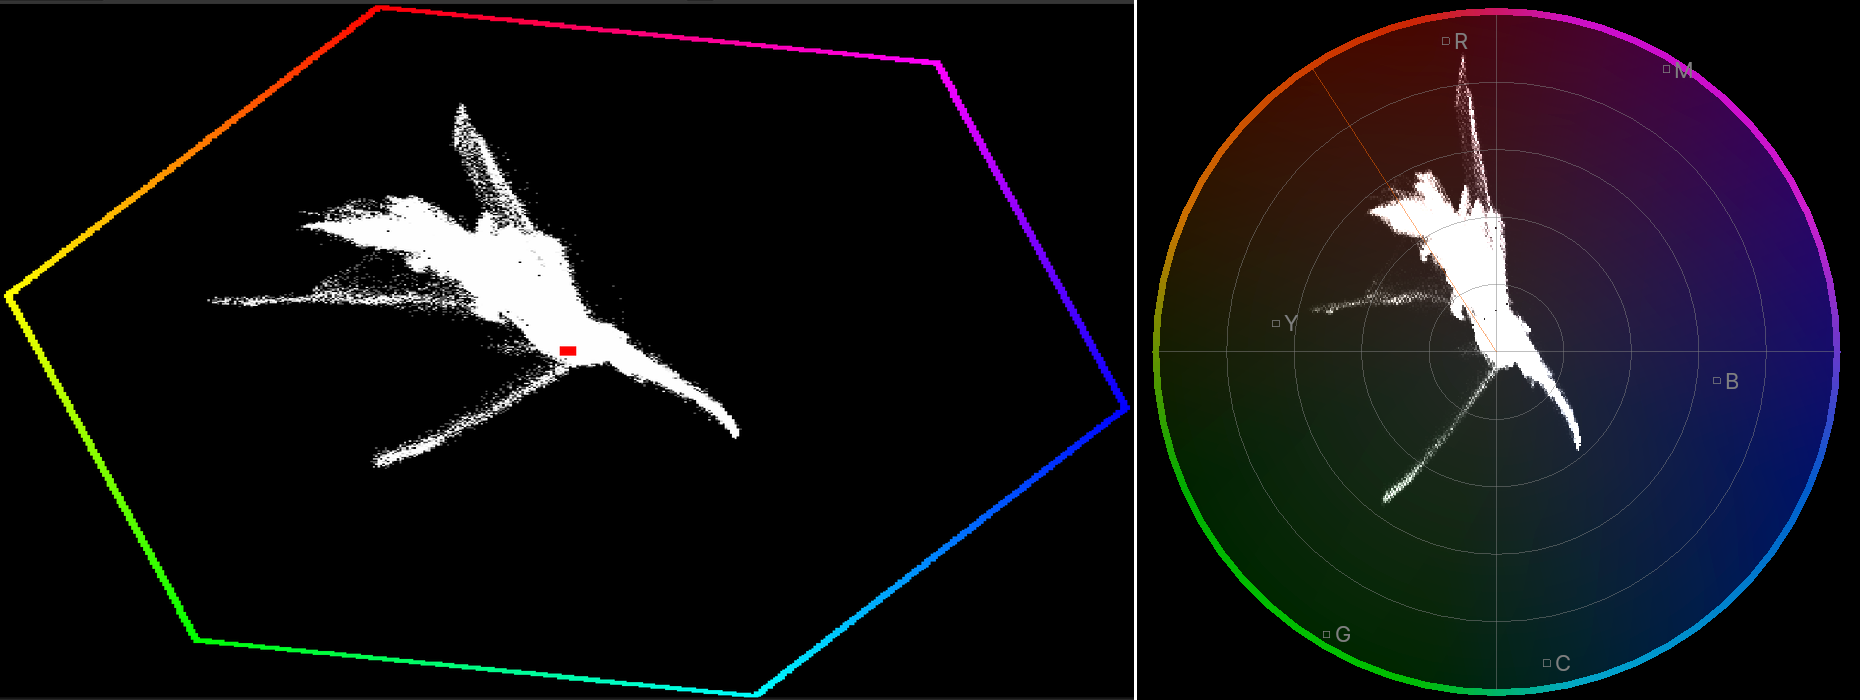
Vectorscope’s outer color hexagon looked very 90s with all the pixelation. Copy the updated image editor vectorscope
design, and voilà
(#117738):
While at it, the “show overexposed regions” (“zebra stripes”) option was also sped up 2x-3x
(#115622).
All these scopes (and image editor scopes) should at some point be done on the GPU with compute shaders, of course.
Someday.
ffmpeg bits
Blender primarily uses ffmpeg libraries for audio/video reading and writing. That suite is famous
for the extremely flexible and somewhat intimidating command line tooling, but within Blender the actual code libraries
like libavcodec are used. Among other things, libswscale is used to do
movie frame RGB↔YUV conversion. Turns out, libswscale can do those parts multi-threaded for a while by now, it’s just
not exactly intuitive how to achieve that.
Previous code was like:
// init
SwsContext *ctx = sws_getContext(...);
// convert RGB->YUV
sws_scale(ctx, ...);
but that ends up doing the conversion completely single-threaded. There is a "threads" parameter that you can set on the
context, to make it be able to multi-thread the conversion operation. But that parameter has to be set at initialization time,
which means you can no longer use sws_getContext(), and instead you have to initialize the context the hard way:
SwsContext *get_threaded_sws_context(int width,
                                     int height,
                                     AVPixelFormat src_format,
                                     AVPixelFormat dst_format)
{
  /* sws_getContext does not allow passing flags that ask for multi-threaded
   * scaling context, so do it the hard way. */
  SwsContext *c = sws_alloc_context();
  if (c == nullptr) {
    return nullptr;
  }
  av_opt_set_int(c, "srcw", width, 0);
  av_opt_set_int(c, "srch", height, 0);
  av_opt_set_int(c, "src_format", src_format, 0);
  av_opt_set_int(c, "dstw", width, 0);
  av_opt_set_int(c, "dsth", height, 0);
  av_opt_set_int(c, "dst_format", dst_format, 0);
  av_opt_set_int(c, "sws_flags", SWS_BICUBIC, 0);
  av_opt_set_int(c, "threads", BLI_system_thread_count(), 0);

  if (sws_init_context(c, nullptr, nullptr) < 0) {
    sws_freeContext(c);
    return nullptr;
  }

  return c;
}
And you’d think that’s enough? Haha, of course not. sws_scale() never does multi-threading internally. For that, you need
to use sws_scale_frame() instead. And once you do, it crashes since it turns out that you have had created your
AVFrame objects just a tiny bit wrong that was completely fine for sws_scale, but is very much not fine for sws_scale_frame
since the latter tries to do various sorts of reference counting and whatnot.
Kids, do not design APIs like this!
So all that took a while to figure out, but phew, done (#116008),
and the RGB→YUV conversion step while writing a movie file is quite a bit faster now. And then do the same in the other
direction, i.e. when reading a movie file, use multi-threaded YUV→RGB conversion, and fold vertical flip into the same operation
as well (#116309).
Audio resampling
While looking at where time is spent while rendering a movie out of VSE, I noticed a this feels excessive moment where
almost half of the time that takes to “produce a video or audio frame” is spent inside the audio library used by Blender
(Audaspace). Not in encoding audio, just in mixing it before encoding! Turns out,
most of that time is spent in resampling
audio clip data, for example the movie is set to 48kHz audio, but some of the audio strips are 44.1kHz or similar.
I started to dig in.
Audaspace, the audio engine, had two modes that it could do sound resampling: for inside-blender playback, it was using Linear
resampler, which just linearly interpolates between samples. For rendering a movie, it was using
Julius O Smith’s algorithm with, what it feels like, “uhh, somewhat overkill”
parameter sizes.
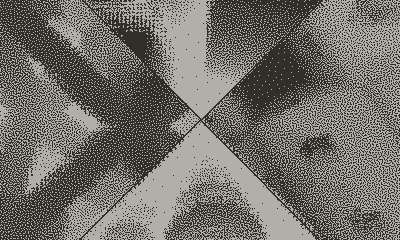
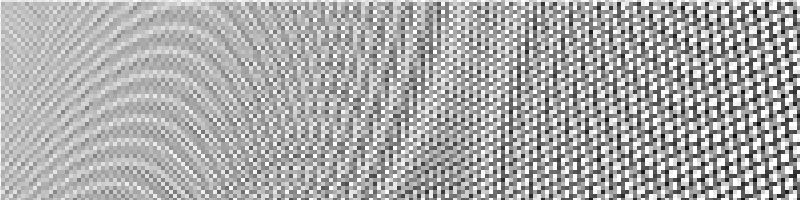
One way to look at resampler quality is to take a synthetic sound, e.g. one that has a single increasing frequency, resample it,
and look at the spectrogram of it. Here’s a “sweeping frequencies” sound, resampled
inside Audacity with “best”, “medium” and “low” resampling settings. What you want is the result
that looks like the “best” one, i.e. as little additional frequencies introduced as possible.
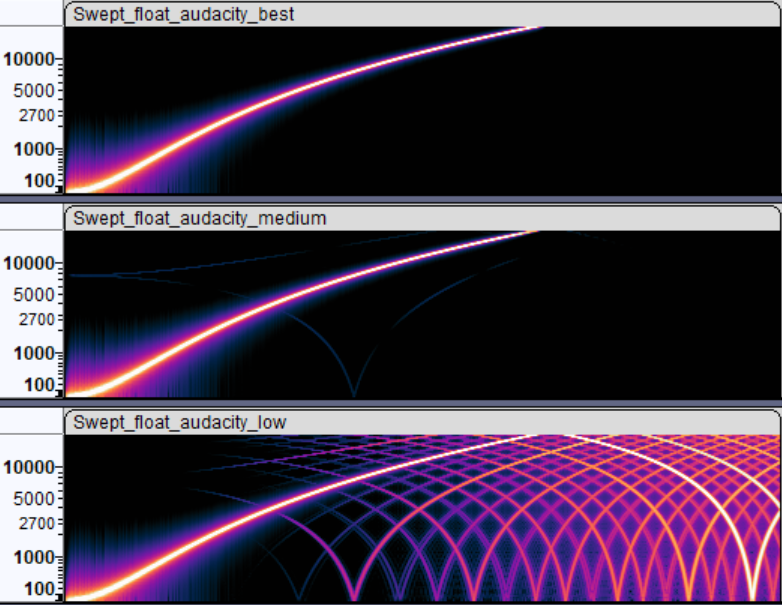
Inside Blender, Audaspace was providing two options: rendering vs. preview playback. Rendering one is good spectrogram indeed,
whereas preview, while being fast to compute resampling, does introduce a lot of extra frequencies.
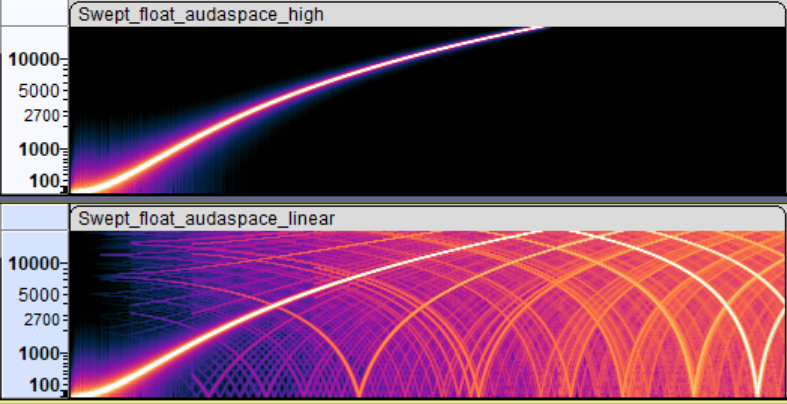
What I have done, is add a new “medium” resampling quality setting to Audaspace that, as far as I can tell, produces pretty much the same result
while being about 3x faster to calculate. And made Blender use that when rendering:
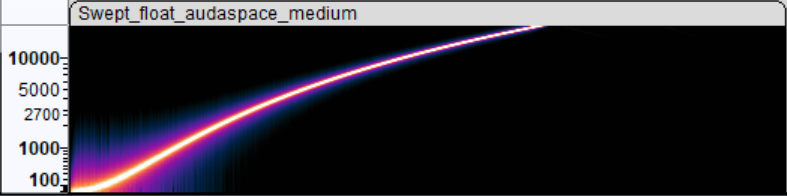
With that, rendering a portion (2000 frames) of Sprite Fright on Windows Ryzen 5950X
PC went 92sec→73 sec (#116059). And I’ve learned a thing or two about audio resampling. Not bad!
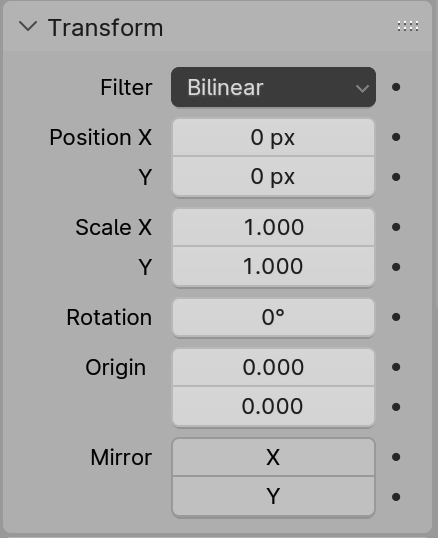 Strips that produce a visual (images, movies, text, scenes, …) in Blender VSE can be transformed: positioned, rotated, scaled, and additional cropping
can be applied. Whenever that happens, the image that is normally produced by the strip is transformed into a new one. All of that is done on the CPU,
and was multi-threaded already.
Strips that produce a visual (images, movies, text, scenes, …) in Blender VSE can be transformed: positioned, rotated, scaled, and additional cropping
can be applied. Whenever that happens, the image that is normally produced by the strip is transformed into a new one. All of that is done on the CPU,
and was multi-threaded already.
Yet it had some issues/bugs, and parts of the code could be optimized a bit. Plus some other things could be done.
“Why all of that is done on the CPU?!” you might ask. Good question! Part of the reason is, that no one made it be done on the GPU.
Another part, is that the CPU fallback still needs to exist (at least right now), for the use case of: user wants to render things on
a render farm that has no GPU.
“Off by half a pixel” errors
The code had various “off by half a pixel” errors that in many cases cancel themselves out or are invisible. Until they are not. This is not too dissimilar
to “half texel offset” things that everyone had to go through in DirectX 9 times when doing any sort of image postprocessing. Felt like youth again :)
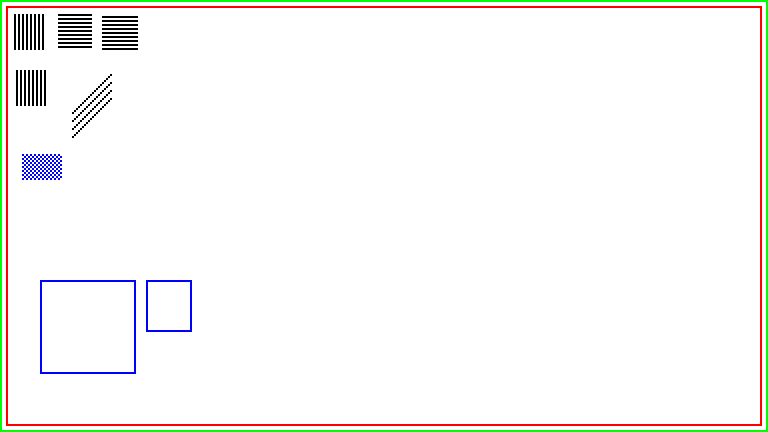
E.g. scaling a tiny image up 16x using Nearest and Bilinear filtering, respectively:


The Bilinear filter shifts the image by half the source pixel! (there’s also magenta – which is background color here – sneaking in; about that later)
In the other direction, scaling this image down exactly by 2x using Bilinear filtering does no filtering at all!

So things like that (as well as other “off by something” errors in other filters) got fixed
(#116628). And the images above look like this with Bilinear 16x upscaling and 2x downscaling:


Transparency border around Bilinear filtering
VSE had three filtering options in Blender 4.0 and earlier: Nearest, Bilinear and Subsampled3x3. Of those, only the Bilinear one was adding
half a source texel worth of transparency around the resulting image. Which is somewhat visible if you are scaling your media up. Why this discrepancy,
no one remembers at this point, but it was there “forever”, it seems.
There’s a similar issue in Blender (CPU) Compositor, where Bilinear sampling of something blends in “transparency” when right on the edge
of an image, whereas Bicubic sampling does not. Again, no one remembers why, and that should be addressed by someone. Someday.
I removed that “blend into transparency” from bilinear filtering code that is used by VSE. However! A side effect of this transparency
thing, is that if you do not scale your image but only rotate it, the edge does get some sort of anti-aliasing. Which it would be losing now, if just
removing that from bilinear.
So instead of blending in transparency when filtering the source image, instead I apply some sort of “transparency anti-aliasing” to the edge pixels of
the destination image (#117717).


Filtering additions and changes
Regular VSE strip transforms did not have a cubic filtering option (it only existed in the special Transform Effect strip), which sounded
like a curious omission. And that led into a rabbit hole of trying to figure out what exactly does Blender mean when they say “bicubic”,
as well as what other software means by “bicubic”. It’s quite a mess lol! See an interactive comparison I made here:
aras-p.info/img/misc/upsample_filter_comp_2024
Anyway, “Bicubic” everywhere within Blender actually means “Cubic B-Spline” filtering, i.e.
Mitchell-Netravali filter with B=1, C=0 coefficients,
also known as “no ringing, but lots of blur”. Whether that’s a good choice depends on use case and what do the images represent.
For VSE specifically, it sounded like the usual “Mitchell” filter (B=C=1/3) might have been better. Here’s both of them for example:
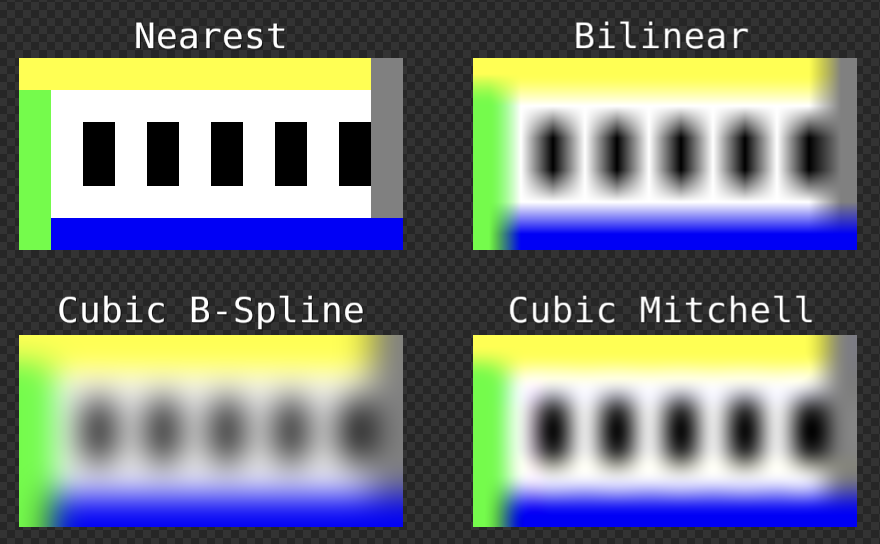
Both kinds of cubic filtering are an option in VSE now (#117100,
#117517).
For downscaling the image, Blender 3.5 added a “Subsampled 3x3” filter. What it actually is, is a box filter that is hardcoded to 3x3 size.
Whether box filter is a good filter, is a question for another day. But for now at least, I made it not be hardcoded to fixed 3x3 size
(#117584),
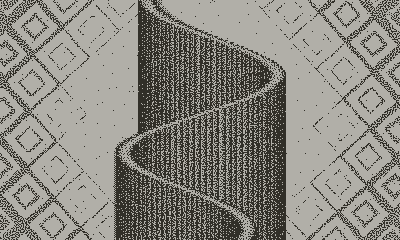
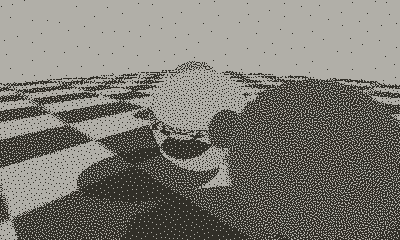
since if you scale the image down by not 3x3, it kinda starts to break down. Here, downscaling this perspective grid by 4x on each axis:
original image, downscaled with current Subsampled 3x3 filter, and downscaled with the adjusted Box filter. Slightly better:


All of that is a lot of choices for the user, TBH! So I added an “Auto” filter option
(#117853), that is now the default for VSE strips.
It automatically picks the “most appropriate” filter based on transform data:
- When there is no scaling or rotation: Nearest,
- When scaling up by more than 2x: Cubic Mitchell,
- When scaling down by more than 2x: Box,
- Otherwise: Bilinear.
Besides all that, the image filtering process got a bit faster:
- Get rid of virtual functions from the inner loop, and some SIMD for bilinear filtering (#115653),
- Simplify cubic filtering, and add some SIMD (#117100),
- Simplify math used by Box (née Subsampled3x3) filter (#117125),
- Fix “does a solid image that covers the whole screen, and so we can skip everything under it” optimization not working, when said image has scale
(#117786).
As a practical example, on my PC having a single 1920x1080 image in a 3840x2160 project (scaled up 2x), using Bilinear filtering: drawing the whole
sequencer preview area went from 36.8ms down to 15.9ms. I have some ideas how to speed it up further.
Optimizing VSE Effects
While the actual movie data sets I have from Blender Studio
do not use much/any effects, I optimized them by noticing something in the code.
Most of that is just multi-threading.
- Glow effect: multi-threaded now, 6x-10x faster (#115818).
- Wipe effect: multi-threaded now, and simplify excessive trigonometry in Clock wipe; 6x-20x faster
(#115837).
- Gamma Cross effect: was doing really complex table + interpolation based things just to avoid a single square root call.
Felt like the code was written before hardware floating point was invented :) 4x faster now
(#115801).
- Gaussian Blur effect: 1.5x faster by avoiding some redundant calculations (#116089).
What does all of that mean for render times?
On the three data sets I have from Blender Studio, the final render time of a VSE movie is about 2x faster on my PC.
For example, the same Sprite Fright edit: rendering it went from almost
13 minutes down to 7 minutes.
I hope things can be further sped up. We “only” need to do 2x speedup another three times, and then it’s quite good, right? :P
Thoughts on actual work process
Is all of the above a “good amount of work” done, for two months part-time effort?
I don’t know. I think it’s quite okay, especially considering that the developer (me) knew nothing about the area or the codebase. Besides the
user-visible changes outlined above, I did a handful of pull requests that were adding tests, refactoring code, cleaning something up, etc. In total
37 pull requests got done, reviewed and merged.
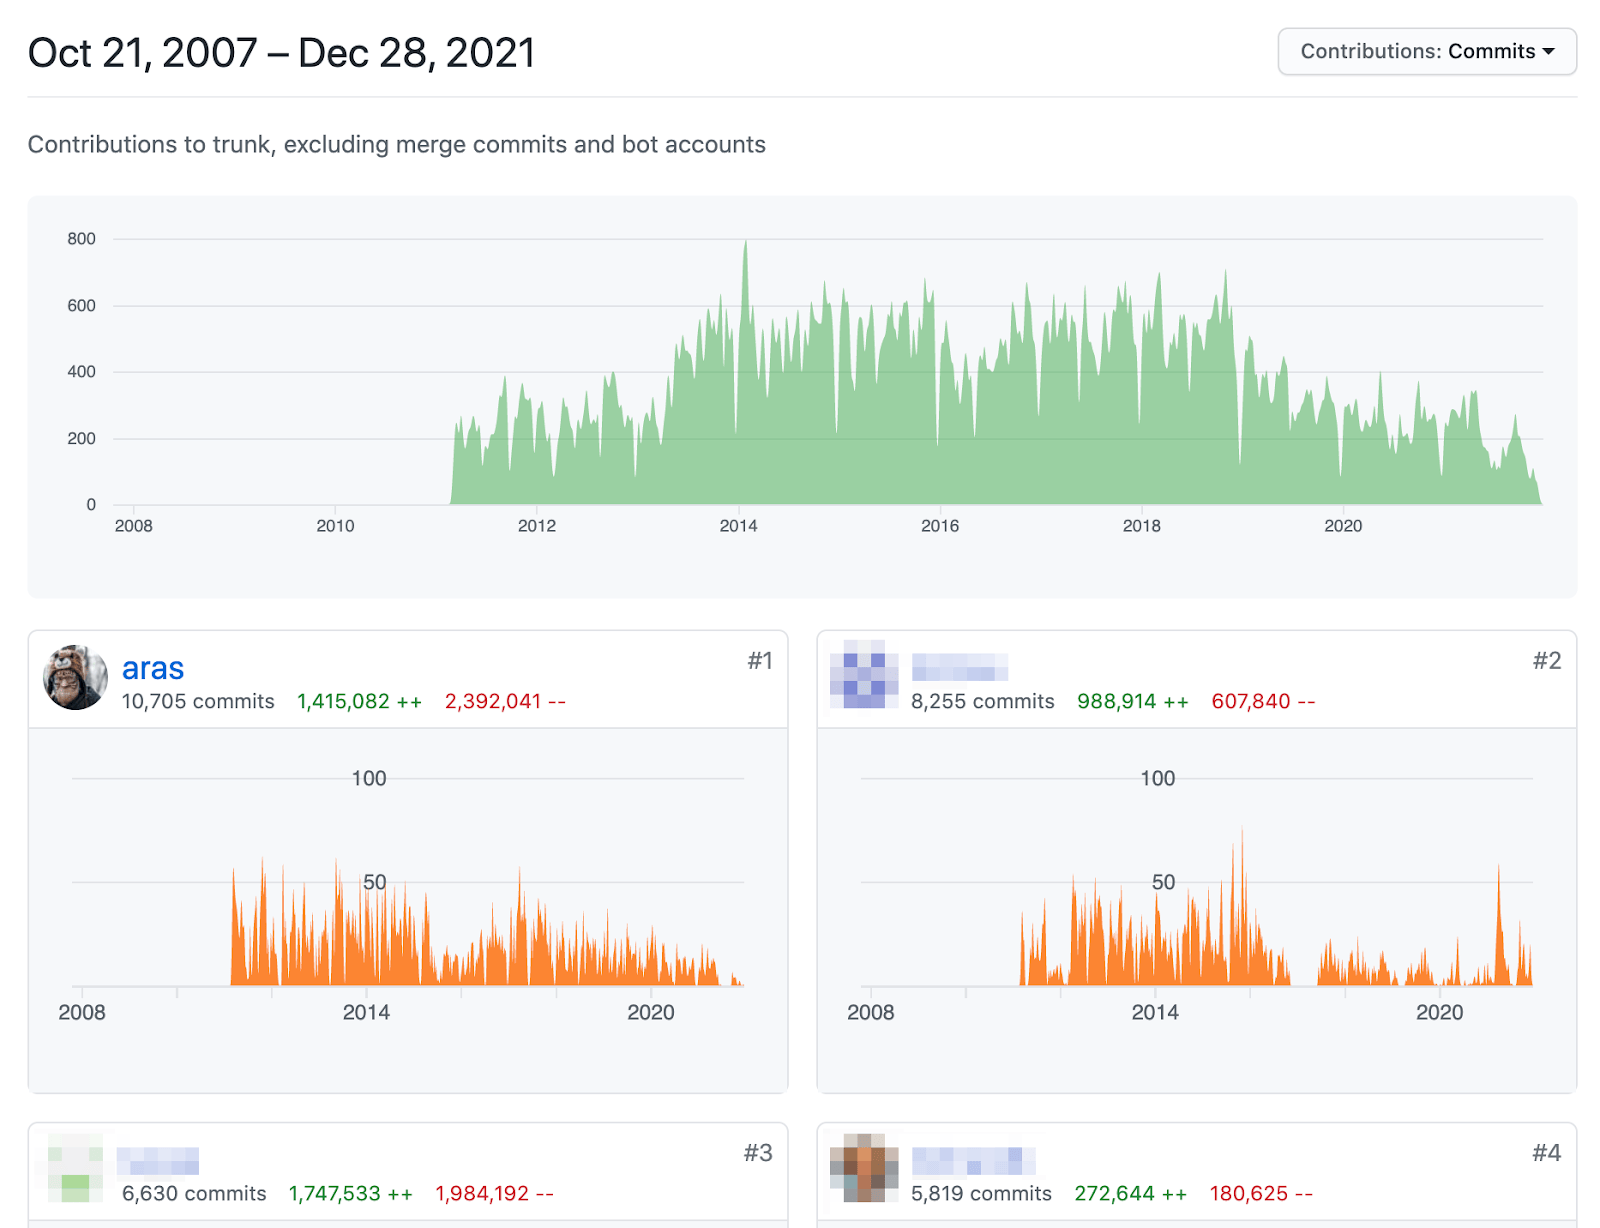
And here’s the interesting bit: I’m pretty sure I could have not done this at an “actual job”. I don’t have many jobs to compare,
but e.g. at Unity between around 2015 and 2022, I think I would have been able to do like 30% of the above in the same time. Maybe less.
I probably could have done the above at “ancient” Unity, i.e. around year 2010 or so.
The reasons are numerous and complex, and have to do with amount of people within the company, processes, expectations, communication, politics and
whatnot. But it is weirdly funny, that if I’m able to do “X amount of work in Y amount of time” for free, then at a company where it would
pay me relatively lotsa money for the work, various forces would try to make me do the same work slower. Or not finish the work at all, since
due to (again, complex reasons) the effort might get cancelled midway!
I hope Blender does not venture into that size/complexity/workflow where it feels like The Process is not helping, but rather is there to
demotivate and slow down everyone (not on purpose! it just slowly becomes that way).
What’s next?
Who knows! Blender 4.1 just became beta, which means feature-wise, it is “done” and the VSE related bits in 4.1 are going to be
as they are right now.
However, work on Blender 4.2 starts now, and then 4.3, … For the near future, I want to keep tinkering with it. But without a clear plan :)
Once I have something done, maybe I’ll write about them. Meanwhile, things can be observed in the
Weekly Updates forum section.
Until next time! Happy video sequence editing!