Mobile graphics API wishlist: performance

Most mobile platforms currently are based on OpenGL ES 2.0. While it is much better than traditional OpenGL, there are ways where it limits performance or does not expose some interesting hardware features. So here’s an unorganized wishlist for GLES2.0 performance part!

Note that I’m focusing on, in my limited understanding, short term low-hanging fruits how to extend/patch existing GLES2.0 API. A pipe dream would be starting from scratch, getting rid of all OpenGL baggage and hopefully come up with a much cleaner, leaner & better API, especially if it’s designed to only support some particular platform. But I digress, back to GLES2.0 for now.

No guarantees when something expensive might happen.

Due to some flexibility in GLES2.0, there might be expensive things happening at almost any point in your frame. For example, binding a texture with a different format might cause a driver to recompile a shader at the draw call time. I’ve seen 60 milliseconds on iPhone 3Gs at first draw call with a relatively simple shader, all spent inside shader compiler backend. 60 milliseconds! There are various things that can cause performance hiccups like this: texture formats, blending modes, vertex layout, non power of two textures and so on.

Suggestion: work with GPU vendors and agree on an API that could make guarantees on when the expensive resource creation / patching work can happen, and when it can’t. For example, somehow guarantee that a draw call or a state set will not cause any object recreation / shader patching in the driver. I don’t have much experience with D3D10/11, but my impression is that this was one of the things it got right, no?

Offline shader compilation.

GLES2.0 has the functionality to load binary shaders, but it’s not mandatory. Some of the big platforms (iOS, I’m looking at you) just don’t support it.

Now of course, a single platform (like iOS or Android) can have multiple different GPUs, so you can’t fully compile a shader offline into final optimized GPU microcode. But some of the full compilation cost could very well be done offline, without being specific to any particular GPU.

Suggestion: come up with a platform independent binary shader format. Something like D3D9 shader assembly is probably too low level (it assumes a vector4-based GPU, limited number of registers and so on), but something higher level should be possible. All of the shader lexing, parsing and common optimizations (constant folding, arithmetic simplifications, dead code removal etc.) can be done offline. It won’t speed up shader loading by an order of magnitude, but even if it’s possible to cut it by 20%, it’s worth it. And it would remove a very big bug surface area too!

Texture loading.

A lot (all?) of mobile platforms have unified CPU & GPU memories, however to actually load the texture we have to read or memory map it from disk and then copy into OpenGL via glTexture2D and similar functions. Then, depending on the format, the driver would internally do swizzling and alignment of texture data.

Suggestion: can’t most of this cost be removed? If for some formats it’s perfectly, statically known what layout and swizzling the GPU expects… can’t we just point the API to the data we already loaded or memory mapped? We could still need to implement the glTexture2D case for when (if ever) a totally new strange GPU comes that needs the data in a different order, but why not provide a faster path for the current GPUs?

Vertex declarations.

In unextended GLES2.0 you have to do a ton of calls just to setup vertex data. OES_vertex_array_object is a step in the right direction, providing the ability to create sets of vertex data bindings (“vertex declarations” in D3D speak). However, it builds upon an existing API, resulting in something that feels quite messy. Somehow it feels that by starting from scratch it could result in something much cleaner. Like… vertex declarations that existed in D3D since forever maybe?

Suggestion: clean up that shit! It would probably need to be tied to a vertex shader input signature (just like in D3D10/11) to guarantee there would be no shader patching, but we’d be fine with that.

Shader uniforms are per shader program.

What it says - shader uniforms (“constants” in D3D speak) are not global; they are tied to a specific shader program. I don’t quite understand why, and I don’t think any GPU works that way. This is causing complexities and/or performance loss in the driver (it either has to save & restore all uniform values on each shader change, or have dirty tracking on which uniforms have changed etc.). It also causes unneeded uniform sets on the client side - instead of having, for example, view*projection matrix set just once per frame it has to be set for each shader program that we use.

Suggestion: just get rid of that? If you need to not break the existing spec, how about adding an extension to make all uniforms global? I propose glCanHaz(GL_OES_GLOBAL_UNIFORMS_PLZ)

Next up:

Next time, I’ll take a look at my unorganized wishlist for mobile graphics features!


A Non-Uniform Work Distribution

Warning: a post with stupid questions and no answers whatsoever!

You need to do ten thousand things for the gold master / release / ShipIt(tm) moment. And you have 40 people who do the actual work… this means each of them only has to do 10000/40=250 things, which is not that bad. Right?

Meanwhile in the real world… it does not actually work like that. And that’s something that has been on my mind for a long time. I don’t know how much of this is truth vs. perception, or what to do about it. But here’s my feeling, simplified:

20 percent of the people are responsible for getting 80 percent of the work done

I am somewhat exaggerating just to keep it consistent with the Pareto principle. But my feeling is that “work done” distribution is highly non uniform everywhere I worked where the team was more than a handful of people.

Here are some stupid statistics to illustrate my point (with graphs, and everyone loves graphs!):

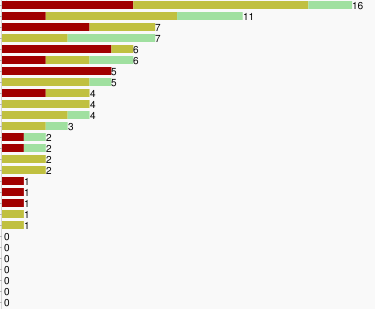
Graph of bugs fixed per developer, over one week during the bug fixing phase. Red/yellow/green corresponds to priority 1,2,3 issues:

The distribution of bugs fixes is, shall we say, somewhat non uniform.

Is it a valid measure of “productivity”? Absolutely not. Some people probably haven’t been fixing bugs at all that week. Some bugs are way harder to fix than others. Some people could have made major part of the fix, but the finishing touches & the act of actually resolving the bug was made by someone else. So yes, this statistics is absolutely flawed, but do we have anything else?

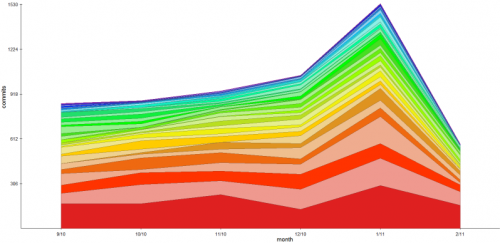
We could be checking version control commits.

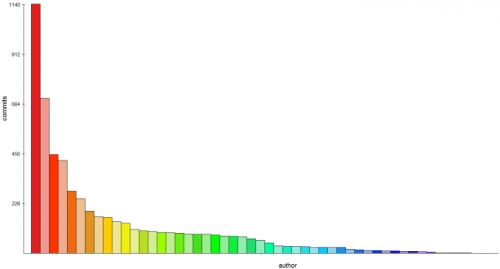
Or putting the same into “commits by developer”:

Of course this is even easier to game than resolving bugs. “Moving buttons to the left”, “Whoops, that was wrong, moving them to the right again” anyone? And people will be trolling statistics just because they can.

However, there is still this highly subjective “feeling” that some folks are way, way faster than others. And not in just “can do some mess real fast” way, but in the “gets actual work done, and done well” way.

Or is it just my experience? How is it in your company? What can be done about it? Should something be done about it? I don’t know the answers…


The Virtual and No-Virtual

You are writing some system where different implementations have to be used for different platforms. To keep things real, let’s say it’s a rendering system which we’ll call “GfxDevice” (based on a true story!). For example, on Windows there could be a Direct3D 9, Direct3D 11 or OpenGL implementations; on iOS/Android there could be OpenGL ES 1.1 & 2.0 ones and so on.

For sake of simplicity, let’s say our GfxDevice interface needs to do this (in real world it would need to do much more):

void SetShader (ShaderType type, ShaderID shader);
void SetTexture (int unit, TextureID texture);
void SetGeometry (VertexBufferID vb, IndexBufferID ib);
void Draw (PrimitiveType prim, int primCount);

How this can be done?

Approach #1: virtual interface!

Many a programmer would think like this: why of course, GfxDevice is an interface with virtual functions, and then we have multiple implementations of it. Sounds good, and that’s what you would have been taught at the university in various software design courses. Here we go:

class GfxDevice {
public:
    virtual ~GfxDevice();
    virtual void SetShader (ShaderType type, ShaderID shader) = 0;
    virtual void SetTexture (int unit, TextureID texture) = 0;
    virtual void SetGeometry (VertexBufferID vb, IndexBufferID ib) = 0;
    virtual void Draw (PrimitiveType prim, int primCount) = 0;
};
// and then we have:
class GfxDeviceD3D9 : public GfxDevice {
    // ...
};
class GfxDeviceGLES20 : public GfxDevice {
    // ...
};
class GfxDeviceGCM : public GfxDevice {
    // ...
};
// and so on

And then based on platform (or something else) you create the right GfxDevice implementation, and the rest of the code uses that. This is all good and it works.

But then… hey! Some platforms can only ever have one GfxDevice implementation. On PS3 you will always end up using GfxDeviceGCM. Does it really make sense to have virtual functions on that platform?

Side note: of course the cost of a virtual function call is not something that stands out immediately. It’s much less than, for example, doing a network request to get the leaderboards or parsing that XML file that ended up in your game for reasons no one can remember. Virtual function calls will not show up in the profiler as “a heavy bottleneck”. However, they are not free and their cost will be scattered around in a million places that is very hard to eradicate. You can end up having death by a thousand paper cuts.

If we want to get rid of virtual functions on platforms where they are useless, what can we do?

Approach #2: preprocessor to the rescue

We just have to take out the “virtual” bit from the interface, and the “= 0” abstract function bit. With a bit of preprocessor we can:

#define GFX_DEVICE_VIRTUAL (PLATFORM_WINDOWS || PLATFORM_MOBILE_UNIVERSAL || SOMETHING_ELSE)
#if GFX_DEVICE_VIRTUAL
    #define GFX_API virtual
    #define GFX_PURE = 0
#else
    #define GFX_API
    #define GFX_PURE
#endif
class GfxDevice {
public:
    GFX_API ~GfxDevice();
    GFX_API void SetShader (ShaderType type, ShaderID shader) GFX_PURE;
    GFX_API void SetTexture (int unit, TextureID texture) GFX_PURE;
    GFX_API void SetGeometry (VertexBufferID vb, IndexBufferID ib) GFX_PURE;
    GFX_API void Draw (PrimitiveType prim, int primCount) GFX_PURE;
};

And then there’s no separate class called GfxDeviceGCM for PS3; it’s just GfxDevice class implementing non-virtual methods. You have to make sure you don’t try to compile multiple GfxDevice class implementations on PS3 of course.

Ta-da! Virtual functions are gone on some platforms and life is good.

But we still have the other platforms, where there can be more than one GfxDevice implementation, and the decision for which one to use is made at runtime. Like our good old friend the PC: you could use Direct3D 9 or Direct3D 11 or OpenGL, based on the OS, GPU capabilities or user’s preference. Or a mobile platform where you don’t know whether OpenGL ES 2.0 will be available and you’d have to fallback to OpenGL ES 1.1.

Let’s think about what virtual functions actually are

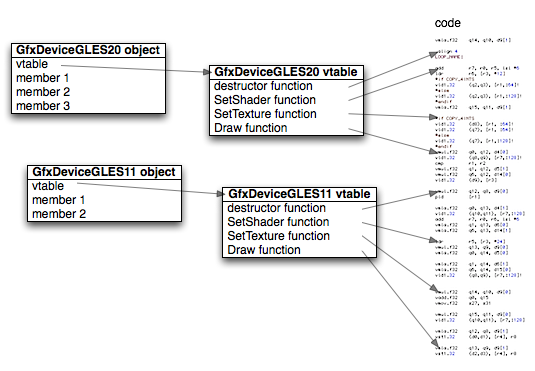
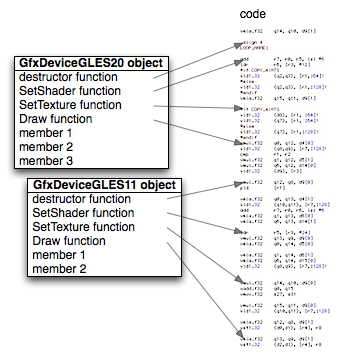
How virtual functions work? Usually they work like this: each object gets a “pointer to a virtual function table” as it’s first hidden member. The virtual function table (vtable) is then just pointers to where the functions are in the code. Something like this:

The key points are: 1) each object’s data starts with a vtable pointer, and 2) vtable layout for classes implementing the same interface is the same.

When the compiler generates code for something like this:

device->Draw (kPrimTriangles, 1337);

it will generate something like the following pseudo-assembly:

vtable = load pointer from [device] address
drawlocation = vtable + 3*PointerSize ; since Draw is at index [3] in vtable
drawfunction = load pointer from [drawlocation] address
pass device pointer, kPrimTriangles and 1337 as arguments
call into code at [drawfunction] address

This code will work no matter if device is of GfxDeviceGLES20 or GfxDeviceGLES11 kind. For both cases, the first pointer in the object will point to the appropriate vtable, and the fourth pointer in the vtable will point to the appropriate Draw function.

By the way, the above illustrates the overhead of a virtual function call. If we’d assume a platform where we have an in-order CPU and reading from memory takes 500 CPU cycles (which is not far from truth for current consoles), then if nothing we need is in the CPU cache yet, this is what actually happens:

vtable = load pointer from [device] address
; *wait 500 cycles* until the pointer arrives
drawlocation = vtable + 3*PointerSize
drawfunction = load pointer from [drawlocation] address
; *wait 500 cycles* until the pointer arrives
pass device pointer, kPrimTriangles and 1337 as arguments
call into code at [drawfunction] address
; *wait 500 cycles* until code at that address is loaded

Can we do better?

Look at the picture in the previous paragraph and remember the “wait 500 cycles” for each pointer we are chasing. Can we reduce the number of pointer chases? Of course we can: why not ditch the vtable altogether, and just put function pointers directly into the GfxDevice object?

Virtual tables are implemented in this way mostly to save space. If we had 10000 objects of some class that has 20 virtual methods, we only pay one pointer overhead per object (40000 bytes on 32 bit architecture) and we store the vtable (20*4=80 bytes on 32 bit arch) just once, in total 39.14 kilobytes.

If we’d move all function pointers into objects themselves, we’d need to store 20 function pointers in each object. Which would be 781.25 kilobytes! Clearly this approach does not scale with increasing object instance counts.

However, how many GfxDevice object instances do we really have? Most often… exactly one.

Approach #3: function pointers

If we move function pointers to the object itself, we’d have something like this:

There’s no built-in language support for implementing this in C++ however, so that would have to be done manually. Something like:

struct GfxDeviceFunctions {
    SetShaderFunc SetShader;
    SetTextureFunc SetTexture;
    SetGeometryFunc SetGeometry;
    DrawFunc Draw;
};
class GfxDeviceGLES20 : public GfxDeviceFunctions {
    // ...
};

And then when creating a particular GfxDevice, you have to fill in the function pointers yourself. And the functions were member functions which magically take “this” parameter; it’s hard to just use them as function pointers without going to clumsy C++ member function pointer syntax and related issues.

We can be more explicit, C style, and instead just have the functions be static, taking “this” parameter directly:

class GfxDeviceGLES20 : public GfxDeviceFunctions {
    // ...
    static void DrawImpl (GfxDevice* self, PrimitiveType prim, int primCount);
    // ...
};

Code that uses it would look like this then:

device->Draw (device, kPrimTriangles, 1337);

and it would generate the following pseudo-assembly:

drawlocation = device + 3*PointerSize
drawfunction = load pointer from [drawlocation] address
; *wait 500 cycles* until the pointer arrives
pass device pointer, kPrimTriangles and 1337 as arguments
call into code at [drawfunction] address
; *wait 500 cycles* until code at that address is loaded

Look at that, one of “wait 500 cycles” is gone!

More C style

We could move function pointers outside of GfxDevice if we want to, and just make them global:

In GLES1.1 case, that global GfxDevice funcs block would point to different pieces of code. And the pseudocode for this:

// global variables!
SetShaderFunc GfxSetShader;
SetTextureFunc GfxSetTexture;
SetGeometryFunc GfxSetGeometry;
DrawFunc GfxDraw;
// GLES2.0 implementation:
void GfxDrawGLES20 (GfxDevice* self, PrimitiveType prim, int primCount) { /* ... */ }

Code that uses it:

GfxDraw (device, kPrimTriangles, 1337);

and the pseudo-assembly:

drawfunction = load pointer from [GfxDraw variable] address
; wait 500 cycles until the pointer arrives
pass device pointer, kPrimTriangles and 1337 as arguments
call into code at [drawfunction] address
; wait 500 cycles until code at that address is loaded

Is it worth it?

I can hear some saying, “what? throwing away C++ OOP and implementing the same in almost raw C?! you’re crazy!”

Whether going the above route is better or worse is mostly a matter of programming style and preferences. It does get rid of one “wait 500 cycles” in the worst case for sure. And yes, to get that you do lose some of automagic syntax sugar in C++.

Is it worth it? Like always, depends on a lot of things. But if you do find yourself pondering the virtual function overhead for singleton-like objects, or especially if you do see that your profiler reports cache misses when calling into them, at least you’ll know one of the many possible alternatives, right?

And yeah, another alternative that’s easy to do on some platforms? Just put different GfxDevice implementations into dynamically loaded libraries, exposing the same set of functions. Which would end up being very similar to the last approach of “store function pointer table globally”, except you’d get some compiler syntax sugar to make it easier; and you wouldn’t even need to load the code that is not going to be used.


iOS shader tricks, or it's 2001 all over again

I was recently optimizing some OpenGL ES 2.0 shaders for iOS/Android, and it was funny to see how performance tricks that were cool in 2001 are having their revenge again. Here’s a small example of starting with a normalmapped Blinn-Phong shader and optimizing it to run several times faster. Most of the clever stuff below was actually done by ReJ, props to him!

Here’s a small test I’ll be working on: just a single plane with albedo and normal map textures:

I’ll be testing on iPhone 3Gs with iOS 4.2.1. Timer is started before glClear() and stopped after glFinish() that I added just after drawing the mesh.

Let’s start with an initial naive shader version:

Should be pretty self-explanatory to anyone who’s familiar with tangent space normal mapping and Blinn-Phong BRDF. Running time: 24.5 milliseconds. On iPhone 4’s Retina resolution, this would be about 4x slower!

What can we do next? On mobile platforms using appropriate precision of variables is often very important, especially in a fragment shader. So let’s go and add highp/mediump/lowp qualifiers to the fragment shader: shader source

Still the same running time! Alas, iOS does not have low level shader analysis tools, so we can’t really tell why that is happening. We could be limited by something else (e.g. normalizing vectors and computing pow() being the bottlenecks that run in parallel with all low precision stuff), or the driver might be promoting most of our computations to higher precision because it feels like it. It’s a magic box!

Let’s start approximating instead. How about computing normalized view direction per vertex, and interpolating that for the fragment shader? It won’t be entirely “correct”, but hey, it’s a phone we’re talking about. shader source

15 milliseconds! But… the rendering is wrong; everything turned white near the bottom of the screen. Turns out PowerVR SGX (the GPU in all current iOS devices) is really meaning “low precision” when we want to add two lowp vectors and normalize the result. Let’s try promoting one of them to medium precision with a “varying mediump vec3 v_viewdir”: shader source

That fixed rendering, but we’re back to 24.5 milliseconds. Sad shader writers are sad… oh shader performance analysis tools, where art thou?

Let’s try approximating some more: compute half-vector in the vertex shader, and interpolate normalized value. This would get rid of all normalizations in the fragment shader. shader source

16.3 milliseconds, not too bad! We still have pow() computed in the fragment shader, and that one is probably not the fastest operation there…

Almost a decade ago, a very common trick was to use a lookup texture to do the lighting. For example, a 2D texture indexed by (N.L, N.H). Since all lighting data would be “baked” into the texture, it does not necessarily have to be Blinn-Phong even; we can prepare faux-anisotropic, metallic, toon-shading or other fancy BRDFs there, as long as they can be expressed in terms of N.L and N.H. So let’s try creating 128x128 RGBA lookup texture and use that: shader source

A fast & not super efficient code to create the lighting lookup texture for Blinn-Phong:

9.1 milliseconds! We lost some precision in the specular though (it’s dimmer):

What else can be done? Notice that we clamp N.L and N.H values in the fragment shader, but this could be done just as well by the texture sampler, if we set texture’s addressing mode to CLAMP_TO_EDGE. Let’s get rid of the clamps: shader source

This is 8.3 milliseconds, or 7.6 milliseconds if we reduce our lighting texture resolution to 32x128.

Should we stop there? Not necessarily. For example, the shader is still multiplying albedo with a per-material color. Maybe that’s not very useful and can be let go. Maybe we can also make specular be always white?

How fast is this? 5.9 milliseconds, or over 4 times faster than our original shader.

Could it be made faster? Maybe; that’s an exercise for the reader :) I tried computing just the RGB color channels and setting alpha to zero, but that got slightly slower. Without real shader analysis tools it’s hard to see where or if additional cycles could be squeezed out.

I’m adding Xcode project with sources, textures and shaders of this experiment. Notes about it: only tested on iPhone 3Gs (probably will crash on iPhone 3G, and iPad will have wrong aspect ratio). Might not work at all! Shader is read from Resources/Shaders/shader.txt, next to it are shader versions of the steps of this experiment. Enjoy!


GLSL Optimizer

During development of Unity 3.0, I was not-so-pleasantly surprised to see that our cross-compiled shaders run slow on iPhone 3Gs. And by “slow”, I mean SLOW; at the speeds of “stop the presses, we can not ship brand new OpenGL ES 2.0 support with THAT performance”.

Back story

Take this HLSL pixel shader for particles, that does nothing but multiplies texture with per-vertex color:

half4 frag (v2f i) : COLOR { return i.color * tex2D (_MainTex, i.texcoord); }

This is about as simple as it can get; should be one texture fetch and one multiply for the GPU.

Now of course, when HLSL gets cross-compiled into GLSL, it is augmented by some dummy functions/moves to match GLSL’s semantics of “a function called main that takes no arguments and returns no value”. So you get something like this in GLSL:

vec4 frag (in v2f i) { return i.color * texture2D (_MainTex, i.texcoord); }
void main() {
    vec4 xl_retval;
    v2f xlt_i;
    xlt_i.color = gl_Color;
    xlt_i.texcoord = gl_TexCoord[0];
    xl_retval = frag (xlt_i);
    gl_FragData[0] = xl_retval;
}

Makes sense. The original function was translated, and main() got added that fills in the input structure, calls the function and writes result to gl_FragData[0] (aka gl_FragColor).

Lo and behold, the above (with some OpenGL ES 2.0 specific stuff added, like precision qualifiers, definitions of varyings etc.) runs like sh*t on a mobile platform.

Which probably means mobile platform drivers are quite bad at optimizing GLSL. I mostly tested iOS, but some tests on Android indicate that situation is the same (maybe even worse, depending on exact kind of Android you have). Which is sad since said platforms also do not have any way to precompile shaders offline, where they could afford good but slow compilers.

Now of course, if you’re writing GLSL shaders by hand, you’re probably writing close to optimal code, with no redundant data moves or wrapper functions. But if you’re cross-compiling them from Cg/HLSL, or generating from some shader fragments, or from visual shader editors, you probably depend on shader compiler being decent at optimizing redundant bits.

GLSL Optimizer

Around the same time I accidentally discovered that Mesa 3D guys are working on new GLSL compiler, dubbed GLSL2. I looked at the code and I liked it a lot; very hackable and “no bullshit” approach. So I took that Mesa’s GLSL compiler and made it output GLSL back after it has done all the optimizations.

Here it is: http://github.com/aras-p/glsl-optimizer

It reads GLSL, does some architecture independent optimizations (dead code removal, algebraic simplifications, constant propagation, constant folding, inlining, …) and spits out “optimized” GLSL back.

Results

The above simple particle shader example. GLSL optimizer optimizes it into:

void main() {
    gl_FragData[0] =
        (gl_Color.xyzw * texture2D (_MainTex, gl_TexCoord[0].xy)).xyzw;
}

Save for redundant swizzle outputs (on my todo list), this is pretty much what you’d be writing by hand. No redundant moves, function call inlined, no extra temporaries, sweet!

How much difference does this make?

Lots of particles, non-optimized GLSL on the left; optimized GLSL on the right (click for larger image). Yep, it’s 236 vs. 36 milliseconds/frame (4 vs. 27 FPS).

This result is for iPhone 3Gs running iOS 4.1. Some Android results: Motorola Droid (some PowerVR GPU): 537 vs. 223 ms; Nexus One (Snapdragon 8250 w/ Adreno GPU): 155 vs. 155 ms (yay! good drivers!); Samsung Galaxy S (some PowerVR GPU): 200 vs. 60 ms. All tests were ran at native device resolutions, so do not take this as performance comparisons between devices.

What about a more complex shader example? Let’s try per-pixel lit Diffuse shader (which is quite simple, but will do ok as “complex shader” example for a mobile platform). You can see that the GLSL code below is mostly auto-generated; writing it by hand wouldn’t produce that many data moves, unused struct members etc. Cg compiles original shader code into 10 ALU and 1 TEX instructions for D3D9 pixel shader 2.0, and is able to optimize away all the redundant stuff.

struct SurfaceOutput {
    vec3 Albedo;
    vec3 Normal;
    vec3 Emission;
    float Specular;
    float Gloss;
    float Alpha;
};
struct Input {
    vec2 uv_MainTex;
};
struct v2f_surf {
    vec4 pos;
    vec2 hip_pack0;
    vec3 normal;
    vec3 vlight;
};
uniform vec4 _Color;
uniform vec4 _LightColor0;
uniform sampler2D _MainTex;
uniform vec4 _WorldSpaceLightPos0;
void surf (in Input IN, inout SurfaceOutput o) {
    vec4 c;
    c = texture2D (_MainTex, IN.uv_MainTex) * _Color;
    o.Albedo = c.xyz;
    o.Alpha = c.w;
}
vec4 LightingLambert (in SurfaceOutput s, in vec3 lightDir, in float atten) {
    float diff;
    vec4 c;
    diff = max (0.0, dot (s.Normal, lightDir));
    c.xyz  = (s.Albedo * _LightColor0.xyz) * (diff * atten * 2.0);
    c.w  = s.Alpha;
    return c;
}
vec4 frag_surf (in v2f_surf IN) {
    Input surfIN;
    SurfaceOutput o;
    float atten = 1.0;
    vec4 c;
    surfIN.uv_MainTex = IN.hip_pack0.xy;
    o.Albedo = vec3 (0.0);
    o.Emission = vec3 (0.0);
    o.Specular = 0.0;
    o.Alpha = 0.0;
    o.Gloss = 0.0;
    o.Normal = IN.normal;
    surf (surfIN, o);
    c = LightingLambert (o, _WorldSpaceLightPos0.xyz, atten);
    c.xyz += (o.Albedo * IN.vlight);
    c.w = o.Alpha;
    return c;
}
void main() {
    vec4 xl_retval;
    v2f_surf xlt_IN;
    xlt_IN.hip_pack0 = vec2 (gl_TexCoord[0]);
    xlt_IN.normal = vec3 (gl_TexCoord[1]);
    xlt_IN.vlight = vec3 (gl_TexCoord[2]);
    xl_retval = frag_surf (xlt_IN);
    gl_FragData[0] = xl_retval;
}

Running the above through GLSL optimizer produces this:

uniform vec4 _Color;
uniform vec4 _LightColor0;
uniform sampler2D _MainTex;
uniform vec4 _WorldSpaceLightPos0;
void main ()
{
    vec4 c;
    vec4 tmpvar_32;
    tmpvar_32 = texture2D (_MainTex, gl_TexCoord[0].xy) * _Color;
    vec3 tmpvar_33;
    tmpvar_33 = tmpvar_32.xyz;
    float tmpvar_34;
    tmpvar_34 = tmpvar_32.w;
    vec4 c_i0_i1;
    c_i0_i1.xyz = ((tmpvar_33 * _LightColor0.xyz) *
    	(max (0.0, dot (gl_TexCoord[1].xyz, _WorldSpaceLightPos0.xyz)) * 2.0)).xyz;
    c_i0_i1.w = (vec4(tmpvar_34)).w;
    c = c_i0_i1;
    c.xyz = (c_i0_i1.xyz + (tmpvar_33 * gl_TexCoord[2].xyz)).xyz;
    c.w = (vec4(tmpvar_34)).w;
    gl_FragData[0] = c.xyzw;
}

All functions got inlined, all unused variable assignments got eliminated, and most of redundant moves are gone. There are some redundant moves left though (again, on my todo list), and the variables are assigned cryptic names after inlining. But otherwise, writing the equivalent shader by hand would be pretty close.

Difference between non-optimized and optimized GLSL in this case:

Non-optimized vs. optimized: 350 vs. 267 ms/frame (2.9 vs. 3.7 FPS). Not bad either!

Closing thoughts

Pulling off this GLSL optimizer quite late in Unity 3.0 release cycle was a risky move, but it did work.

Hats off to Mesa folks (Eric Anholt, Ian Romanick, Kenneth Graunke et al) for making an awesome codebase of the GLSL compiler! I haven’t merged up latest GLSL compiler developments on Mesa tree; they’ve implemented quite a few new compiler optimizations but I was too busy shipping Unity 3 already. Will try to merge them in soon-ish.

I’ve tested non-optimized vs. optimized GLSL a bit on a desktop platform (MacBook Pro, GeForce 8600M, OS X 10.6.4) and there is no observable speed difference. Which makes sense, and I would have expected mobile drivers to be good at optimization as well, but apparently that’s not the case.

Now of course, mobile drivers will improve over time, and I hope offline “GLSL optimization” step will become obsolete in the future. I still think it makes perfect sense to fully compile shaders offline, so at runtime there’s no trace of GLSL at all (just load binary blob of GPU microcode into the driver), but that’s a story for another day.

In the meantime, you’re welcome to try GLSL Optimizer out!