Clang Build Analyzer
So! A while ago I worked on adding -ftime-trace support for Clang.
That landed and shipped in Clang 9.0 in
September of 2019, so \(^O^)/ Looks like it will also be coming to Sony development tools soon (see SN Systems
blog post).
All that is good, but it works on one compiled file at a time. If you know which source files are problematic in your whole build, then great. But what if you don’t, and just want to see things like “which headers are most expensive to include across whole codebase”?
I built a little tool just for that: Clang Build Analyzer. Here: github.com/aras-p/ClangBuildAnalyzer
Basically it grabs *.json files produced by -ftime-trace from your whole build, smashes them together and does
some analysis across all of them. For headers being included, templates being instantiated, functions code-generated, etc.
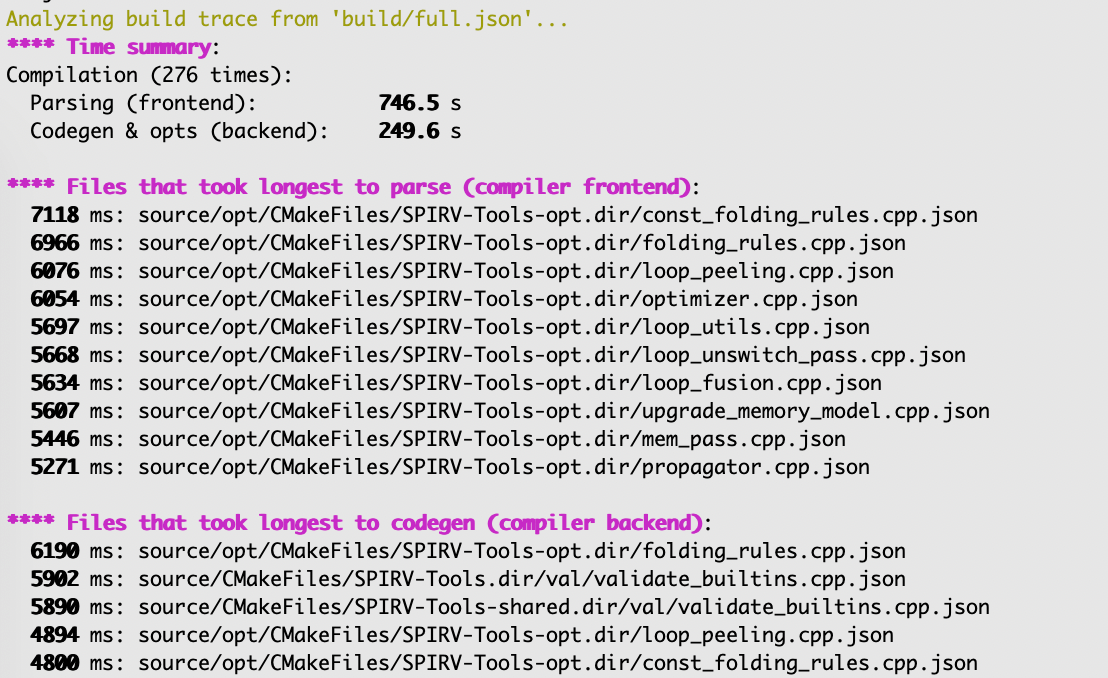
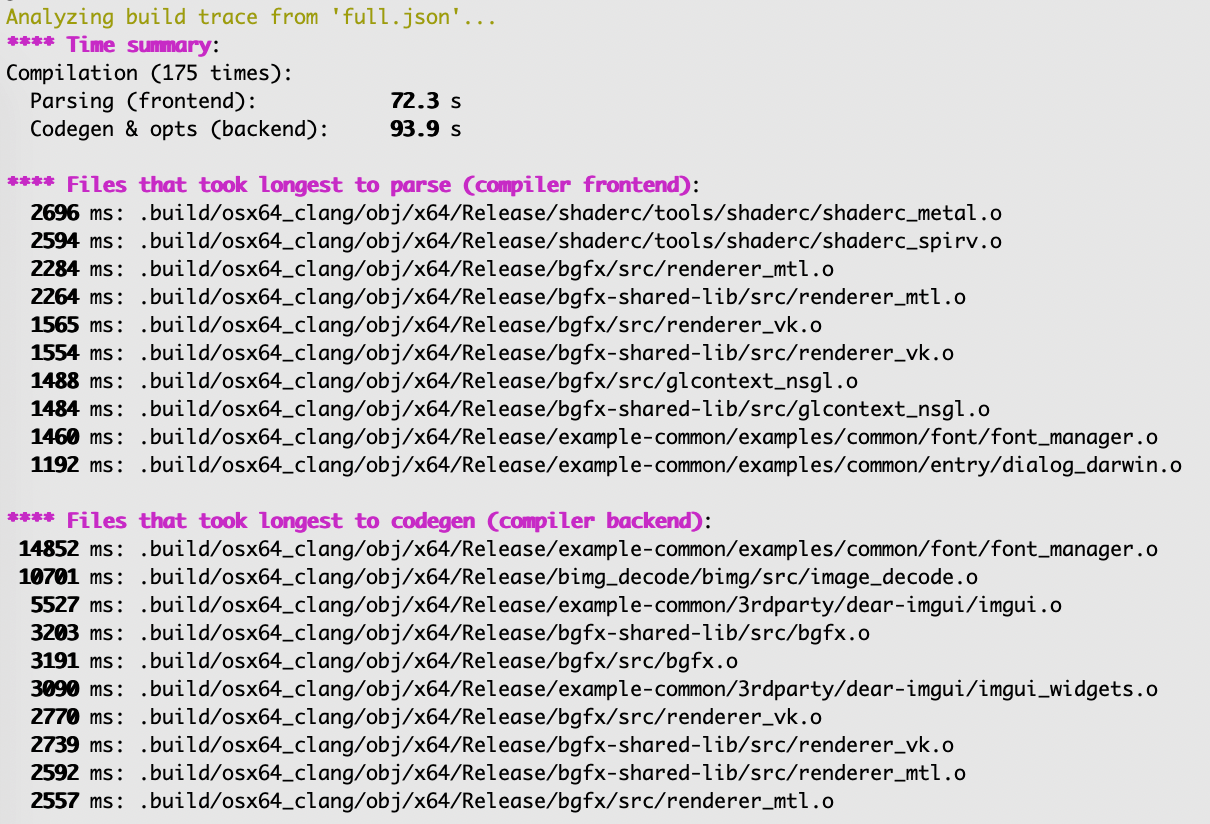
And then prints the slowest things, like this:
Analyzing build trace from 'artifacts/FullCapture.json'...
**** Time summary:
Compilation (1761 times):
  Parsing (frontend):         5167.4 s
  Codegen & opts (backend):   7576.5 s

**** Files that took longest to parse (compiler frontend):
 19524 ms: artifacts/Modules_TLS_0.o
 18046 ms: artifacts/Editor_Src_4.o
 17026 ms: artifacts/Modules_Audio_Public_1.o

**** Files that took longest to codegen (compiler backend):
145761 ms: artifacts/Modules_TLS_0.o
123048 ms: artifacts/Runtime_Core_Containers_1.o
 56975 ms: artifacts/Runtime_Testing_3.o

**** Templates that took longest to instantiate:
 19006 ms: std::__1::basic_string<char, std::__1::char_traits<char>, std::__1::... (2665 times, avg 7 ms)
 12821 ms: std::__1::map<core::basic_string<char, core::StringStorageDefault<ch... (250 times, avg 51 ms)
  9142 ms: std::__1::map<core::basic_string<char, core::StringStorageDefault<ch... (432 times, avg 21 ms)

**** Functions that took longest to compile:
  8710 ms: yyparse(glslang::TParseContext*) (External/ShaderCompilers/glslang/glslang/MachineIndependent/glslang_tab.cpp)
  4580 ms: LZ4HC_compress_generic_dictCtx (External/Compression/lz4/lz4hc_quarantined.c)
  4011 ms: sqlite3VdbeExec (External/sqlite/sqlite3.c)

*** Expensive headers:
136567 ms: /MacOSX10.14.sdk/System/Library/Frameworks/Foundation.framework/Headers/Foundation.h (included 92 times, avg 1484 ms), included via:
  CocoaObjectImages.o AppKit.h  (2033 ms)
  OSXNativeWebViewWindowHelper.o OSXNativeWebViewWindowHelper.h AppKit.h  (2007 ms)
  RenderSurfaceMetal.o RenderSurfaceMetal.h MetalSupport.h Metal.h MTLTypes.h  (2003 ms)

112344 ms: Runtime/BaseClasses/BaseObject.h (included 729 times, avg 154 ms), included via:
  PairTests.cpp TestFixtures.h  (337 ms)
  Stacktrace.cpp MonoManager.h GameManager.h EditorExtension.h  (312 ms)
  PlayerPrefs.o PlayerSettings.h GameManager.h EditorExtension.h  (301 ms)

103856 ms: Runtime/Threads/ReadWriteLock.h (included 478 times, avg 217 ms), included via:
  DownloadHandlerAssetBundle.cpp AssetBundleManager.h  (486 ms)
  LocalizationDatabase.cpp LocalizationDatabase.h LocalizationAsset.h StringTable.h  (439 ms)
  Runtime_BaseClasses_1.o MonoUtility.h ScriptingProfiler.h  (418 ms)
The actual output even has colors, imagine that!


Aaanyway. Maybe that will be useful for someone. Issue reports and pull requests welcome, and here’s the github repo again: github.com/aras-p/ClangBuildAnalyzer
That’s it!