Two years in a build team!
Whoa! Has it been two years already since I stopped doing graphics programming?!
How does one end up on a build team?
I switched to the “build system” team by having two extremely short chats:
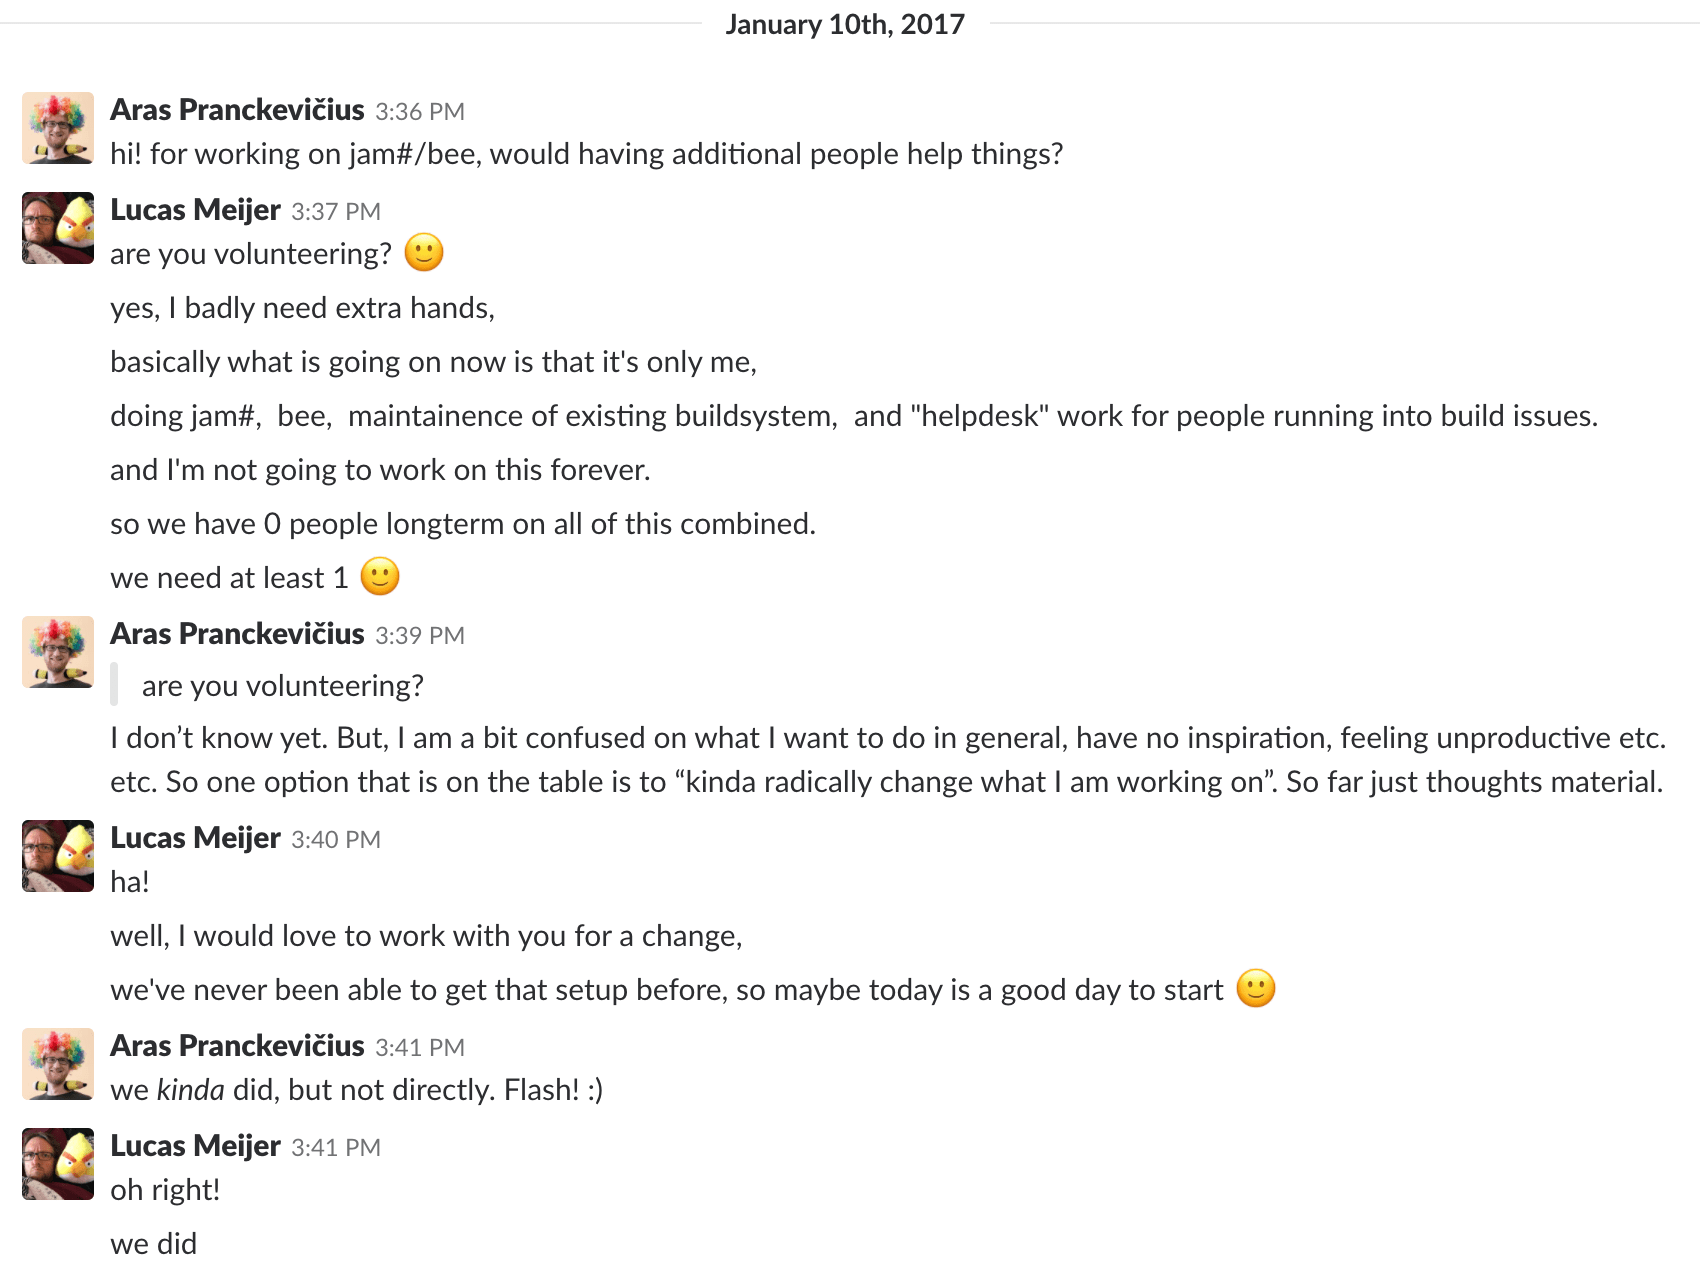
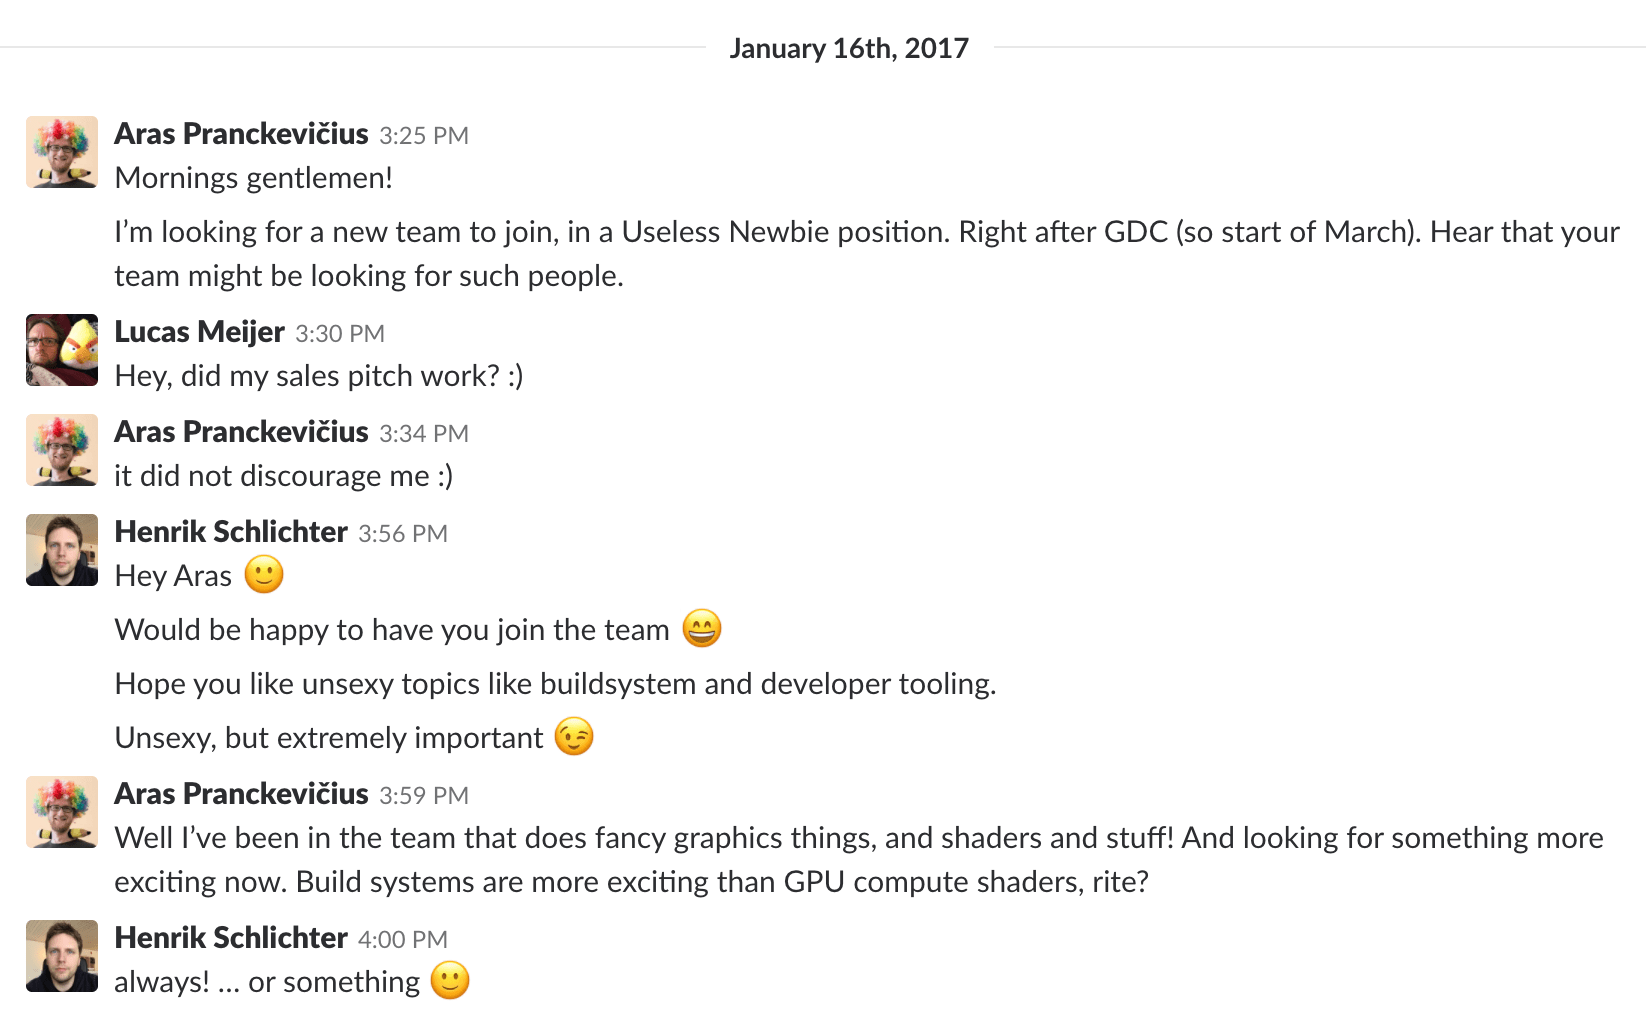
…and then a lot more chats with graphics people and some others of course; but the above “hey could I join? yes!” was kinda the whole of my “job interview” to the team.
And then I sent out a “goodbye graphics” email:
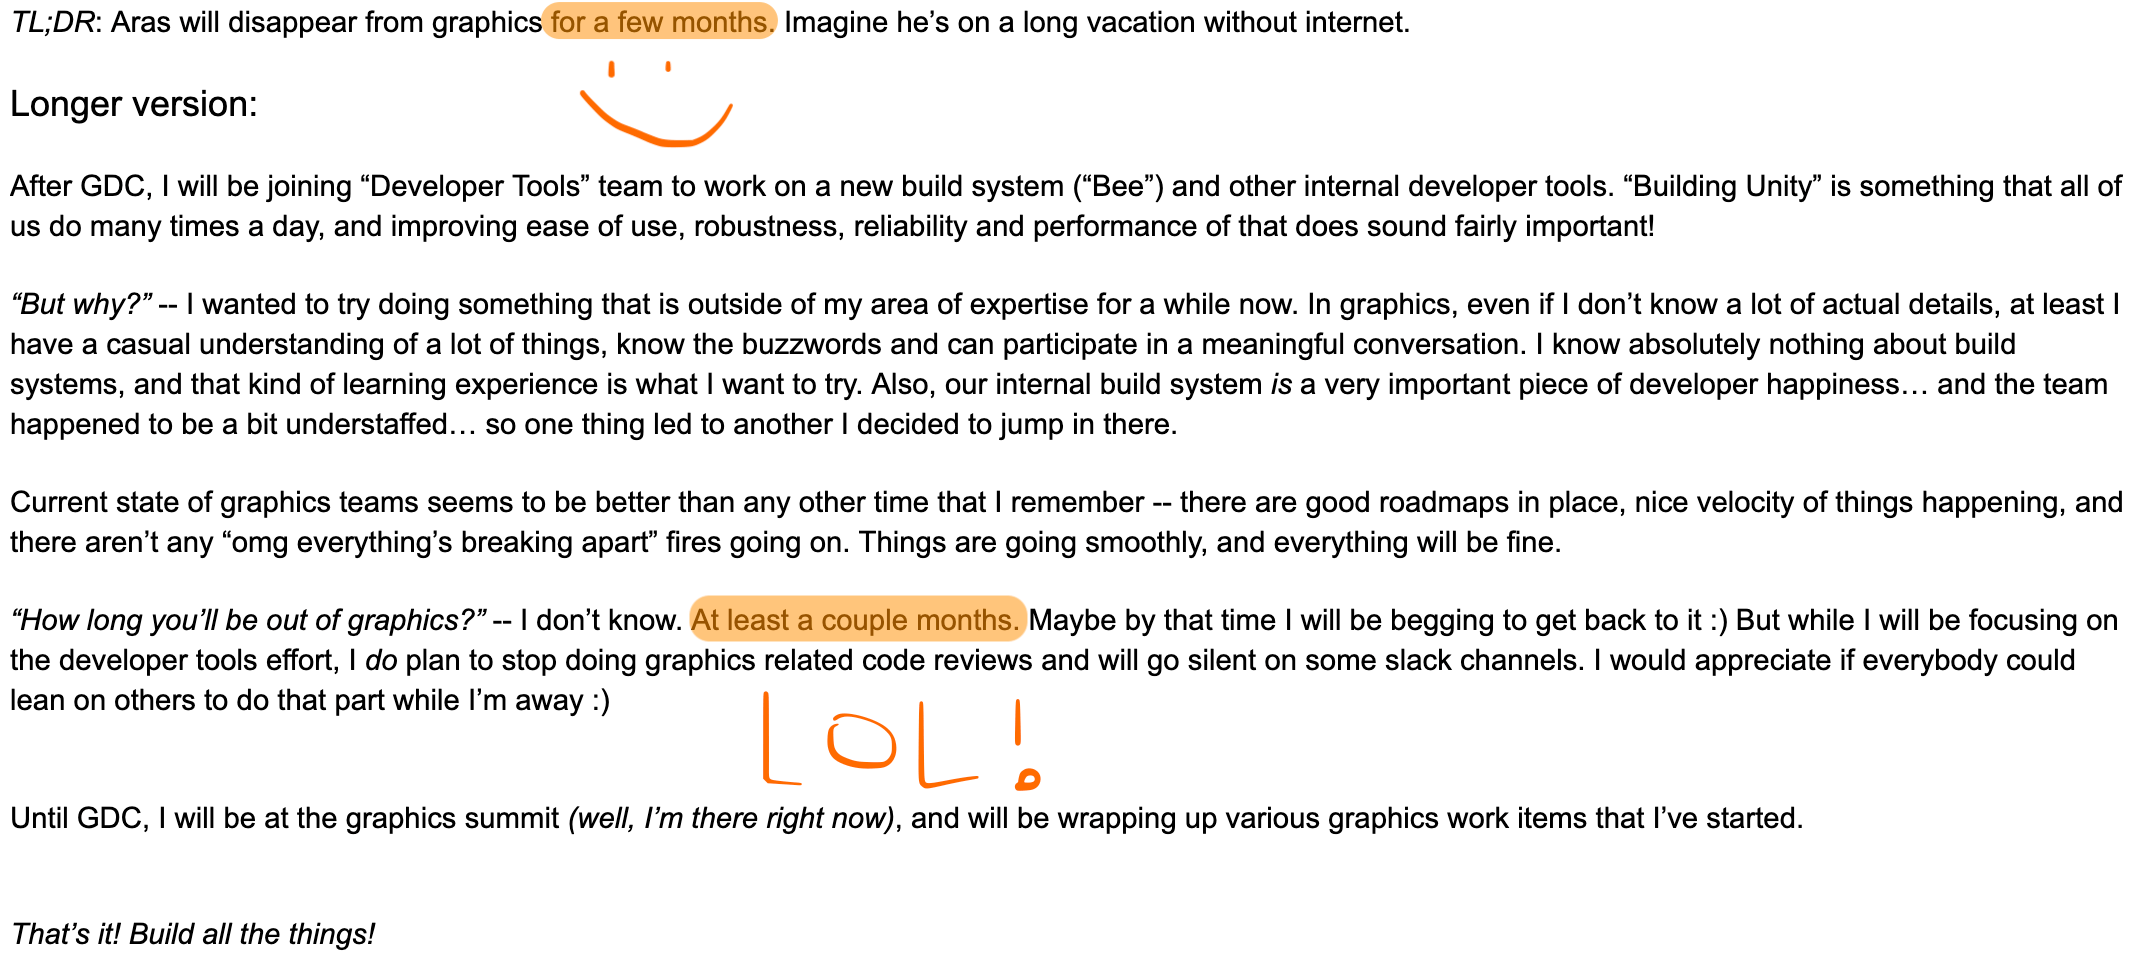
I actually had no idea for how long I’m leaving, so I wrote “a couple months”. Well look, it’s been two years already!
What does a build team do?
Most of my impressions I already wrote about (one week in, six months in).
A bunch of people have asked me either “ok so what is it that you actually do?”, or alternatively “surely the build work must be done by now?”. To which I don’t have an excellent answer. My own work is a combination of:
- Switching from “old build” (JamPlus) to “new build” (Bee/Tundra) while not disrupting the work of everyone around us.
- Speeding up builds by cleaning up dependencies, includes, removing code.
- Upgrading various platforms to more recent compiler versions; usually this is not hard but e.g. VS2010 -> VS2015 was pretty painful due to needed rebuilds of all 3rd party static libraries.
- Improving UX of various aspects of build process: cleaner logs, better diagnostic messages, more intuitive build command line arguments.
- Support for people who have any build issues.
- Fixing out various build issues that are accidentally introduced due to one reason or another. In a live codebase, it’s not like you can fix all issues and be done with it :)
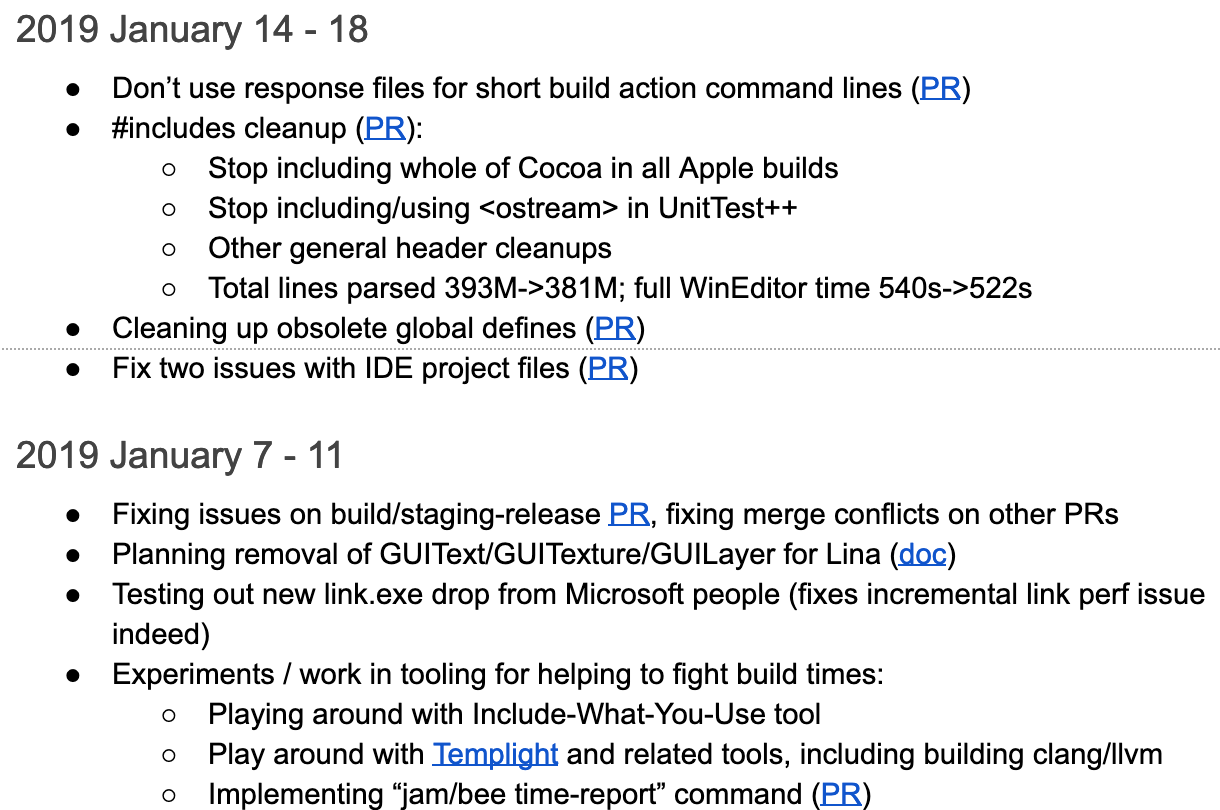
Typical work weeks might look like this – this is from my own “week logs” doc, took a screenshot of two recent ones:
And “what I did during last year” summary looks like this. I’ve highlighted buildsystem-related work in there; the rest is
“everything else”:
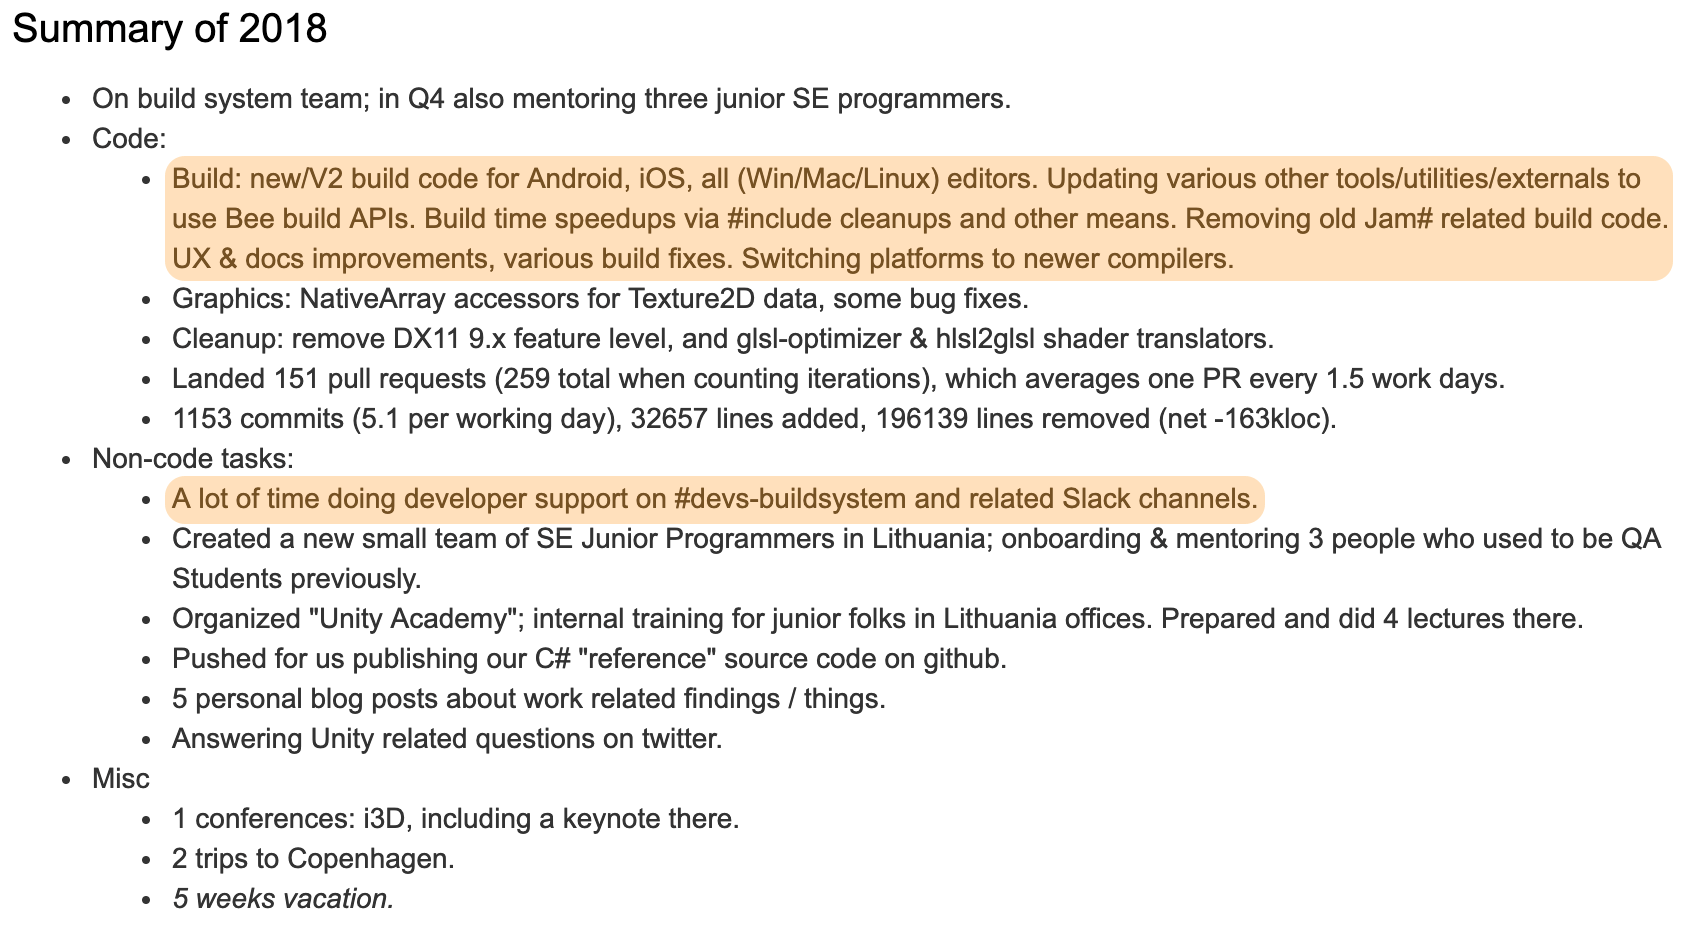
It doesn’t feel like “I got a lot done”, but doesn’t feel terrible either.
Anyway! Most of build stuff is fairly typical, but during last year our team has build some pretty neat tools that I wanted to write about. So here they are!
Neat Build Tools
In our main code repository the build entry point script is called
jam(it does not use Jam anymore, but backwards compat with what people are used to type…). In some of our new code repositories (for DOTS/ECS and some packages) the build entry point would be calledbee; both have the same tools, the examples below will be usingjamentry point.
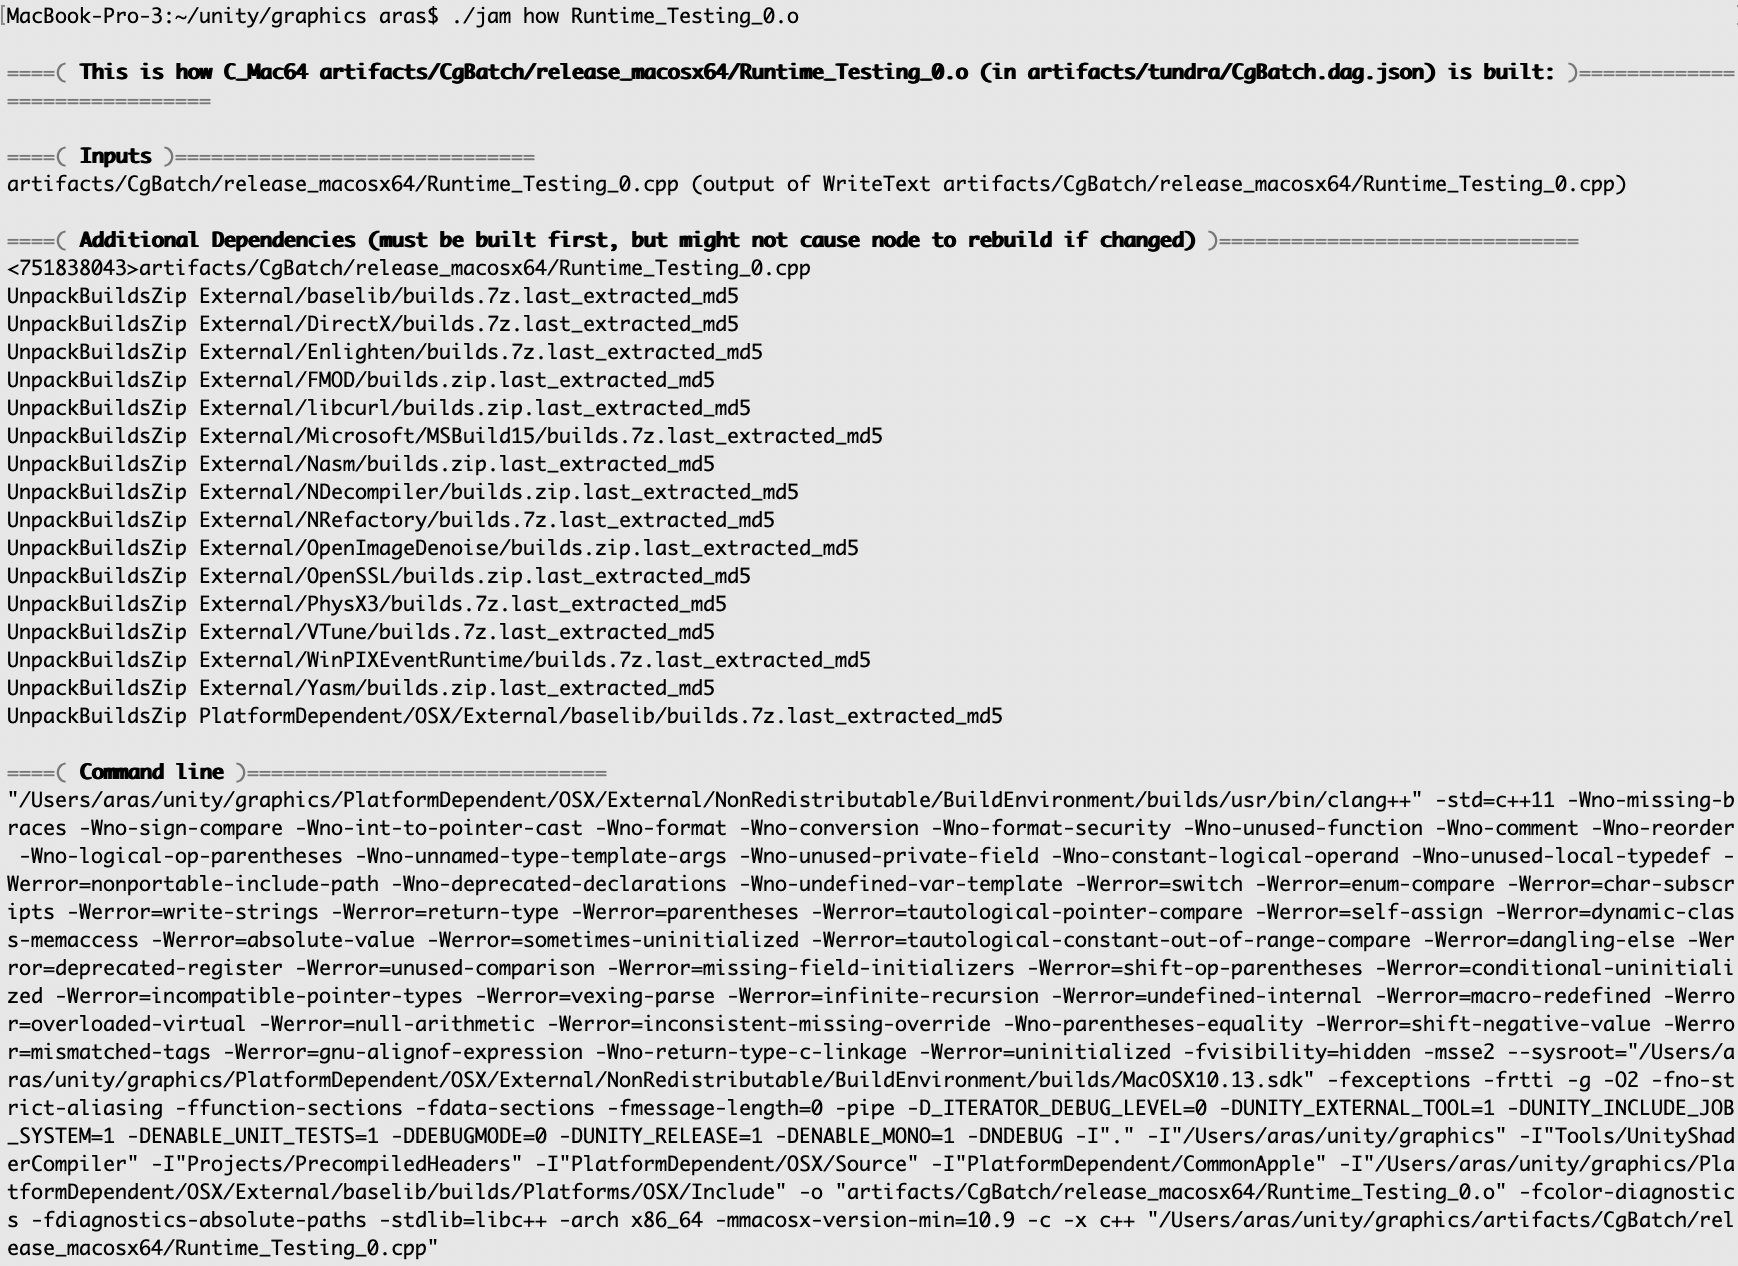
How exactly X is built?
jam how substring-of-something finds the most relevant build step (e.g. object file compile, executable link, file copy, whatever)
and tells exactly how it is built. This is mostly useful to figure out exact compiler command line flags, and dependencies.
Why X got rebuilt?
If one is wondering why something gets rebuilt (recompiled, re-copied, relinked, etc.), jam why substring-of-something tells that:
Every build produces a “log of what got done and why” file, and the why tool looks at that to do the report.
Where time was spent during the build?
I added Chrome Tracing profiler output support to both JamPlus and Tundra (see previous blog post),
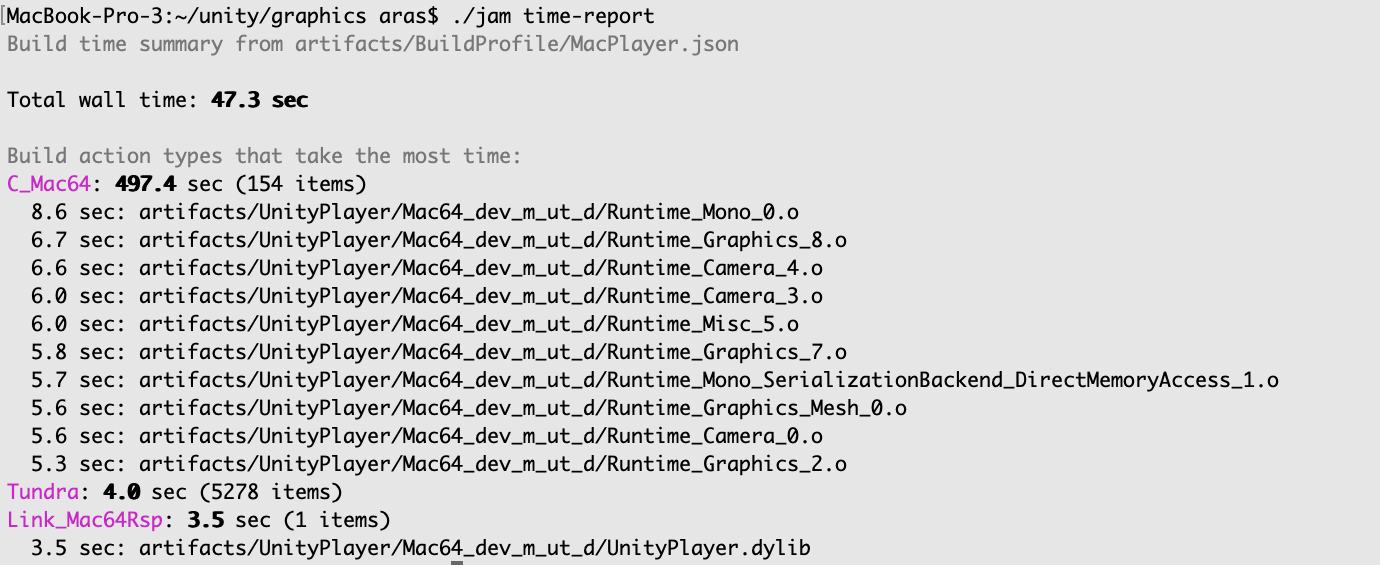
and while that is all good and nice, sometimes what you want is just a “very quick summary”. Enter jam time-report. It shows
top slowest action “types”, and top 10 items within each type:
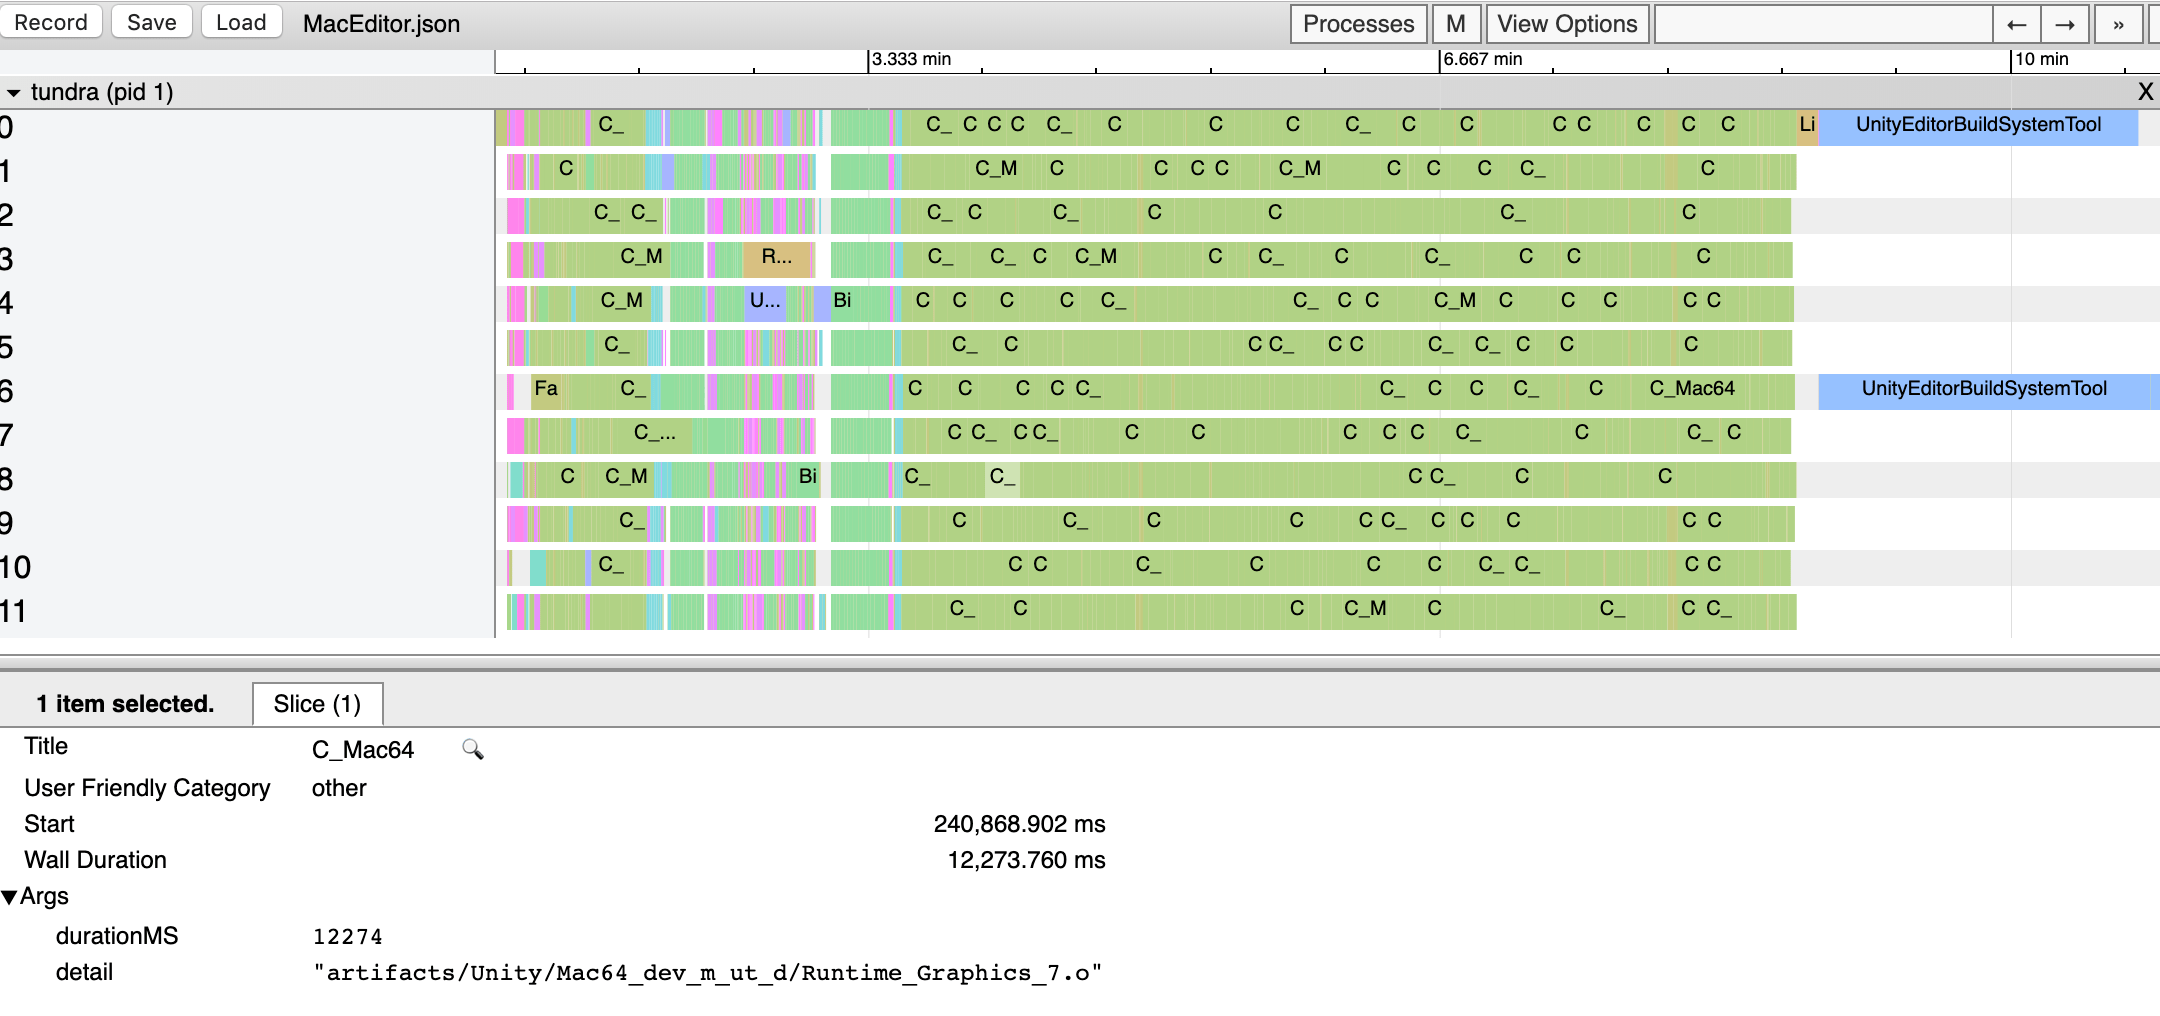
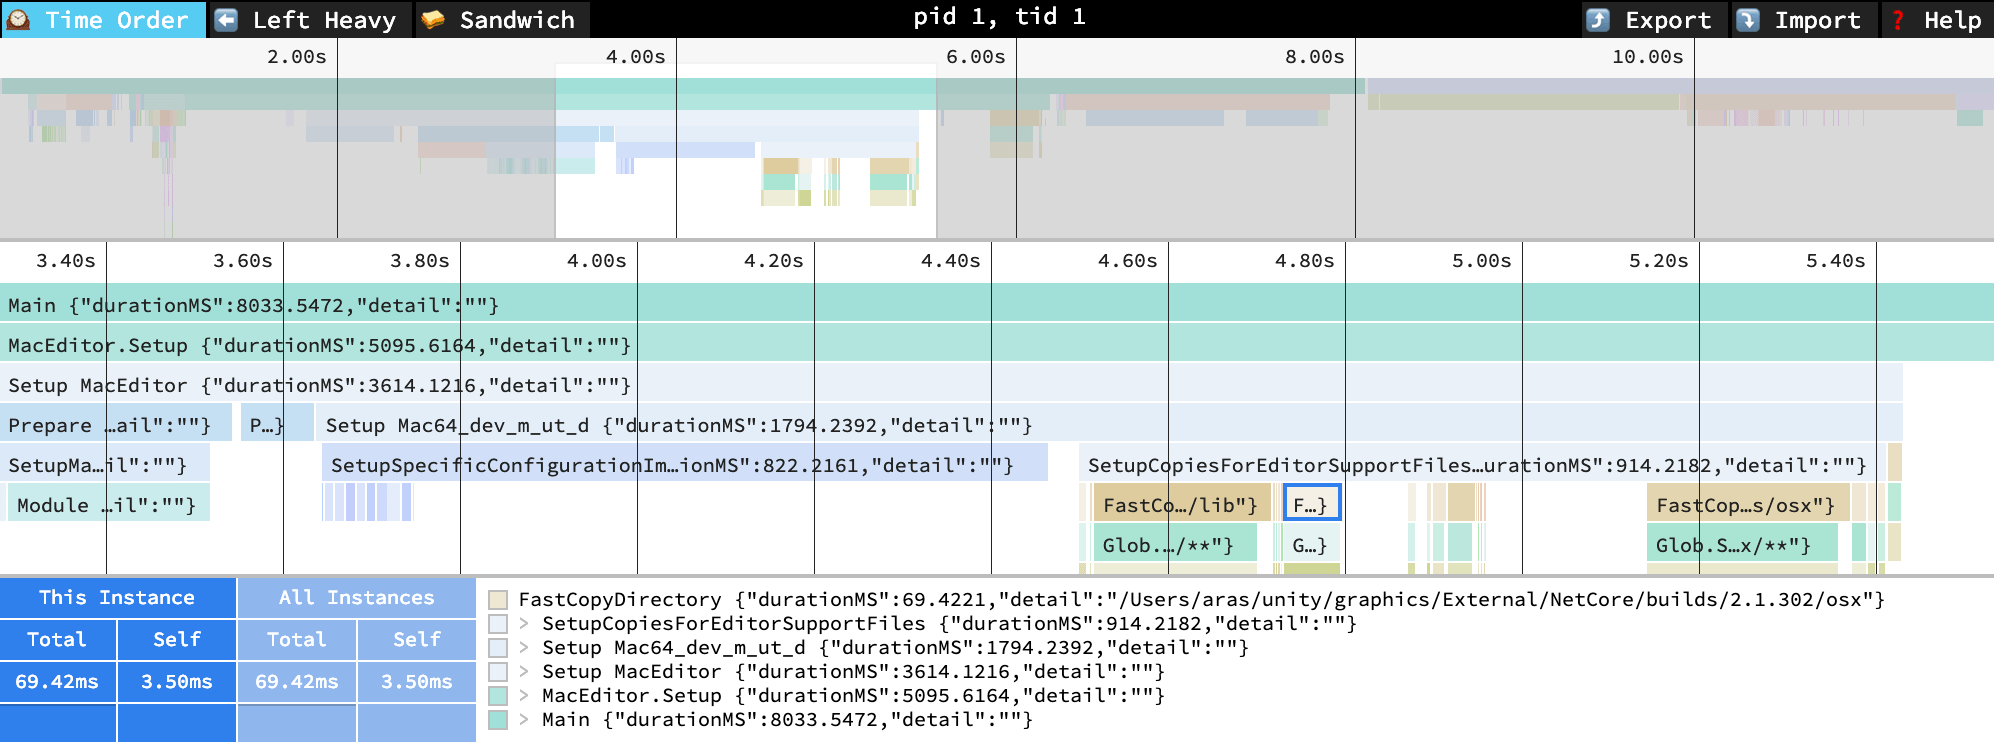
Of course if you want more detail, you can drag the profiler output file into chrome://tracing or speedscope.app
and browse it all:
What are the worst C/C++ header includes?
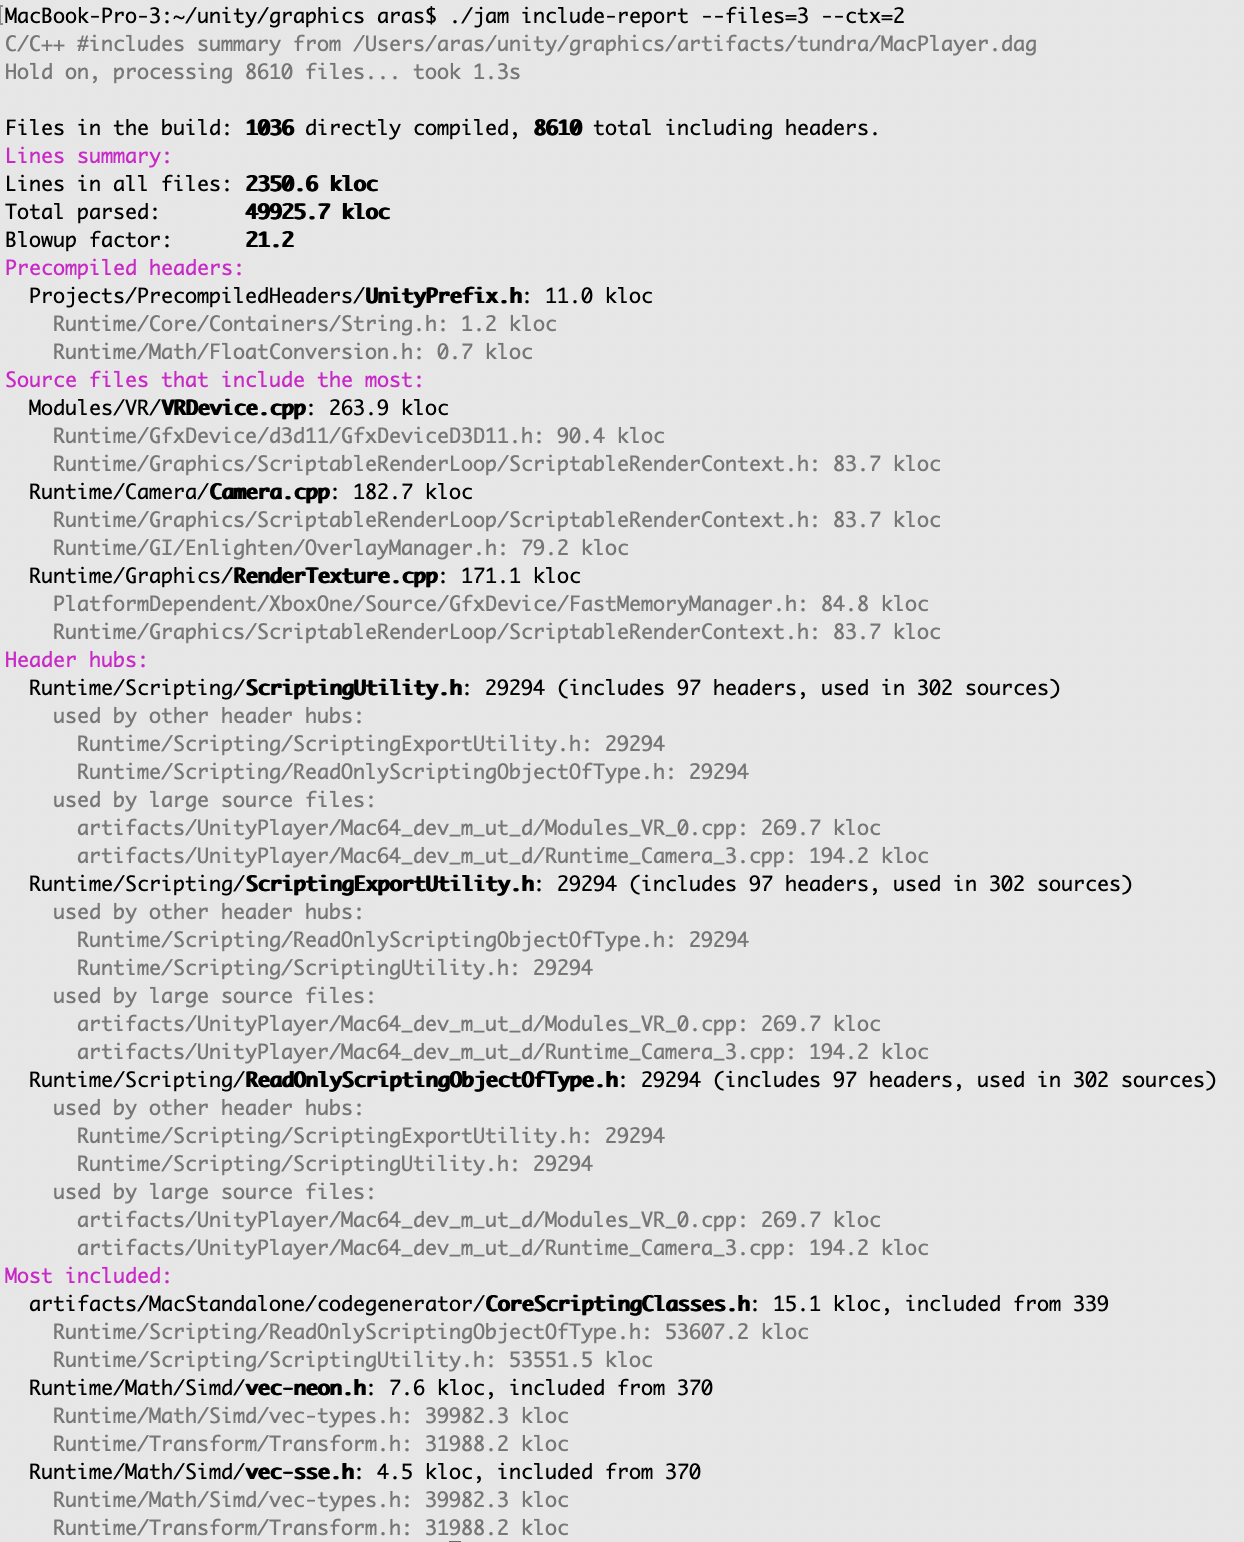
Since during the build Tundra scans source files for #include dependencies, we can use that to do some analysis / summary! jam include-report
shows various summaries of what might be worth untangling:
It is very similar to Header Hero that I used before for include optimization. But I wanted something that would see actual includes instead of the approximation that Header Hero does, and something that works on a Mac, and something that would be built-in in all our builds. So there!
This is all! I’ll get back to reviewing some pull requests now.
