Chrome Tracing as Profiler Frontend
Did you know that Google Chrome has a built-in profiler? Some people assume it’s only for profiling “web stuff” like JavaScript execution. But it can also be used as a really nice frontend for your own profiling data.
Colt McAnlis actually wrote about using it for game profiling, in 2012: Using Chrome://tracing to view your inline profiling data. Everything written there still stands, and I’m mostly going to repeat the same things. Just to make this Chrome Tracing thing more widely known :)
Backstory
For a part of our code build system, we have a super simple profiler (called TinyProfiler) that captures scoped sections
of the code and measures time spent in them. It was producing a simple HTML+SVG “report file” with a flame graph style visualization:
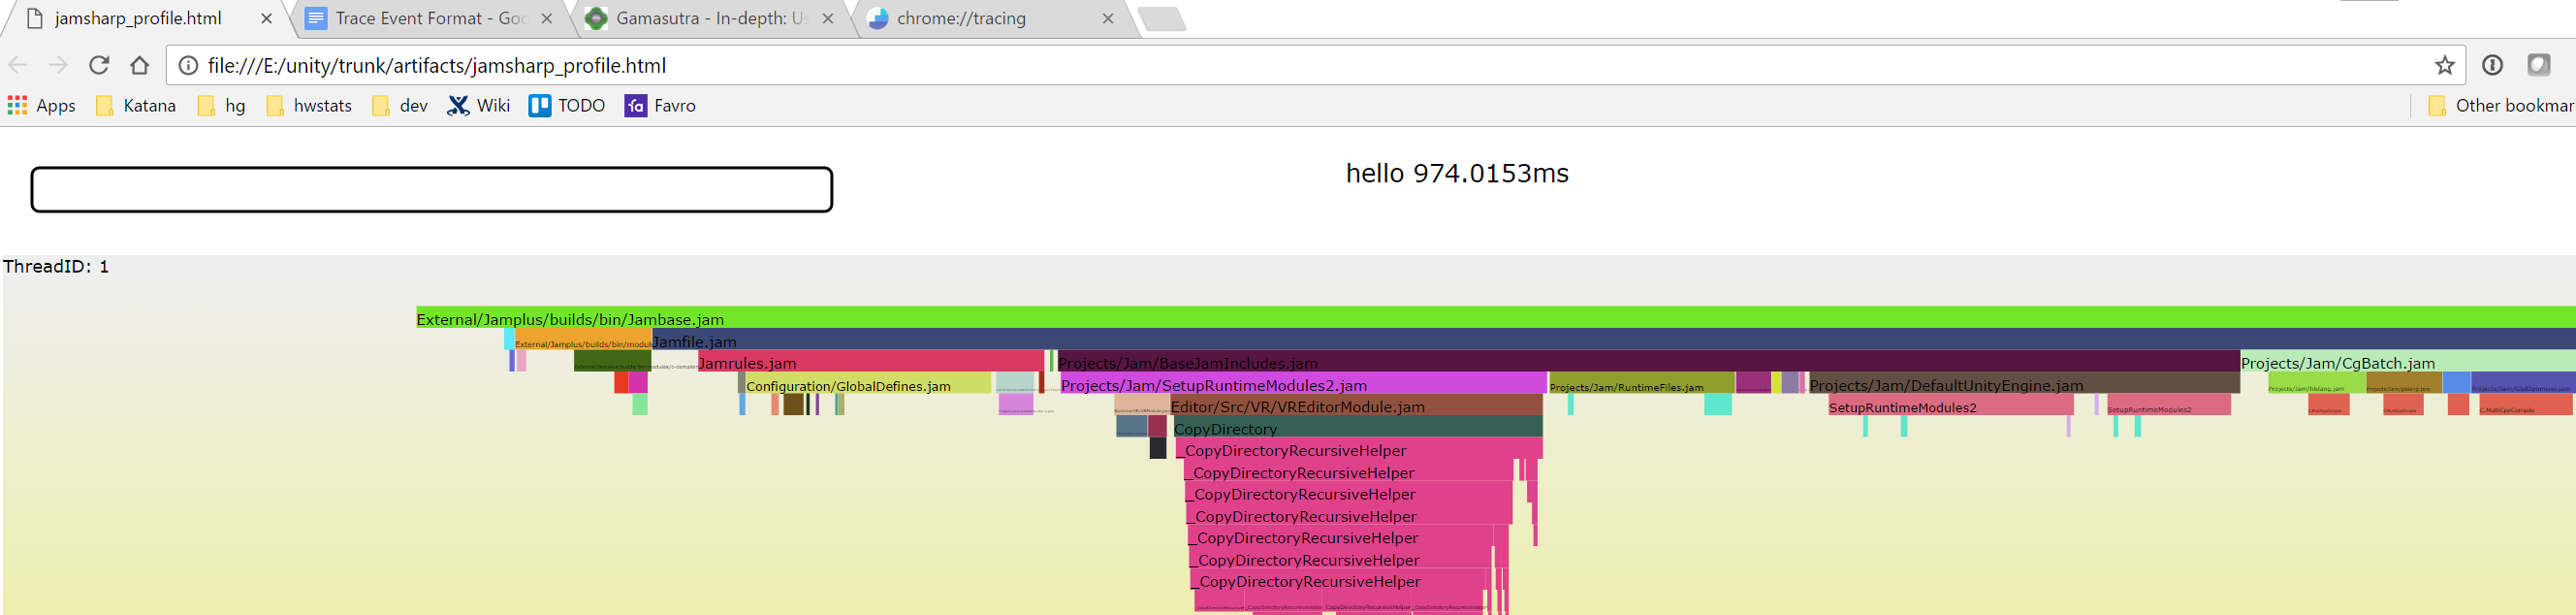
This gets the job done, but the resulting HTML is not very interactive. You can hover over things and have their time show up in the text box. But no real zooming, panning, search filtering or other niceties that one could expect from a decent profiler frontend UI.
All these things could be implemented… but also, why do that when someone else (Chrome) already wrote a really nice profiler UI?
Using Chrome Tracing
All that is needed to do to use Chrome Tracing view is:
- Produce a JSON file with the format expected by Chrome,
- Go to
chrome://tracingin Chrome, - Click “Load” and open your file, or alternatively drag the file into Chrome,
- Profit!
The final result looks pretty similar to our custom HTML+SVG thing, as Chrome is also visualizing the profiling data in the flame graph style:
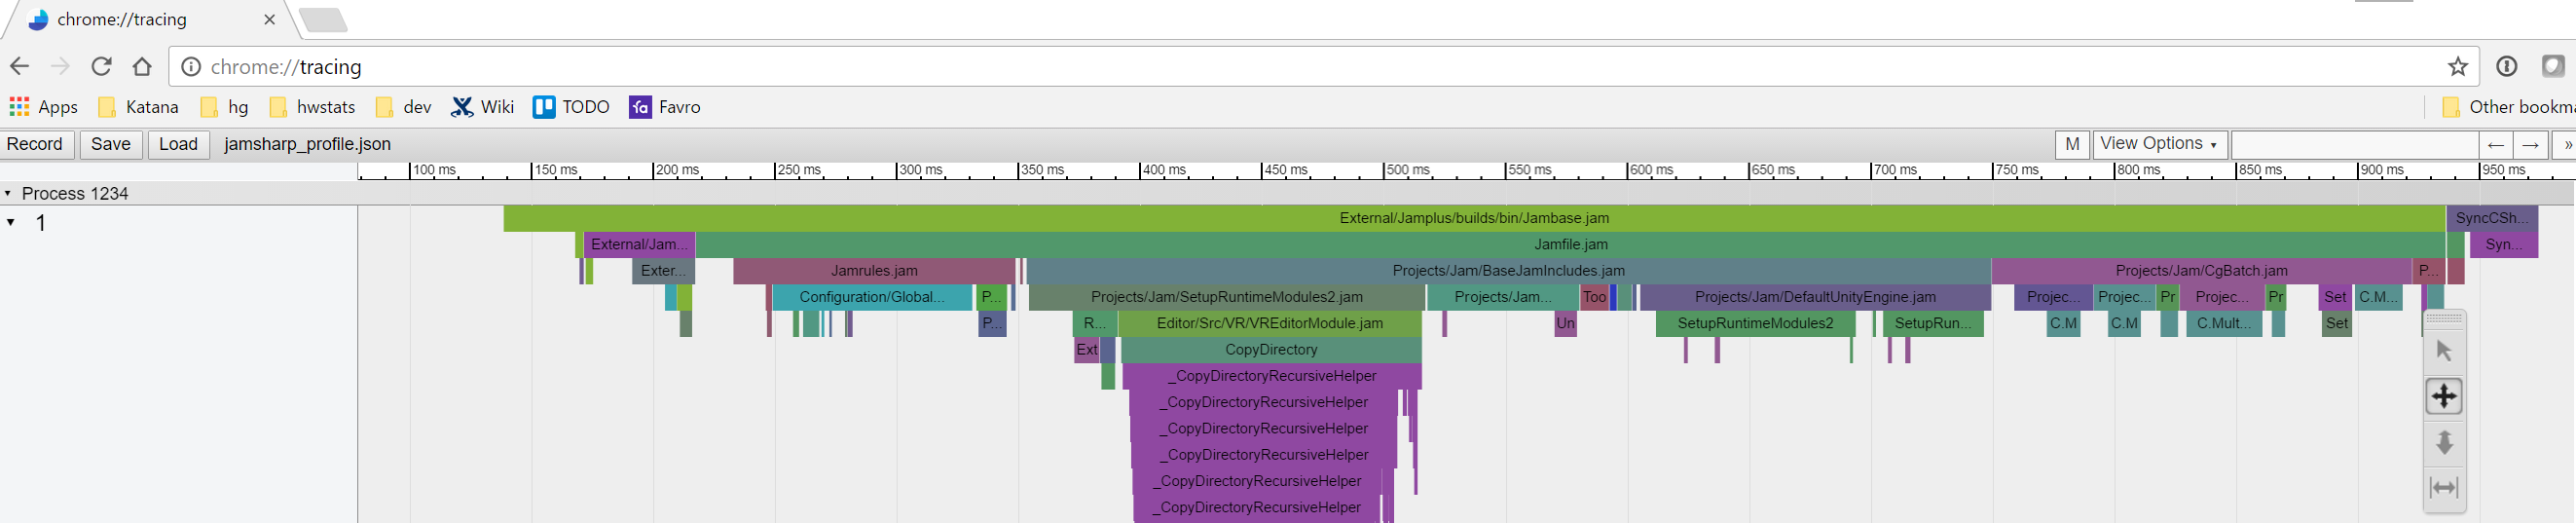
Advantages of doing this:
- Much better profiling UI: zooming, panning, filtering, statistics, and so on.
- We no longer need to write profiler UI frontend (no matter how simple) ourselves.
- 500 lines of code less than what we had before (writing out the JSON file is much simpler than the SVG file).
And some potential disadvantages:
- No easy way to “double click report file to open it” as far as I can see. Chrome does not have any command line or automated interface
to open itself, go to tracing view, and load a file all in one go. So you have to manually do that, which is more clicks.
- This could be improved by producing HTML file with everything needed, by using
trace2htmltool from the Chrome Tracing repository. However, that whole repository is ~1GB in size (it has way more stuff in it than just tracing UI), and I’m not too keen on adding a gigabyte of external dependency just for this. Maybe it would be possible to produce a “slimmed down, just the trace2html bits” version of that repository.
- This could be improved by producing HTML file with everything needed, by using
- Added dependency on 3rd party profiling frontend. However:
- It seems to be fairly stable (everything from Colin’s article in 2012 still works in 2017),
- The frontend is open source: catapult-project at github,
- Other people, e.g. Facebook’s Buck build system are also using it.
My take is that the advantages outweigh the disadvantages.
JSON file format
Trace Event Format is really nicely documented, so see there for details on more advanced usage. Basic structure of the JSON file is as follows:
{
"traceEvents": [
{ "pid":1, "tid":1, "ts":87705, "dur":956189, "ph":"X", "name":"Jambase", "args":{ "ms":956.2 } },
{ "pid":1, "tid":1, "ts":128154, "dur":75867, "ph":"X", "name":"SyncTargets", "args":{ "ms":75.9 } },
{ "pid":1, "tid":1, "ts":546867, "dur":121564, "ph":"X", "name":"DoThings", "args":{ "ms":121.6 } }
],
"meta_user": "aras",
"meta_cpu_count": "8"
}
traceEvents are the events that show up in the UI. Anything that is not recognized by the event format is treated as “metadata”
that is shown by the UI metadata dialog (in this case, meta_user and meta_cpu_count are metadata). The JSON above looks like
this in the Chrome Tracing UI:
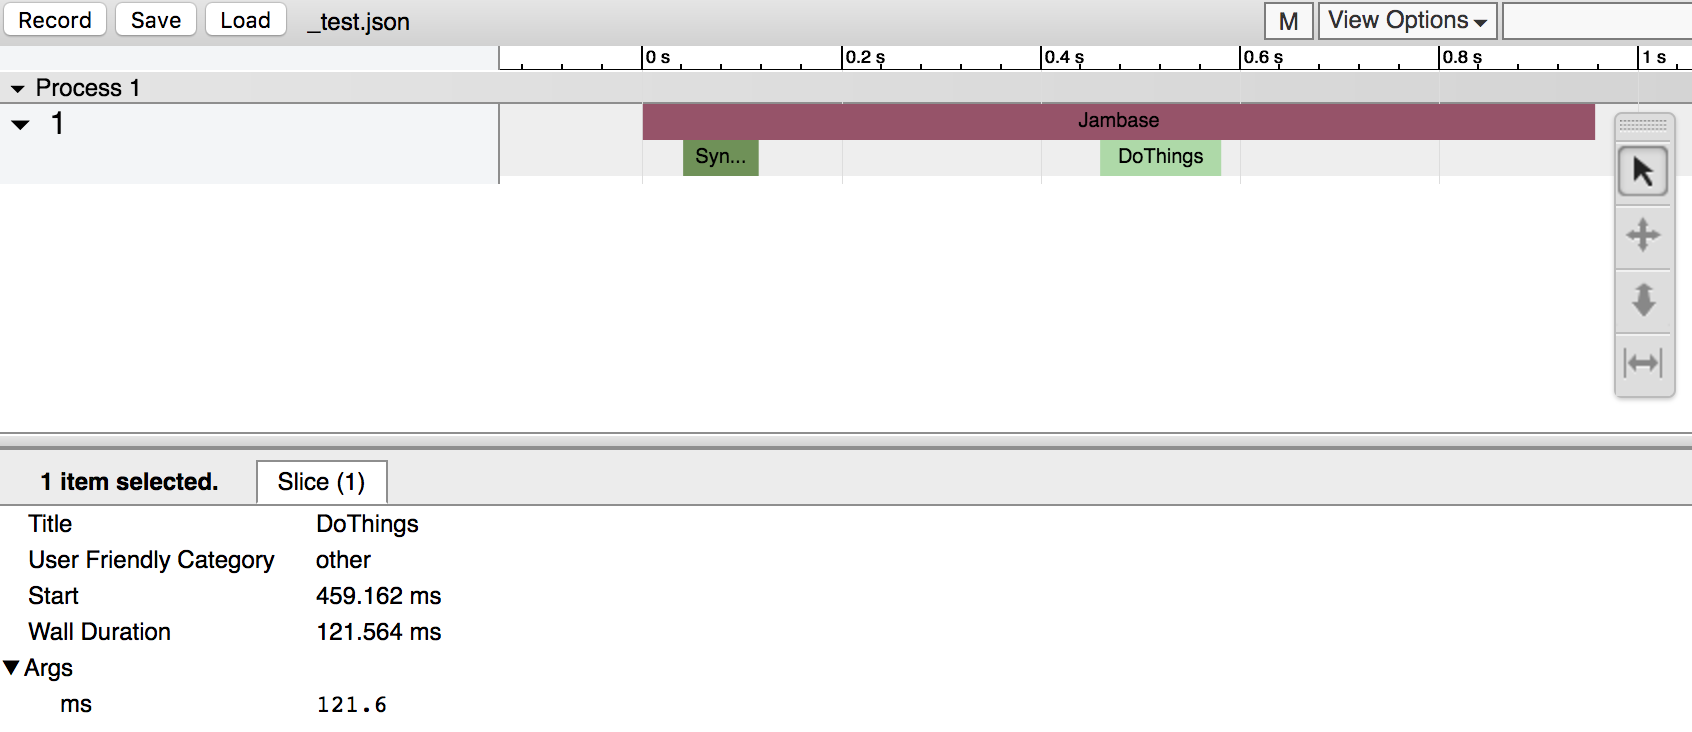
Events described in it are the simplest ones, called “Complete Events” (indicated by ph:X). They need a timestamp and duration given
in microseconds (ts and dur). The other fields are process ID and thread ID (pid and tid), and a name to display.
There’s no need to indicate parent-child relationships between the events; the UI automatically figures that out based on event timings.
Events can also have custom data attached to them (args), which is displayed in the lower pane when an event is selected. One gotcha
is that there has to be some custom data in order for the event to be selectable at all. So at least put some dummy data in there.
And basically that’s it for a super simple usage. Check out Trace Event Format for more advanced event types and usage. Happy profiling!