Curious Case of Slow Texture Importing, and xperf
I was looking at a curious bug report: “Texture importing got much slower in current beta”. At first look, I dismissed it under “eh, someone’s being confused” (quickly tried on several textures, did not notice any regression). But then I got a proper bug report with several textures. One of them was importing about 10 times slower than it used to be.
Why would anyone make texture importing that much slower? No one would, of course. Turns out, this was an unintended consequence of generally improving things.
But, the bug report made me use xperf (a.k.a. Windows Performance Toolkit) for the first
time. Believe it or not, I’ve never used it before!
So here’s the story
We’ve got a TGA texture (2048x2048, uncompressed - a 12MB file) that takes about 10 seconds to import in current beta build, but it took ~1 second on Unity 4.6.
First wild guess: did someone accidentally disable multithreaded texture compression? Nope, doesn’t look like it (making final texture be uncompressed still shows massive regression).
Second guess: we are using FreeImage library to import textures. Maybe someone, I dunno, updated it and comitted a debug build? Nope, last change to our build was done many moons ago.
Time to profile. My quick “I need to get some answer in 5 seconds” profiler on Windows is Very Sleepy, so let’s look at that:

Wait what? All the time is spent in WinAPI ReadFile function?!
Is there something special about the TGA file I’m testing on? Let’s make the same sized, uncompressed PNG image (so file size comes out the same).

The PNG imports in 108ms, while TGA in 9800ms (I’ve turned off DXT compression, to focus on raw import time). In Unity 4.6 the same work is done 116ms (PNG) and 310ms (TGA). File sizes roughly the same. WAT!
Enter xperf
Asked a coworker who knows something about Windows: “why would reading one file spend all time in ReadFile, but another file of same size read much faster?”, and he said “look with xperf”.
I’ve read about xperf at the excellent Bruce Dawson’s blog, but never tried it myself. Before today, that is.
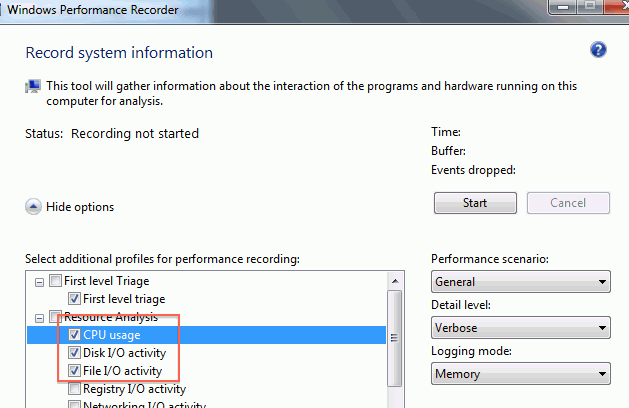
So, launch Windows Performance Recorder (I don’t even know if it comes with some VS or Windows SDK version or needs to be installed separately… it was on my machine somehow), tick CPU and disk/file I/O and click Start:
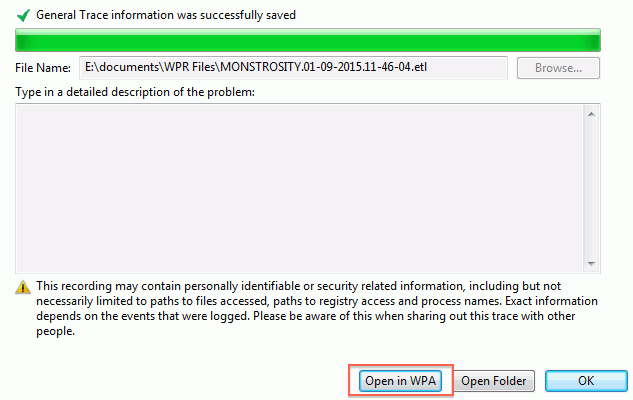
Do texture importing in Unity, click save, and on this fairly confusing screen click “Open in WPA”:
The overview in the sidebar gives usage graphs of our stuff. A curious thing: neither CPU (Computation) nor Storage graphs show intense activity? The plot thickens!
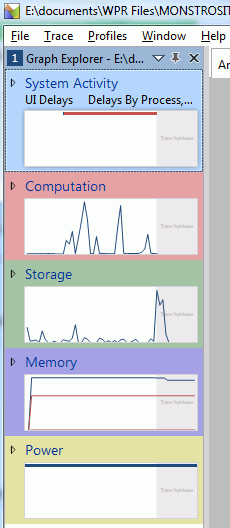
CPU usage investigation
Double clicking the Computation graph shows timeline of CPU usage, with graphs for each process. We can see Unity.exe taking up some CPU during a time period, which the UI nicely highlights for us.

Next thing is, we want to know what is using the CPU. Now, the UI groups things by the columns on the left side of the yellow divider, and displays details for them on the right side of it. We’re interested in a callstack now, so context-click on the left side of the divider, and pick “Stack”:
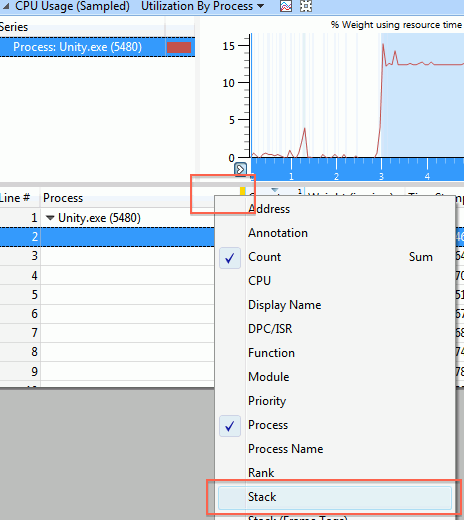
Oh right, to get any useful stacks we’ll need to tell xperf to load the symbols. So you go
Trace -> Configure Symbol Paths, add Unity folder there, and then Trace -> Load Symbols.
And then you wait. And wait some more…
And then you get the callstacks! Not quite sure what the “n/a” entry is; my best guess that just represents unused CPU cores or sleeping threads or something like that.
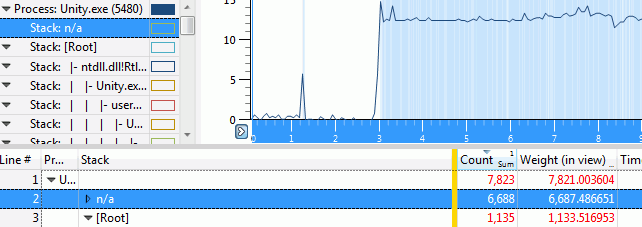
Digging into the other call stack, we see that indeed, all the time is spent in ReadFile.
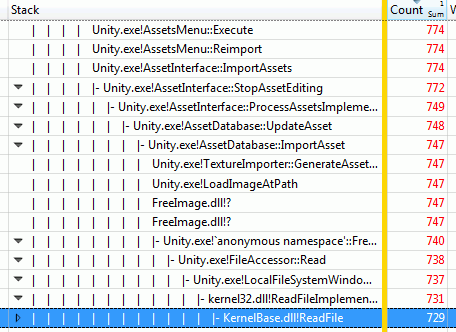
Ok, so that was not terribly useful; we already knew that from the Very Sleepy profiling session.
Let’s look at I/O usage
Remember the “Storage” graph on sidebar that wasn’t showing much activity? Turns out, you can expand it into more graphs.
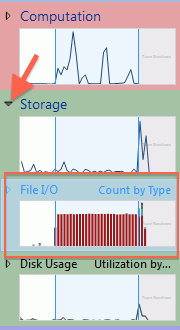
Now we’re getting somewhere! The “File I/O” overview graph shows massive amounts of activity, when we were importing our TGA file. Just need to figure out what’s going on there. Double clicking on that graph in the sidebar gives I/O details:
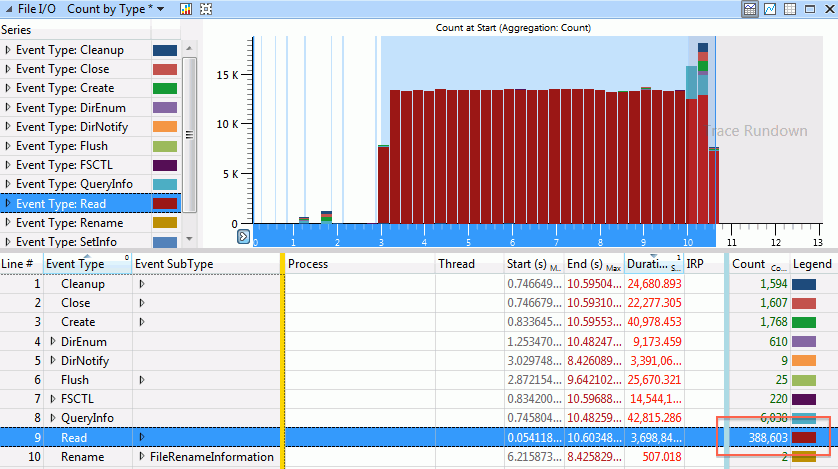
You can probably see where this is going now. We have a lot of file reads, in fact almost 400 thousand of them. That sounds a bit excessive.
Just like in the CPU part, the UI sorts on columns to the left of the yellow divider. Let’s drag the “Process” column to the left; this shows that all these reads are coming from Unity indeed.
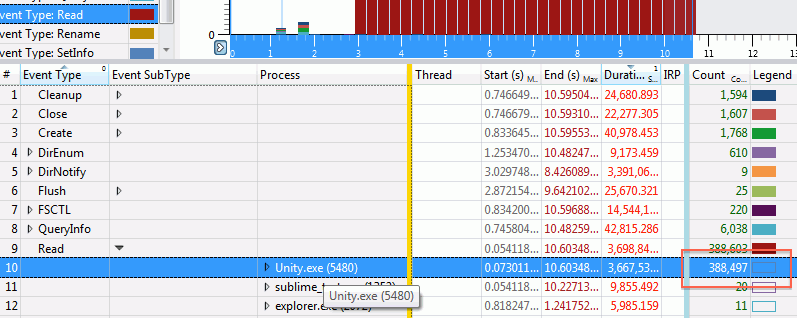
Expanding the actual events reveals the culprit:

We are reading the file alright. 3 bytes at a time.
But why and how?
But why are we reading a 12 megabyte TGA file in three-byte chunks? No one updated our image reading library in a long time, so how come things have regressed?
Found the place in code where we’re calling into FreeImage. Looks like we’re setting up our own I/O routines and telling FreeImage to use them:
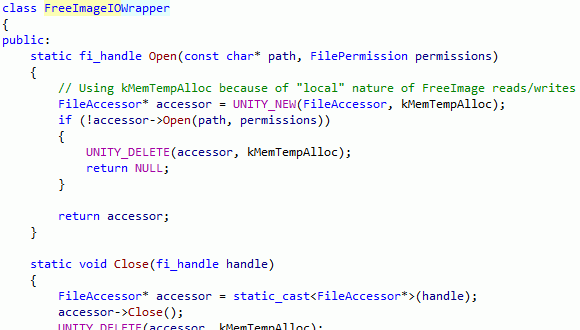
Version control history check: indeed, a few weeks ago a change in that code was made, that switched from basically “hey, load an image from this file path” to “hey, load an image using these I/O callbacks”…
This generally makes sense. If we have our own file system functions, it makes sense to use them. That way we can support reading from some non-plain-files (e.g. archives, or compressed files), etc. In this particular case, the change was done to support LZ4 compression in lightmap cache (FreeImage would need to import texture files without knowing that they have LZ4 compression done on top of them).
So all that is good. Except when that changes things to have wildly different performance characteristics, that is.
When you don’t pass file I/O routines to FreeImage, then it uses a “default set”, which is just C stdio ones:

Now, C stdio routines do I/O buffering by default… our I/O routines do not. And FreeImage’s TGA loader does a very large number of one-pixel reads.
To be fair, the “read TGA one pixel at a time” seems to be fixed in upstream FreeImage these days; we’re just using a quite old version. So looking at this bug made me realize how old our version of FreeImage is, and make a note to upgrade it at some point. But not today.
The Fix
So, a proper fix here would be to setup buffered I/O routines for FreeImage to use. Turns out we don’t have any of them at the moment. They aren’t terribly hard to do; I poked the relevant folks to do them.
In the meantime, to check if that was really the culprit, and to not have “well TGAs import much slower”, I just made a hotfix that reads whole image into memory, and then loads from that.
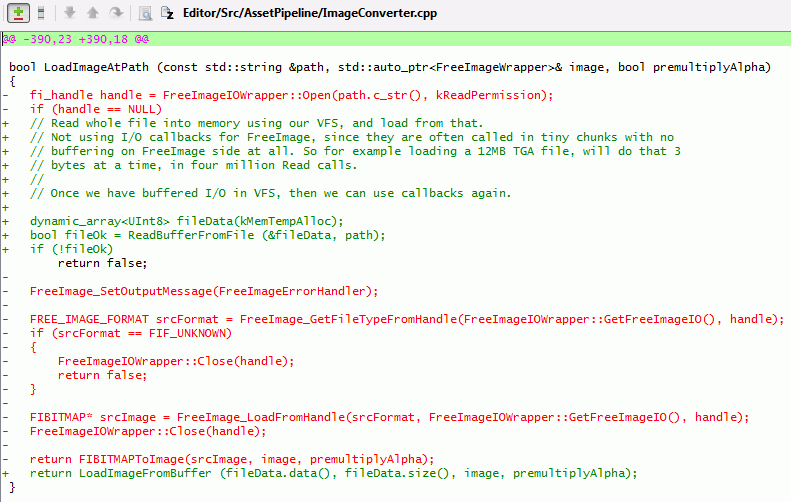
Is it okay to read whole image into memory buffer? Depends. I’d guess in 95% cases it is okay, especially now that Unity editor is 64 bit. Uncompressed data for majority of images will end up being much larger than the file size anyway. Probably the only exception could be .PSD files, where they could have a lot of layers, but we’re only interested in reading the “composited image” file section. So yeah, that’s why I said “hotfix”; and a proper solution would be having buffered I/O routines, and/or upgrading FreeImage.
This actually made TGA and PNG importing faster than before: 75ms for TGA, 87ms for PNG (Unity 4.6: 310ms TGA, 116ms PNG; current beta before the fix: 9800ms TGA, 108ms PNG).
Yay.
Conclusion
Be careful when replacing built-in functionality of something with your own implementation (e.g. standard I/O or memory allocation or logging or … routines of some library). They might have different performance characteristics!
xperf on Windows is very useful! Go and read Bruce Dawson’s blog for way more details.
On Mac, Apple’s Instruments is a similar tool. I think I’ll use that in some next blog entry.
I probably should have guessed that “too many, too small file read calls” is the actual cause after two minutes of looking into the issue. I don’t have a good excuse on why I did not. Oh well, next time I’ll know :)