Divide and Conquer Debugging
It should not be news to anyone that ability to narrow down a problem while debugging is an incredibly useful skill. Yet from time to time, I see people just helplessly randomly stumbling around, when they are trying to debug something. So with this in mind (and also “less tweeting, more blogging!” in mind for 2015), here’s a practical story.
This happened at work yesterday, and is just an ordinary bug investigation. It’s not some complex bug, and investigation was very short - all of it took less time than writing this blog post.
Bug report
We’re adding iOS Metal support to Unity 4.6.x, and one of the beta testers reported this: “iOS Metal renders submeshes incorrectly”. There was a nice project attached that shows the issue very clearly. He has some meshes with multiple materials on them, and the 2nd material parts are displayed in the wrong position.
The scene looks like this in the Unity editor:

But when ran on iOS device, it looks like this:

Not good! Well, at least the bug report is very nice :)
Initial guesses
Since the problematic parts are the second material on each object, and it only happens on the device, then the user’s “iOS Metal renders submeshes incorrectly” guess makes perfect sense (spoiler alert: the problem was elsewhere).
Ok, so what is different between editor (where everything works) and device (where it’s broken)?
- Metal: device is running Metal, whereas editor is running OpenGL.
- CPU: device is running on ARM, editor running on Intel.
- Need to check which shaders are used on these objects; maybe they are something crazy that results in differences.
Some other exotic things might be different, but first let’s take the above.
Initial Cuts
Run the scene on the device using OpenGL ES 2.0 instead. Ha! The issue is still there. Which means Metal is not the culprit at all!
Run it using a slightly older stable Unity version (4.6.1). The issue is not there. Which means it’s some regression somewhere since Unity 4.6.1 and the code we’re based on now. Thankfully that’s only a couple weeks of commits.
We just need to find what regressed, when and why.
Digging Deeper
Let’s look at the frame on the device, using Xcode frame capture.
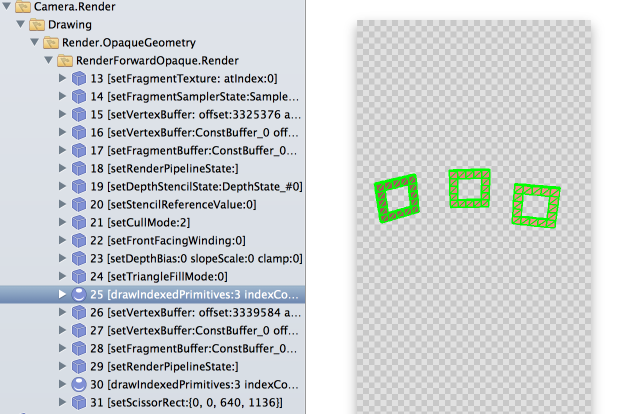
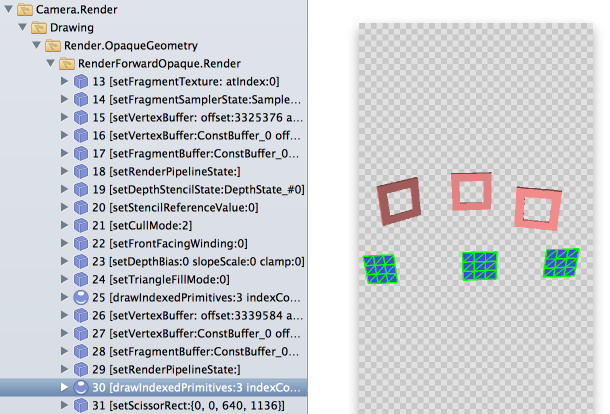
Hmm. We see that the scene is rendered in two draw calls (whereas it’s really six sub-objects), via Unity’s dynamic batching.
Dynamic batching is a CPU-side optimization we have where small objects using identical rendering state are transformed into world space on the CPU, into a dynamic geometry buffer, and rendered in a single draw call. So this spends some CPU time to transform the vertices, but saves some time on the API/driver side. For very small objects (sprites etc.) this tends to be a win.
Actually, I could have seen that it’s two draw calls in the editor directly, but it did not occur to me to look for that.
Let’s check what happens if we explicitly disable dynamic batching. Ha! The issue is gone.
So by now, what we know is: it’s some recent regression in dynamic batching, that happens on iOS device but not in the editor; and is not Metal related at all.
But it’s not that “all dynamic batching got broken”, because:
- Half of the bug scene (the pink objects) are dynamic-batched, and they render correctly.
- We do have automated graphics tests that cover dynamic batching; they run on iOS; and they did not notice any regressions.
Finding It
Since the regression is recent (4.6.1 worked, and was something like three weeks old), I chose to look at everything that changed since that release, and try to guess which changes are dynamic batching related, and could affect iOS but not the editor.
This is like a heuristic step before/instead of doing actual “bisecting the bug”. Unity codebase is large and testing builds isn’t an extremely fast process (mercurial update, build editor, build iOS support, build iOS application, run). If the bug was a regression from a really old Unity version, then I probably would have tried several in-between versions to narrow it down.
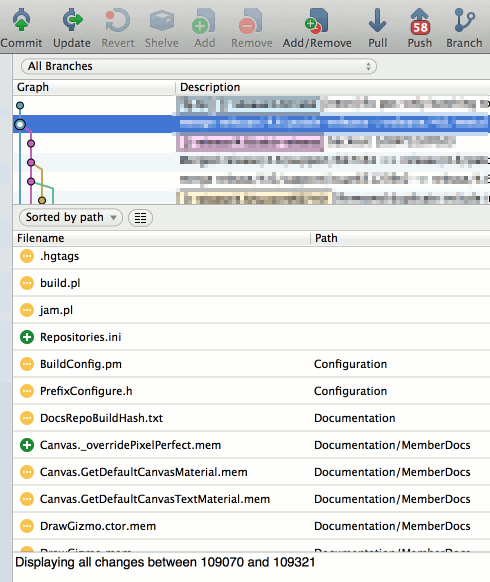
I used perhaps the most useful SourceTree feature - you select two changesets, and it shows the full diff between them. So looking at the whole diff was just several clicks away:
A bunch of changes there are immediately “not relevant” - definitely everything documentation related; almost definitely anything editor related; etc.
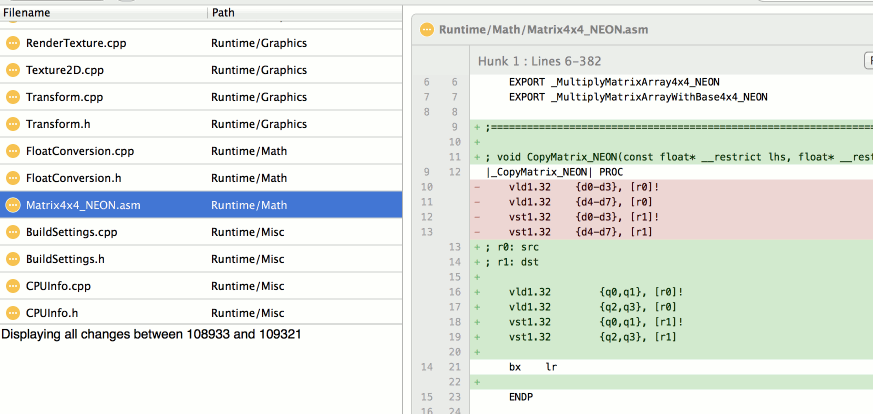
This one looked like a candidate for investigation (a change in matrix related ARM NEON code):
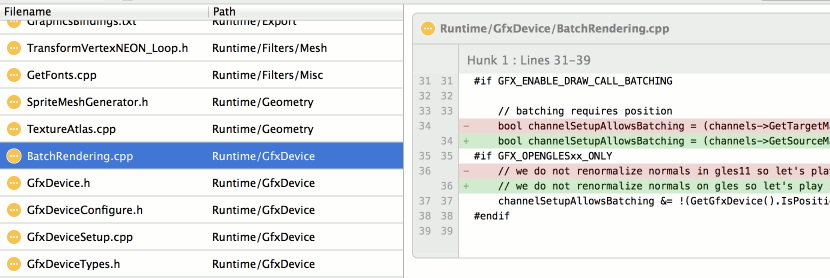
This one interesting too (a change in dynamic batching criteria):
And this one (a change in dynamic batching ARM NEON code):
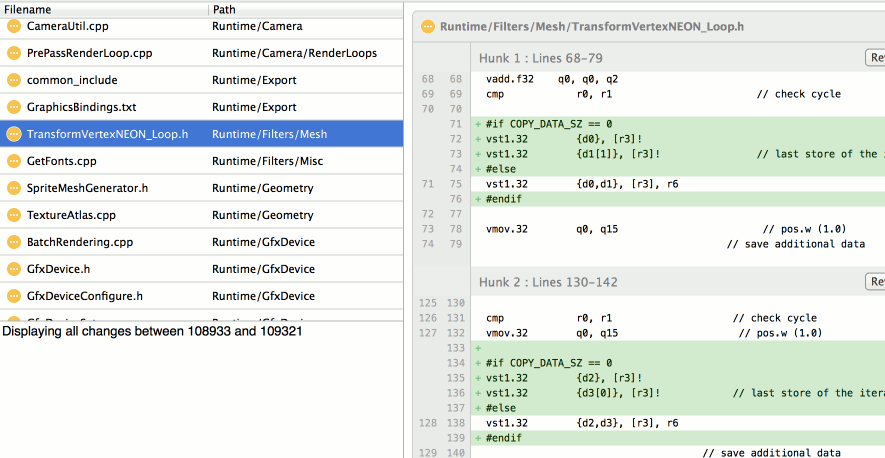
I started looking at the last one…
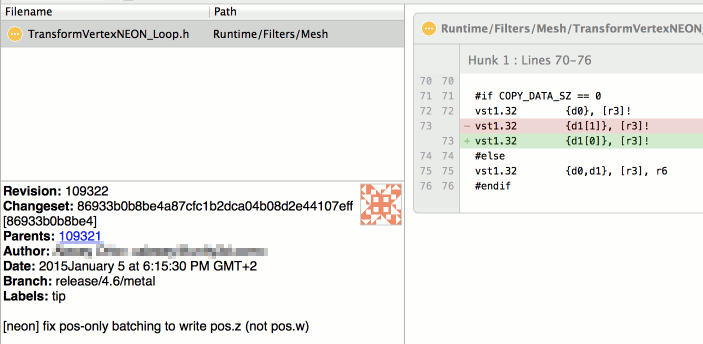
Lo and behold, it had a typo indeed; the {d1[1]} thing was storing the
w component of transformed vertex position, instead of z like it’s supposed to!
The code was in the part where dynamic batching is done on vertex positions only, i.e. it was only used on objects with shaders that only need positions (and not normals, texture coordinates etc.). This explains why half of the scene was correct (pink objects use shader that needs normals as well), and why our graphics tests did not catch this (so turns out, they don’t test dynamic batching with position-only shaders).
Fixing It
The fix is literally a one character change:
…and the batching code is getting some more tests.