time-trace: timeline / flame chart profiler for Clang
Update: this has landed to LLVM/Clang mainline! So if all goes well, Clang 9.0 should contain this functionality. The upstreaming commit landed on 2019 March 30; thanks Anton Afanasyev for doing the work of landing it!
I wanted Clang to emit timeline (“flame chart”) style profiling info on where it spends time.
So I made it do that.
What kind of compiler profiler I want?
In the previous blog post I talked about how it is hard to get “useful” information on where C++ compilers spend their time. Various compilers have various ways of reporting something, but most of their reports seem to be geared towards the compiler developers themselves. For them it’s important to know, for example, whether register allocator is the bottleneck; for me as a compiler user that is much less of an importance – I want to know whether I’m bottlenecked by preprocessor / includes (if so, which ones?), parsing (if so, which classes/functions/templates?), template instantiation (if so, which ones?), code generation, backend optimizations, or something else.
Having added Chrome Tracing profiling outputs to other parts of our build system in the past (here or there), I quite like it. It’s not perfect, and the UI is not very good, but it gets the job done and the file format is trivial to write.
So I thought I’d try doing it – add some sort of flag to Clang that would emit the profiling information that I would find interesting. Turns out, getting to the “it seems to work” state was easier than I expected!
-ftime-trace: Chrome Tracing output for Clang
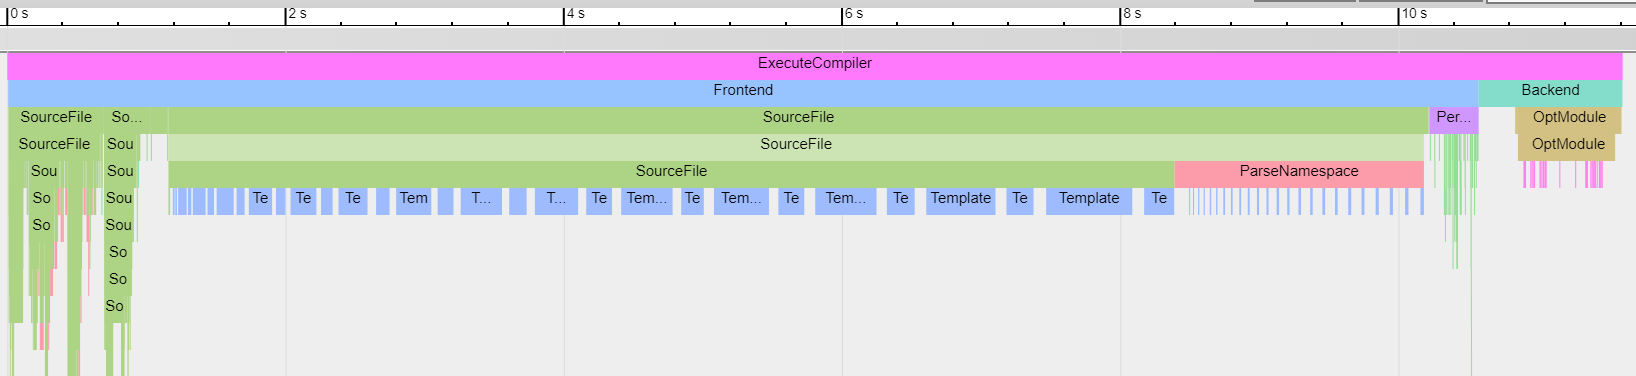
The very first thing I tried it on pointed out a really useful thing: we have a super slow to include header in one place. Just look:
This is a timeline / flame chart profiling view in Chrome chrome://tracing page. Horizontal axis is time, vertical is nested
“callstacks”, so to speak. And it very clearly shows that there is one header file that takes over 8 seconds to include.
I suspect it’s some sort of performance issue with Clang itself; Gcc and Msvc are quite a bit faster at including this file. Will try to gather data and report a bug.
The file itself does not feel that complex; without this view I would have never guessed that it’s the cause of these slow compile times. Yay visibility into what is going on!
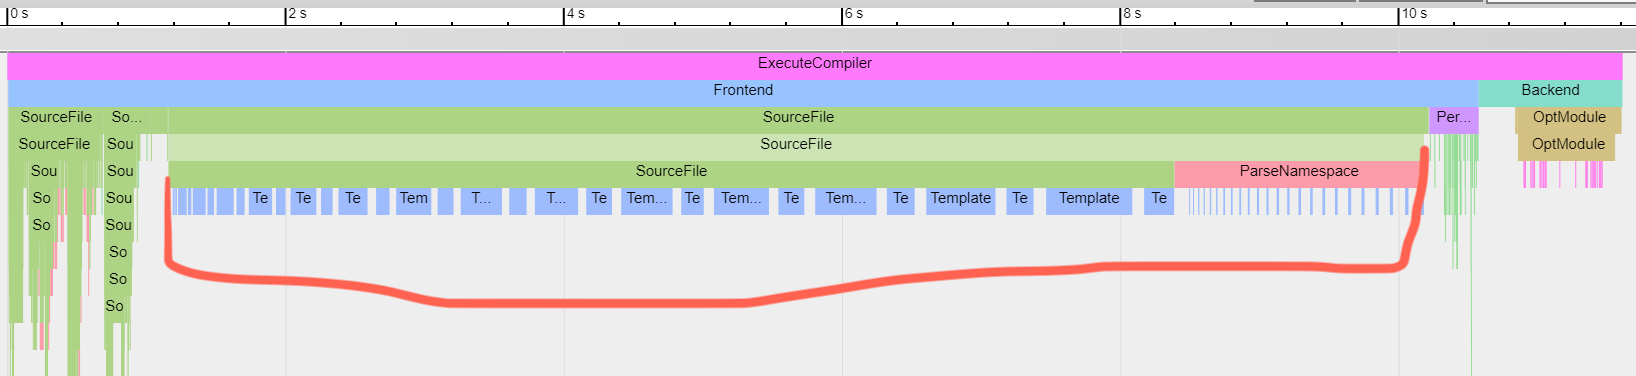
So that was already fairly useful. With this visualization, I can look into other files and see what they end up doing. And based on
that, decide what to do to make compiles faster. When including/parsing files takes up time, I can
tell which ones are the culprit exactly, and how long it takes to include them:
Already found some headers that took longer to process than you’d guess, and I’ve split them up into “rarely used, expensive” parts and “often used, cheap” parts.
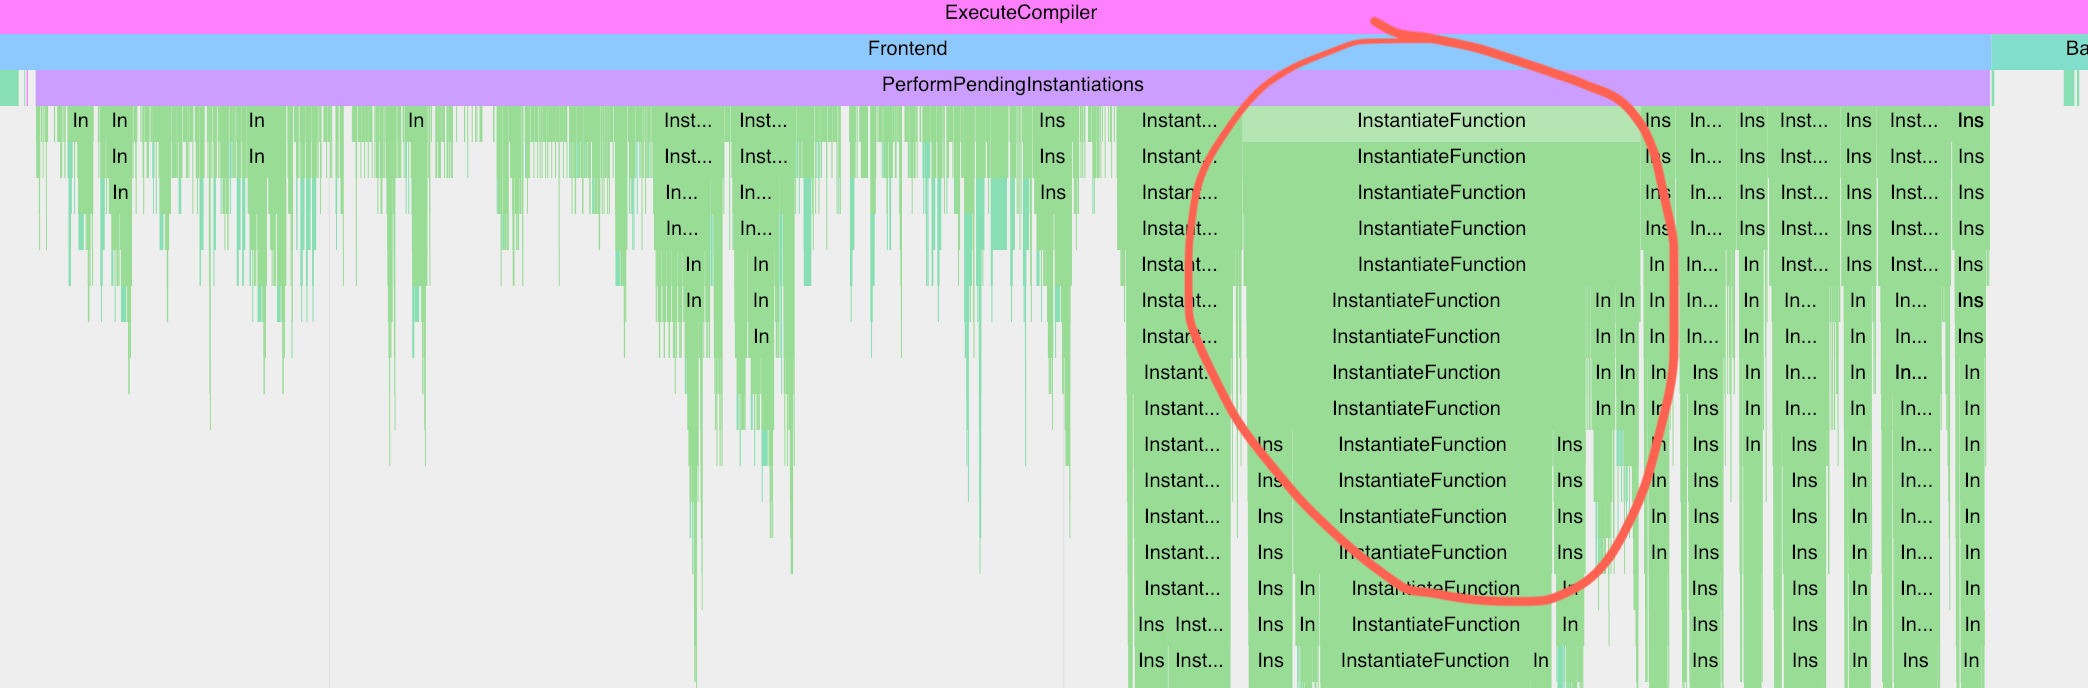
Or when looking at template instantiations, I can see which ones end up taking most time to process, and focus on improving them:
But can’t you figure that out with existing means?
Template instantiation I probably could via Templight and Templight-Tools. I built them, tried it on some files, wrestled with how to visualize the “callgrind” output (WinCacheGrind refused to open them, QCacheGrind worked but I found it a bit intimidating to use). The process of “compile with a special flag, get a file, run the file through a converter, open in some app” is a bit involved, plus the converters aren’t very fast.
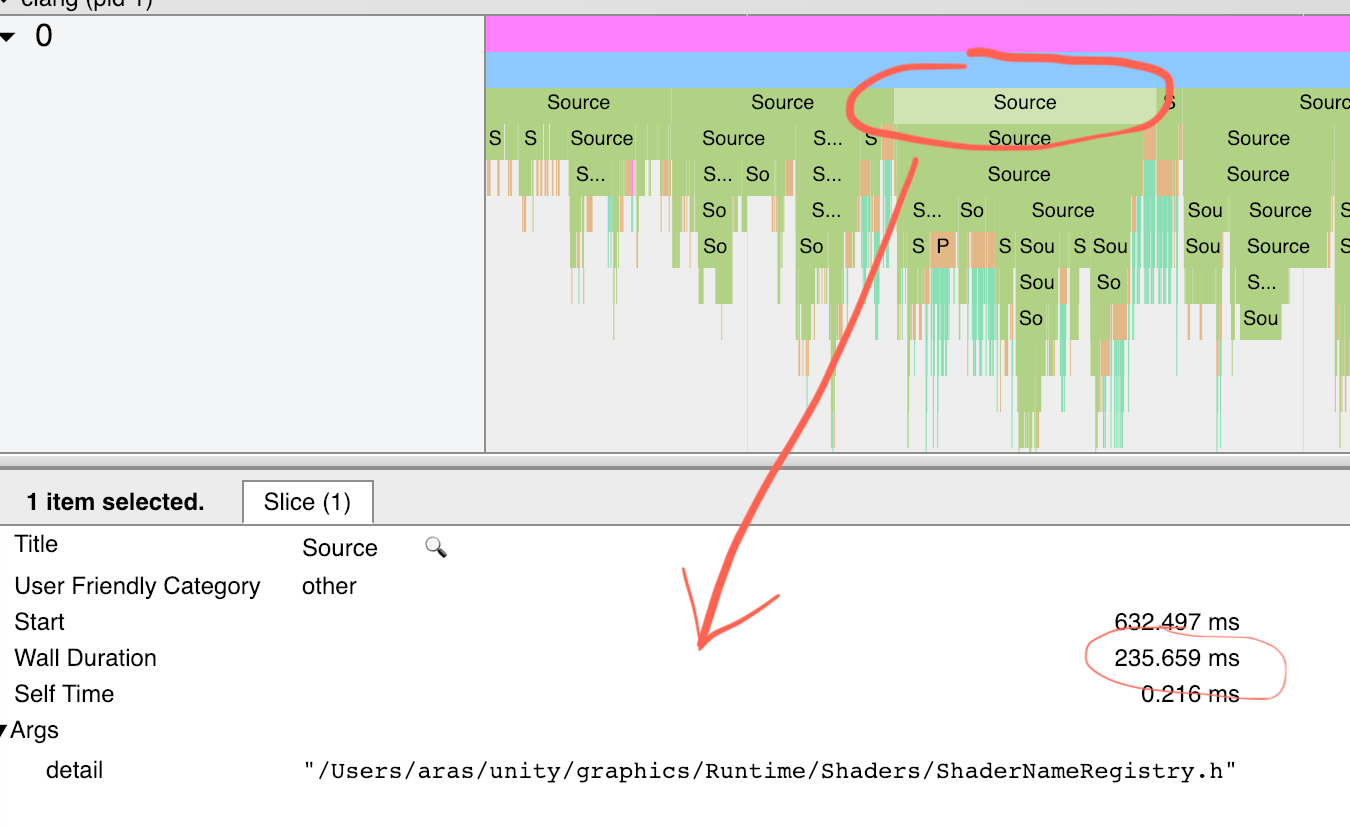
Using a “regular profiler” on Clang itself shows which parts of the compiler take up time, but does not show which parts of my code
it is spending that time on. For example on that “one file was very slow to parse” example from top of the post, running
Xcode Instruments profiler on Clang just shows this:
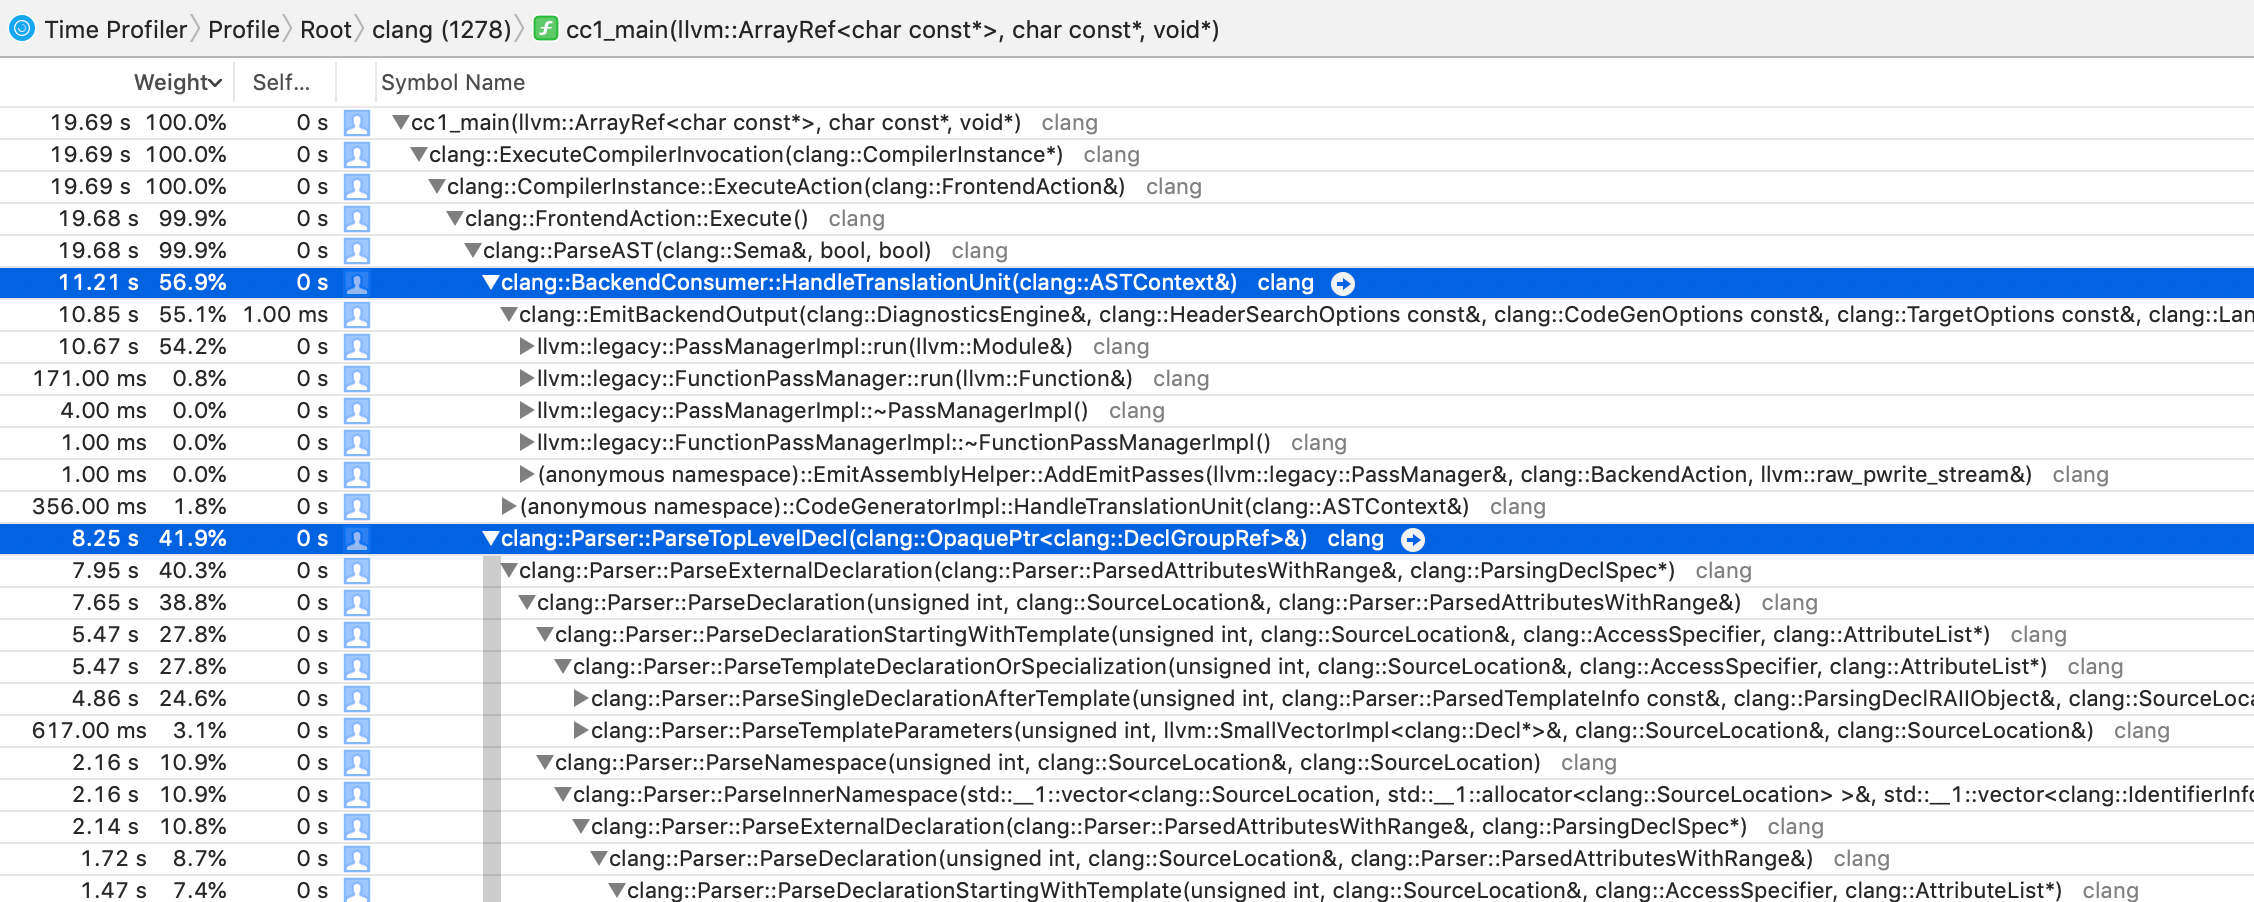
So I can see that “all the time is spent parsing”, but where exactly?
Ok where’s the code, and what now?
All the code is at this github PR for now, which is based on Clang 8.0.0-ish “trunk” as it was on 2019 January 10.
It adds a new command line flag to clang, -ftime-trace, that produces Chrome Tracing .json file next to the regular compiled object files.
I based it on the older LLVM/Clang “git monorepo”; they have switched to another github repository while I was doing it :) However the build instructions are the same as for regular LLVM/Clang. Some notes:
- Do use Ninja backend for building. Default Makefiles backend spends ages figuring out what to build, every time you do the build.
- Default build type is non-optimized Debug build. Build optimized Release build with the usual
-DCMAKE_BUILD_TYPE=RelWithDebInfoCMake flag. - On Windows, make sure to set
CC=clandCXX=clenvironment variables before invoking CMake. I had it pick up some random Gcc-based toolchain that was inside my Strawberry Perl install otherwise. - LLVM/Clang build is setup in such a way where any changes to the base “Support” library (where timing/profiling utilities are,
among other things) cause rebuild of almost everything. Add a comment into Timer.cpp file? There’s 2500 files to recompile!
And I wanted to add my profiling stuff in there…
- This seems to be because some utility that generates some headers (which the rest of LLVM/Clang depends on) itself uses the same “Support” library. The utility is llvm-tblgen; I don’t know what exactly it is, but I’ll assume it generates the famous Amiga demoscene groups, and you cannot change my mind.
- Turns out LLVM build has an option for “I have my own tblgen” (which I did have after building the whole stuff once) that you can
point the build to. Then it will stop rebuilding it, and thus stop regenerating most of the headers. Use
-DLLVM_TABLEGEN=path/to/tblgenoption to CMake for that. This cuts down “change anything in Support library” from “2500 files to recompile” down to about “250 files to recompile”. Still not cheap, but much better.
- Overall this was surprisingly easy! I mean I’ve never built LLVM/Clang before, and here, just 350 lines of code later, I have my own modified Clang with the profiling output I always wanted. Pretty good!
I’ve started a thread on Clang mailing list about my changes, and will see where that goes. There are some comments already; at some point I’d have to do a proper pull request via whatever is the LLVM/Clang code review tooling.
No idea whether any of this will get accepted into upstream Clang, but if not, then at least I will have my own Clang with the profiler I always wanted :)